


%20--%3e%3c!DOCTYPE%20svg%20PUBLIC%20'-//W3C//DTD%20SVG%201.0//EN'%20'http://www.w3.org/TR/2001/REC-SVG-20010904/DTD/svg10.dtd'%3e%3csvg%20version='1.0'%20id='Layer_1'%20xmlns='http://www.w3.org/2000/svg'%20xmlns:xlink='http://www.w3.org/1999/xlink'%20x='0px'%20y='0px'%20width='64px'%20height='64px'%20viewBox='5.5%20-3.5%2064%2064'%20enable-background='new%205.5%20-3.5%2064%2064'%20xml:space='preserve'%3e%3cg%3e%3ccircle%20fill='%23FFFFFF'%20fill-opacity='0'%20cx='37.785'%20cy='28.501'%20r='28.836'/%3e%3cpath%20fill='%23595959'%20d='M37.441-3.5c8.951,0,16.572,3.125,22.857,9.372c3.008,3.009,5.295,6.448,6.857,10.314%20c1.561,3.867,2.344,7.971,2.344,12.314c0,4.381-0.773,8.486-2.314,12.313c-1.543,3.828-3.82,7.21-6.828,10.143%20c-3.123,3.085-6.666,5.448-10.629,7.086c-3.961,1.638-8.057,2.457-12.285,2.457s-8.276-0.808-12.143-2.429%20c-3.866-1.618-7.333-3.961-10.4-7.027c-3.067-3.066-5.4-6.524-7-10.372S5.5,32.767,5.5,28.5c0-4.229,0.809-8.295,2.428-12.2%20c1.619-3.905,3.972-7.4,7.057-10.486C21.08-0.394,28.565-3.5,37.441-3.5z%20M37.557,2.272c-7.314,0-13.467,2.553-18.458,7.657%20c-2.515,2.553-4.448,5.419-5.8,8.6c-1.354,3.181-2.029,6.505-2.029,9.972c0,3.429,0.675,6.734,2.029,9.913%20c1.353,3.183,3.285,6.021,5.8,8.516c2.514,2.496,5.351,4.399,8.515,5.715c3.161,1.314,6.476,1.971,9.943,1.971%20c3.428,0,6.75-0.665,9.973-1.999c3.219-1.335,6.121-3.257,8.713-5.771c4.99-4.876,7.484-10.99,7.484-18.344%20c0-3.543-0.648-6.895-1.943-10.057c-1.293-3.162-3.18-5.98-5.654-8.458C50.984,4.844,44.795,2.272,37.557,2.272z%20M37.156,23.187%20l-4.287,2.229c-0.458-0.951-1.019-1.619-1.685-2c-0.667-0.38-1.286-0.571-1.858-0.571c-2.856,0-4.286,1.885-4.286,5.657%20c0,1.714,0.362,3.084,1.085,4.113c0.724,1.029,1.791,1.544,3.201,1.544c1.867,0,3.181-0.915,3.944-2.743l3.942,2%20c-0.838,1.563-2,2.791-3.486,3.686c-1.484,0.896-3.123,1.343-4.914,1.343c-2.857,0-5.163-0.875-6.915-2.629%20c-1.752-1.752-2.628-4.19-2.628-7.313c0-3.048,0.886-5.466,2.657-7.257c1.771-1.79,4.009-2.686,6.715-2.686%20C32.604,18.558,35.441,20.101,37.156,23.187z%20M55.613,23.187l-4.229,2.229c-0.457-0.951-1.02-1.619-1.686-2%20c-0.668-0.38-1.307-0.571-1.914-0.571c-2.857,0-4.287,1.885-4.287,5.657c0,1.714,0.363,3.084,1.086,4.113%20c0.723,1.029,1.789,1.544,3.201,1.544c1.865,0,3.18-0.915,3.941-2.743l4,2c-0.875,1.563-2.057,2.791-3.541,3.686%20c-1.486,0.896-3.105,1.343-4.857,1.343c-2.896,0-5.209-0.875-6.941-2.629c-1.736-1.752-2.602-4.19-2.602-7.313%20c0-3.048,0.885-5.466,2.658-7.257c1.77-1.79,4.008-2.686,6.713-2.686C51.117,18.558,53.938,20.101,55.613,23.187z'/%3e%3c/g%3e%3c/svg%3e)
%20--%3e%3c!DOCTYPE%20svg%20PUBLIC%20'-//W3C//DTD%20SVG%201.0//EN'%20'http://www.w3.org/TR/2001/REC-SVG-20010904/DTD/svg10.dtd'%3e%3csvg%20version='1.0'%20id='Layer_1'%20xmlns='http://www.w3.org/2000/svg'%20xmlns:xlink='http://www.w3.org/1999/xlink'%20x='0px'%20y='0px'%20width='64px'%20height='64px'%20viewBox='5.5%20-3.5%2064%2064'%20enable-background='new%205.5%20-3.5%2064%2064'%20xml:space='preserve'%3e%3cg%3e%3ccircle%20fill='%23FFFFFF'%20fill-opacity='0'%20cx='37.637'%20cy='28.806'%20r='28.276'/%3e%3cg%3e%3cpath%20fill='%23595959'%20d='M37.443-3.5c8.988,0,16.57,3.085,22.742,9.257C66.393,11.967,69.5,19.548,69.5,28.5c0,8.991-3.049,16.476-9.145,22.456%20C53.879,57.319,46.242,60.5,37.443,60.5c-8.649,0-16.153-3.144-22.514-9.43C8.644,44.784,5.5,37.262,5.5,28.5%20c0-8.761,3.144-16.342,9.429-22.742C21.101-0.415,28.604-3.5,37.443-3.5z%20M37.557,2.272c-7.276,0-13.428,2.553-18.457,7.657%20c-5.22,5.334-7.829,11.525-7.829,18.572c0,7.086,2.59,13.22,7.77,18.398c5.181,5.182,11.352,7.771,18.514,7.771%20c7.123,0,13.334-2.607,18.629-7.828c5.029-4.838,7.543-10.952,7.543-18.343c0-7.276-2.553-13.465-7.656-18.571%20C50.967,4.824,44.795,2.272,37.557,2.272z%20M46.129,20.557v13.085h-3.656v15.542h-9.944V33.643h-3.656V20.557%20c0-0.572,0.2-1.057,0.599-1.457c0.401-0.399,0.887-0.6,1.457-0.6h13.144c0.533,0,1.01,0.2,1.428,0.6%20C45.918,19.5,46.129,19.986,46.129,20.557z%20M33.042,12.329c0-3.008,1.485-4.514,4.458-4.514s4.457,1.504,4.457,4.514%20c0,2.971-1.486,4.457-4.457,4.457S33.042,15.3,33.042,12.329z'/%3e%3c/g%3e%3c/g%3e%3c/svg%3e)
1 Introduction
Chinese languages have a specific set of segments, known as apical vowels. To date, their exact nature remains a source of debate: Some view these segments as genuine vowels, while others consider them to be consonants (fricatives or approximants). In the current study we explore the apical vowel in Jixi-Hui Chinese (JHC)  . The apical vowel in JHC is of a special interest in contributing to a better understanding of the nature of these segments, since it displays two structural properties that make it different from the most studied variants in other Chinese languages: It is a separate phoneme contrastive to /i/ and to other vowels and it occurs not only following alveolar sibilants but also after bilabial plosives /p pʰ/, bilabial nasal /m/ and alveolar nasal /n/.
This article is organised as follows. We first present a brief review of the literature on apical vowels in Chinese languages. This is followed by a description of JHC apical vowel based on common principles of phonological analyses: lexical distribution, phonemic contrast, and function within the syllable. We then report results from two experiments to determine the phonetic characteristics of this segment, based on acoustic and ultrasound data. We conclude with discussion of the fricative/approximant nature of JHC apical vowel.
1.1 Apical vowels in Chinese languages: A brief reviewFootnote 1
Most previous studies on apical vowels have focused on Standard Chinese or Beijing Mandarin, but apical vowels are also attested in other Chinese languages (Wu Reference Wu1995, Wang Reference Wang2006, Hu Reference Hu2007, Hou Reference Hou2009), and some non-Chinese Sino-Tibetan languages (Baron Reference Baron1974, Michaud Reference Michaud2008, Wang Reference Wang2010). The presence of apical vowels in all these languages has always been related to a historical /i/ at some stage of the evolution (Zhu Reference Zhu2004, Zhao Reference Zhao2007, Jacques & Michaud Reference Jacques and Michaud2011, Gong Reference Gong2016).
1.1.1 Apical vowels in Standard Chinese
The terminology ‘apical vowels’ and the non-IPA symbols  used to transcribe them date back to Karlgren (Reference Karlgren1915)’s study of Standard Chinese (SC), and have been widely used since then among researchers working on the phonetics and phonology of Chinese (R. Cheng Reference Cheng1966, Trubetzkoy Reference Trubetzkoy1969, C. Cheng Reference Cheng1973, Howie Reference Howie1976, Svantesson Reference Svantesson1984, Ladefoged & Maddieson Reference Ladefoged and Maddieson1996, Zee & Lee Reference Zee and Lee2007, Faytak & Lin Reference Faytak and Lin2015, Shi, Peng & Liu Reference Shi, Peng, Liu, Wang and Sun2015, Faytak Reference Faytak2018). Although these symbols are widely used in the transcription of Chinese (e.g. for the minimal pair [sɿ55]
 ‘silk’ and [ʂʅ55]
 ‘poem’), they are not accepted by the IPA. The 1949 Principles of IPA (IPA 2010) consider [ɿ] as a ‘ɯ-type sound accompanying friction’ thus ‘resembling z’, and [ʅ] ‘accompanying friction and resembles ʒ’. Pullum & Ladusaw (Reference Pullum and Ladusaw1996) think that [ɿ] is ‘essentially a syllabic [z]’ and [ʅ] ‘essentially a syllabic [ᶎ] or maybe [ʒ]’.
Trubetzkoy (Reference Trubetzkoy1969: 171) described apical vowels as ‘a type of vowel with a much lesser degree of aperture and with a much more fronted position of articulation than, for example, i, so that a friction like noise resembling a humming is audible in its production’. Several reasons have been put forth to argue that these segments are vowels (R. Cheng Reference Cheng1966, C. Cheng Reference Cheng1973, Duanmu Reference Duanmu2007). First, they are allophonic variants of the vowel /i/; [ɿ] occurs after dental sibilants, [ʅ] occurs after retroflex sibilants, and [i] occurs elsewhere. Second, they behave as vowels in that they are syllable nuclei and can be tone-bearing units. Third, they sometimes have phonetic characteristics of a vowel: they have formants (Howie Reference Howie1976, Svantesson Reference Svantesson1984, Shi et al. Reference Shi, Peng, Liu, Wang and Sun2015) and may be produced with a raised tongue body (Zhou & Wu Reference Zhou and Wu1963, C. Cheng Reference Cheng1973).
There are also reasons, however, to consider these segments as fricatives. First, they contain frication noise (Ladefoged & Maddieson Reference Ladefoged and Maddieson1996, Yu Reference Yu1999, Faytak & Lin Reference Faytak and Lin2015). Second, they are always homorganic with the preceding sibilant consonants (Chao Reference Chao1961, Reference Chao1968). Third, they have the same tongue gesture and alveolar or post-alveolar constriction as the fricatives /s/ and /ʂ/ (Zhou & Wu Reference Zhou and Wu1963). From a phonological point of view, Dell (Reference Dell1994) considered these segments as syllabic fricatives and interpreted them as the voiced prolongation of the preceding sibilant consonants. Wiese (Reference Wiese1997) and Duanmu (Reference Duanmu2007) analysed these segments as empty syllable nuclei. For Duanmu (Reference Duanmu2007), the sibilant property of apical vowels is triggered by the spreading of the feature [+fricative] from the preceding onset consonant.
The analysis of apical vowels as fricatives has been questioned by some recent studies, while still arguing that these segments are consonants (Lee & Zee Reference Lee and Zee2003, Lee-Kim Reference Lee-Kim2014). In their IPA description of SC, Lee & Zee (Reference Lee and Zee2003), who use the same symbol [ɹ̩] to transcribe the two apical vowels [ɿ ʅ], describe them as ‘syllabic apical post-alveolar approximant’ and ‘syllabic apico-laminal or laminal dento-alveolar approximant’. For Lee-Kim (Reference Lee-Kim2014), [ɿ] and [ʅ] are syllabic approximant counterparts of the dental and retroflex sibilants, respectively. Her acoustic and articulatory data showed that these segments display very short durations of frication noise and are homorganic to the sibilant onsets, with a slightly retracted tongue root for [ɿ] and a slightly lowered tongue body for [ʅ]. The short frication noise observed is, according to Lee-Kim, a consequence of gestural overlap with the preceding sibilants.
The different definitions of apical vowels in SC (i.e. vowel, fricative or approximant) depend on the weight assigned to phonetic or phonological criteria. On the one hand, the analysis of this segment as a vowel is essentially based on the phonological patterning of apical vowels: (i) they are allophonic to vowel /i/; (ii) they function as syllable nuclei; and (iii) they can be tone-bearing units. This point of view is phonologically convenient since it complies with the canonical syllable structure of SC, in that the nucleus of a syllable should contain a vowel.Footnote 2 In this view, the acoustic presence of a formant structure in apical vowels is considered as supplementary evidence for a vowel analysis. On the other hand, the analysis of apical vowels as fricatives is based mainly on phonetic observations, i.e. the acoustic presence of frication noise and the same tongue configuration as for /s/ and /ʂ/. This analysis is however phonologically unnatural since it assumes that an underlying vowel (here /i/) has consonants as allophonic variants (Wiese Reference Wiese1997). It also assumes that the fricative consonants in [sz ʂʐ] syllables are tone-bearing units, a striking exception to the behaviour of other obstruents in the language.
The approximant analysis is also based on phonetic observations. It captures the fact that the tongue shape is slightly different between the sibilant onsets and the apical vowel, and thus explains the absence of frication noise in some cases. The absence of frication noise is not consistent across all studies, however. While Lee-Kim (Reference Lee-Kim2014) reports no or little frication noise on apical vowels, other researchers report important interspeaker variation (Faytak & Lin Reference Faytak and Lin2015).
The difficulty encountered in the analysis of apical vowels in SC is that their phonetic implementation does not match their phonological behaviour. The former provides evidence for a consonant analysis while the latter provides arguments for a vowel analysis. The same dilemma, as we show below, has been faced by researchers working on apical vowels in other Chinese languages.
1.1.2 Apical vowels in other Chinese languages
Hefei-Mandarin Chinese  (HMC) is a Mandarin dialect of Jianghuai-Mandarin
 group (Li, Xiong & Zhang Reference Li, Xiong and Zhang1987). It has in addition to
 a third apical vowel [ʮ], which represents the rounded version of [ɿ] (Karlgren Reference Karlgren1915: 297; Kong, Wu & Li Reference Kong, Wu and Li2019). Unlike in SC, the apical vowel [ɿ] in HMC can be preceded not only by a homorganic onset (i.e. [ts tsʰ s z]) but also by [p pʰ m] (Kong et al. Reference Kong, Wu and Li2019). At the phonetic level, the study from Hou (Reference Hou2009) reports that the HMC apical vowel [ɿ] has strong high-frequency frication noise in the 3000–5000 Hz region, but the frication noise does not extend to the end of the segment. Hou (Reference Hou2009) considers the apical vowels as fricative vowels
 but does not provide further discussion on its phonological patterning. Kong et al. (Reference Kong, Wu and Li2019) also report that the three apical vowels display frication noise, with male speakers having more frication than female speakers. Following Ladefoged & Maddieson (Reference Ladefoged and Maddieson1996), they treat this frication as a secondary vowel feature, introduced to enhance the perceptual saliency of the apical vowels.
Qinghai-Mandarin Chinese (QMC)  is a Mandarin dialect of Lanyin-Mandarin
 group (Li et al. Reference Li, Xiong and Zhang1987). It has one apical vowel [ɿ] which is phonologically analysed as a free variant of /i/ (Wang Reference Wang2006). Similar to HMC, [ɿ] in QMC is not always homorganic to the preceding onset consonant, as it can be preceded by /p pʰ m l s ts tsʰ/. To our knowledge, there has been no published study to date describing the phonetic characteristics of this apical vowel.
An interesting case has been observed in Suzhou-Wu Chinese  (SWC), a Wu
 group Chinese language (Li et al. Reference Li, Xiong and Zhang1987). This language has two apical vowels, a rounded /ʮ/ and an unrounded /ɿ/, both occurring after sibilant onsets /ts tsʰ s z/ (Ye Reference Ye1993). Interestingly, these apical vowels are independent phonemes which contrast with /i/, as shown by the following minimal triplet: /sɿ315/
 ‘four’ vs. /s
 315/
 ‘world’ vs. /si315/
 ‘small’. For Faytak (Reference Faytak2018: 45) these segments ‘have an apico-alveolar constriction similar to a /z/ and could be transcribed as syllabic rounded and unrounded alveolar fricatives with a loose degree of constriction, i.e. syllabic, lowered [z zw]; both exhibit noticeable strident frication with a [z]-like quality’. Ling’s (Reference Ling2009) acoustic and articulatory (EMA) analyses show that the two apical vowels display similar F1 and F2 values, present frication noise in the 3000–8000 Hz region, and have a flat or concave tongue shape and an apico-alveolar constriction.
As can be inferred from the studies above, apical vowels do not display similar structure and behaviour across Chinese languages. Depending on the language, they can have a more or less restricted distribution and can be phonemic or allophonic. Depending also on the language, and sometimes on the speaker, apical vowels may exhibit a more or less salient frication noise. Our study builds on the works reviewed above and provides a novel contribution by examining the nature of the apical vowel in an understudied Chinese language, Jixi-Hui Chinese. We first introduce some phonological characteristics of the apical vowel in this language, before reporting two production experiments designed to examine its acoustic and articulatory characteristics. We hereafter adopt the symbol /z/ to transcribe this segment, following the IPA guidelines (see also Chao Reference Chao1961, Reference Chao1968; Dell Reference Dell1994; Wiese Reference Wiese1997; Yu Reference Yu1999; Duanmu Reference Duanmu2007).
Monophthong phonemes of JHC (adapted from Zhao Reference Zhao2003). The apical vowel, represented by /ɿ/ in Zhao’s description, is not shown in this figure. The /ʉ/ vowel is transcribed as /ɵ/ in Zhao’s description, but our acoustic and ultrasonic data show that it is best transcribed as /ʉ/.

1.2 The apical vowel in Jixi-Hui Chinese
Jixi-Hui Chinese is a Hui  group language, spoken in the Jixi county, located 280 km southwest of Shanghai, in Anhui province
 . It has two major variants, the Lingnan
 variant (Luo Reference Luo, Gengsheng and Hongkai1936, Zhao Reference Zhao1989, Hirata Reference Hirata1998, Zhao Reference Zhao2003), which is the variant examined in this study, and the Lingbei
 variant (Chao Reference Chao1962, Chao & Yang Reference Chao and Yang1965). The administrative centre is the town of Huayang
 , where the Lingnan variant is spoken. According to the most recent description (Zhao Reference Zhao2003), the vocalic system of JHC consists of eight monophthong phonemes (excluding the apical vowel), as shown in Figure 1.
The consonants of JHC are presented in Table 1 (based on Zhao Reference Zhao2003). Among the consonants, three can function as syllabic nuclei: [v m n]. Items with syllabic nasals [m n] are not lexically frequent, but they are not limited to interjections as in SC, as the examples in (1) show:

The syllabic fricative [v], which is a contextual variant of /u/, is more frequent (Zhao Reference Zhao2003). JHC has six tones including a checked tone. These are presented in Table 2. Syllables containing the apical vowel [z] occur on all five non-checked tones.
Consonants of JHC according to Zhao (Reference Zhao2003).

Tones of JHC according to Zhao (Reference Zhao2003), represented in tone letters (Chao Reference Chao1930) and in IPA tone symbols.

1.2.1 The phonological patterning of JHC apical vowel
Syllables containing /z/ in JHC are not uncommon, accounting for 7.2
 $\%$
of the monosyllabic entries of Zhao’s (Reference Zhao2003) dictionary. This segment behaves in a different way compared to the apical vowels in SC. First, /z/ is a distinct phoneme, which can contrast with /i/ and other vowels, as shown by the minimal pairs and triplets in (2):Footnote 3

Second, it can be preceded by /p pʰ m n/ in addition to /ts tsʰ s/, showing that it is not always homorganic with the preceding onset.Footnote 4 As shown in (3), /z/ can also stand for a syllable on its own:

Third, similar to SC apical vowels, /z/ in JHC can be a tone-bearing unit and can undergo tone sandhi processes. This is shown in (4):

To sum up, the phonological behaviour of /z/ in JHC is similar to the behaviour of a vowel. It can be the nucleus of a syllable and a tone-bearing unit, and can undergo tone sandhi processes. However, as we will show below, acoustic and ultrasound data provide evidence that /z/ has the phonetic characteristics of a consonant.
2 Production experiment I: Acoustic study
This experiment aims to determine whether [z] displays acoustic characteristics of a vowel or a consonant. We analyse the formant structure of the apical vowel, and provide a detailed analysis of the frication noise that accompanies this segment.
2.1 Speakers
Speakers of JHC were recruited according to strict criteria to limit possible dialectal variation. They had to be born and raised in the town of Huayang, with both parents also born in the same town. Further criteria were that they had to live in the town of Huayang and speak JHC on a daily basis, and their age should be around 50 years old. Since JHC speakers all understand and speak SC, as it is common for Chinese people living in a city, we selected only those who speak JHC in both professional and non-professional contexts to limit the influence of SC. Five female speakers (FS1–5) and five male speakers (MS1–5) satisfying these criteria were chosen to participate in the study. The mean age of the speakers was 49 years (±3.8). None of them reported to have speech-related anomalies, and all of them considered themselves as native speakers of JHC with no accent.
2.2 Materials
Acoustic data were recorded with a hypercardioid headset microphone (AKG C520), an external sound card (Edirol UA25) and Audacity (v. 2.1.0) on a portable computer. The sampling rate was set to 44100 Hz. We had access to the sound attenuated studio of the local television channel for our recording sessions. Our speakers sat in a chair and read a word list embodied in a carrier sentence at a normal speech rate. The word list (see Table 3) was constructed with the segments /i a u ʉ z/ occupying the nuclei of monosyllabic words starting with /p pʰ m n ts tsʰ s/. With different tones, they form single noun phrases, presented to the speakers in Chinese characters. Each word was produced within the carrier phrase [ki44ɕᴐ213_ ɕᴐ213sᴐ44fa44] ‘He writes _ three times’. The entire list was repeated five times per speaker, yielding 2150 tokens ([z]: 550, [i]: 400, [u]: 450, [a]: 350, [ʉ]: 400).Footnote 5
The word list used in data acquisition for both acoustic and ultrasound studies.

2.3 Data analysis
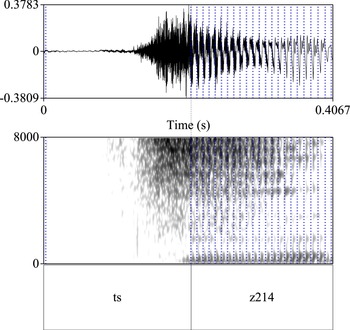
The recorded acoustic data were segmented and annotated using Praat (Boersma & Weenink Reference Boersma and Weenink2018). It was challenging to determine a clear boundary between a sibilant onset and the following apical vowel (for example in [tsz]). We labelled our data by taking the first voicing pulse detected in Praat as the beginning of the apical vowel. This is illustrated in Figure 2.
Illustration of the segmentation used to delimit a sibilant onset and an apical vowel within the word [tsz214] as pronounced by FS3. The dotted lines on the signal represent voicing pulses detected by Praat.

Measurement criteria were established after visual inspection of both spectrograms and waveforms. The following parameters were considered:
-
(i) Frication in apical vowels. This aspect was obtained through visual inspection of the acoustic waveforms and spectrograms for all utterances. Fricated apical vowels were those exhibiting a degree of turbulent airflow on the spectrogram in the high and mid frequencies.
-
(ii) Formant values of [a i u ʉ] and [z]. A Praat script trisected all vocalic segments and calculated mean F1, F2 and F3 values at the middle third of the target segments. The maximum frequency of formant calculation was set to 5500 Hz for female speakers and 5000 Hz for male speakers.
-
(iii) Zero-crossing rate (ZCR) of [a i u ʉ] and [z]. The upward and downward zero-crossing points within a 40 ms sliding-window on the acoustic signals were obtained as a PointProcess object in Praat. The zero-crossing rate was calculated as the number of zero-crossings divided by the length of the window. Fifty-two data points (the onset and offset of [a i u ʉ z] and 50 data points evenly spaced throughout each segment) were extracted and analysed.
2.4 Results
2.4.1 Frication in apical vowels
The examination of the waveforms and spectrograms showed that 88
 $\%$
of the realisations of [z] (472 out of 537 tokens)Footnote 6 were produced with frication noise. As shown in Table 4, frication noise was observed for all speakers and in all contexts. The amount of the frication noise varied greatly, with the majority of cases displaying frication in less than half of the [z] duration. Some illustrative examples are shown in Figure 3, with apical vowels displaying frication following [p m n].
The presence of frication in apical vowels was not dependent on the nature of the preceding consonant, as it was implemented following either sibilants or non-sibilants. Given that the labial stop [p] and the nasals [m n] had clearly no frication to spread, the frication noise displayed by [z] in these contexts suggests that it is an inherent property of this segment. It is important to note, however, that frication noise never extended until the end of apical vowel. When frication diminished, periodic waveforms became clearer, and formant structures were visible in the spectrograms. Note also that this frication was systematically superposed on voicing, showing that frication does not necessarily inhibit the voicing of the apical vowel. A more detailed analysis concerning this parameter in different contexts is presented in Section 2.4.3.
The strict segmentation criteria applied in this study ensured that only the voiced portion of [z] was taken into account. A probable consequence of this segmentation is that [z] displayed shorter duration after [s ts tsʰ pʰ]Footnote 7 than after [p m n] (Table 5). Given that [z] is homorganic to the coronal sibilant onsets, it could be the case that part of the frication noise at the offset of the sibilant onsets was, in fact, the onset of the frication noise of [z] (suggesting that [z] was probably longer than what the segmentation criteria used indicated).
Qualitative observation of the presence of frication noise on [z] in JHC. Presence of frication noise in each context is classified according to the quantity of observable noise on each [z] segment. < indicates that frication noise is observable over less than half the duration of [z]; > indicates that it is observable over more than half the duration of [z]; ≈ indicates that it is observable over roughly half the duration of [z]; two symbols in the same context indicate that both cases are observed for the same speaker.

FS = female speaker; MS = male speaker
The waveforms and spectrograms of JHC apical vowels containing frication noise. The productions of [pz214 nz44 mz214] come from speakers FS1, MS3 and MS2, respectively.

Mean durations (ms) of [z] after different onsets, with standard deviations in parentheses.

2.4.2 Formant analysis
We calculated mean formant values at the middle third of [z], where the frication noise started diminishing and a clear formant structure became visible. The values obtained were compared to the formant values of the vowels [a i u ʉ]. The results for F1 and F2 are presented in Figure 4.Footnote 8 They show that the values of [z] overlapped those of [ʉ] for female speakers and those of [ʉ] and [u] for male speakers.
Scatter plot of formant values in Hz of [i u a ʉ z] of JHC. Data points represent mean values of the middle third of each segment, with 95
 $\%$
confidence ellipses. Female speakers (FS) are on the left and male speakers (MS) on the right.

We conducted linear mixed-effects analyses to compare the differences in F1, F2 and F3 across the three segments [z u ʉ]. The formant values were converted to the Bark scale (Traunmüller Reference Traunmüller1990) to better capture their auditory properties. We used R (R Core Team 2017) and lme4 (Bates et al. Reference Bates, Mächler, Bolker and Walker2015) to perform linear mixed-effects analyses of the relationship between formants and the three segments. In the models, we entered Bark-scaled formants as dependant variables, and we entered segments as fixed effects. As random effects, we had by-speaker random slopes for the effect of segments. Visual inspection of residual plots did not reveal any obvious deviations from homoscedasticity or normality. The results are reported in Table 6.Footnote 9 F1 values of [u] and [z] did not differ significantly, with both having higher F1 values than [ʉ]. The results further confirmed that for all speakers, F2 values of [ʉ] and [z] were not significantly different. F3 values were significantly lower in [u ʉ] than in [z], reflecting the fact that [u ʉ] are rounded vowels whereas [z] does not involve lip rounding.
Statistical results of linear mixed-effects analyses conducted on formant values (Bark-scaled) of [z u ʉ] in JHC; standard deviations in parentheses.

FS = female speakers; MS = male speakers
* p < .05; * * p < .01; * * * p < .001; n.s. = non-significant p-values
2.4.3 Zero-crossing-rate of syllable nuclei
ZCR is defined as the number of times in a given time-interval the speech signal passes zero. It measures the times of zero-crossings in a given time-interval, without involving the detection of voicing or pitch. It is considered to be a reliable measurement of the intensity of frication noise (Shosted Reference Shosted2006), with higher ZCR indicating higher aperiodicity. ZCR can be used for all syllable nuclei regardless of their phonetic nature, and it is less speaker-dependent than spectral analyses (Ito & Donaldson Reference Ito and Donaldson1971). This measurement has been applied for fricatives and vowels (Ito & Donaldson Reference Ito and Donaldson1971), nasalised fricatives (Bombien Reference Bombien2006), or aspirated vowels (Gordeeva & Scobbie Reference Gordeeva and Scobbie2010). We present ZCR as a variable over the normalised duration of the concerned segments.
ZCR values of [a i u ʉ] and [z] are presented in Figure 5. As the figure shows, [z] behaved differently from the vowels. It started with a very high ZCR (well above 1000 times per second), corresponding to the frication noise observed at the beginning of the segment, then ZCR lowered, which corresponded to the slow disappearance of this noise.
Zero-crossing rate (ZCR) of [a i u ʉ z] in JHC. The curves were generated using the loess smoothing method. The x-axis represents normalised time of the vocalic segments and the y-axis represents the zero-crossing times per second. Female speakers (FS) are shown on the left and male speakers (MS) are on the right.

Zero-crossing rate of [z] in different consonantal contexts in JHC. The curves were generated using the loess smoothing method, x-axis represents normalised time of the [z] segments and the y-axis represents the zero-crossing times per second. Female speakers (FS) are shown on the left and male speakers (MS) are on the right.

Figure 6 shows the relation between ZCR values of [z] and the nature of the preceding consonant. All [z] segments displayed a high ZCR rate (i.e. above 1000 times per second), regardless of whether the preceding consonant was a sibilant or not (at least during the first half). The contexts where [z] was preceded by [m n] displayed a noticeable divergence from the other contexts. ZCR started at a lower level and increased to achieve a rather high level before the final falling phase. This lower ZCR at the starting point could be attributed to the nasality of the preceding consonants, as nasal consonants require an open nasal cavity that prevents high intraoral pressure. After the release of the nasal consonant, the nasal cavity closes, and intraoral pressure increases gradually. The gradual closure of the nasal cavity led to a gradual increase of the intraoral pressure, which in turn led to the appearance of the frication noise, as indicated by an increase in ZCR. The difference between [z] preceded by [m] and [z] preceded by [n] could be attributed to the alveolar constriction involved in [n], but not in [m], suggesting that in [mz], the alveolar constriction was achieved later and was less constricted.
2.5 Interim summary
The analysis of the acoustic data showed that the overwhelming majority of the apical vowel productions contained frication noise in at least the first half of their durations. This frication was observed following both sibilants and non-sibilants, suggesting that it could not be attributed to the coarticulation of preceding consonants, at least not in the context of non-sibilants /p pʰ m n/. Results from ZCR provided additional evidence that [z] displayed characteristics of a fricative sound, making it acoustically different from genuine vowels. Frication noise, however, never extended until the end of the apical [z]. When it diminished, periodic waveforms appeared, and a clear formant structure was visible. The analysis of this formant structure indicated that [z] had similar F1–F2 structure to [ʉ], shown by the significant overlap in the vocalic space.
3 Production experiment II: Articulatory study
The ultrasound experiment examined the tongue shape configuration of [z] in different contexts, both at the mid-sagittal and coronal planes. It specifically sought to determine to what extent the tongue shape of this segment differed from or resembled that of the fricative consonant [s].
3.1 Participants and materials
The ultrasound data were recorded in the same sound-attenuated room as for experiment I. Six of the ten speakers recorded for the acoustic experiment participated in the data acquisition (female speakers FS1, FS3, FS5 and male speakers MS2, MS3, MS5).Footnote 10 The word list was presented in Table 3. The subjects read the words in the same frame sentence [ki44ɕᴐ213_ ɕᴐ213sᴐ44fa44] ‘He/She writes _ three times’, repeated three times for the mid-sagittal plane and three times for the coronal plane (1218 tokens; [z]: 462, [i]: 168, [u]: 168, [a]: 126, [ʉ]: 294).
3.2 Data acquisition and analysis
The ultrasound data were recorded with the Ultrasound Stabilisation Headset (Articulate Instruments Ltd. 2008) and the Articulate Assistant Advanced software (AAA, V217.03) (Articulate Instruments Ltd. 2012). The probe used in data acquisition was a portable micro-convex ultrasonic probe with a diameter of 40 mm. The speakers sat in a comfortable chair; the headset was then adjusted to the anatomical specificities of each speaker, so that it did not move during the recording, nor did it cause discomfort. Data were recorded first in the mid-sagittal plane, and then in the coronal plane, with a small pause between two sessions during which the headset was removed.
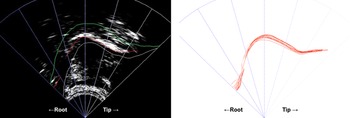
The left image shows the nearest midpoint mid-sagittal ultrasound image of one representative realisation of [z] in [pz31], produced by FS3. The green line represents the palate and the grey line represents the ‘min-tongue’ in the built-in tracing algorithm of AAA. The red line represents the traced tongue surface. The right image presents mid-sagittal tongue traces of the nearest midpoint images from 11 tokens of [z] in [pz31 pz213 pʰz35 pʰz213 mz213 nz33 nz213 tsz213 tsʰz213 sz213 sz35] produced by FS3, shown in the Spline Workspace of AAA. The tongue tip is on the right and the tongue root is on the left.

The left image shows the nearest midpoint coronal ultrasound image of one representative realisation of [z] in [pz31], produced by FS3. The green line represents the palate and the grey line represents the ‘min-tongue’ in the built-in tracing algorithm of AAA. The red line represents the traced tongue surface. The right image presents coronal ultrasound tongue traces of the nearest midpoint image from 11 tokens of [z] in [pz31 pz213 pʰz35 pʰz213 mz213 nz33 nz213 tsz213 tsʰz213 sz213 sz35] produced by FS3, shown in the Spline Workspace of AAA. Fan lines 9 and 29 are drawn to show the range of the data points considered as reliable.

The headset kept the ultrasound probe in the mid-sagittal plane and the probe was pointed to the anterior of the tongue in order to have the best image of the tongue tip. The coronal recording was obtained by turning the probe in a 90° angle and pointing the probe to the anterior part of the tongue. The probe was adjusted in a way that the medial grooving of the fricative [s] was easily observable as had been shown in Stone (Reference Stone1992). The overall angle was similar across speakers. However, the direction of the ultrasound probe was not controlled precisely as in Stone et al. (Reference Stone, Shawker, Talbot and Rich1988) or in Stone & Lele (Reference Stone and Lele1992), mainly due to the morphological differences across speakers.Footnote 11 The ultrasound probe had a field of view of 92°; the depth was adjusted to have a maximum view of the tongue, necessitating the use of different frame rates for female and male speakers (82.1 fps for female speakers and 81.5 fps for male speakers).
The ultrasound data recorded were segmented manually in AAA using the corresponding audio, and traced manually with the help of the built-in tracing algorithm (Articulate Instruments Ltd. 2012). Unless indicated otherwise, the tongue contours for [z] reported in this study were generated from all occurrences of this segment (i.e. from [pz31 pz213 pʰz35 pʰz213 mz213 nz33 nz213 tsz213 tsʰz213 sz213 sz35]). The contours, corresponding to the nearest midpoint image of the segment based on the acoustic signals, were exported as polar coordinates. These polar coordinates were then analysed using smoothing-spline analysis of variance (SS ANOVA) in R using the gss package (Gu Reference Gu2014). The results were analysed by speaker and presented in individual 92º fan diagrams.
For the SS ANOVA analysis of mid-sagittal tongue shapes, the entire visible tongue was included. One example is given in Figure 7. For the analysis of coronal tongue shapes, there was no anatomical reference to define a reliable range of the tracing, making the actual lateral edges of the tongue hard to determine. We considered the area within the junction of all traces of all segments to be reliable (e.g. for FS3, between the fan lines 9 and 29 in Figure 8, the angle between the two fan lines was approximatively 46°). This junction area could be easily identified as the tongue shapes of [i u ʉ a z] all passed through. We used traces within this area as this was the only reliable way to generalise comparisons between segments. These areas were defined individually based on data from each speaker.Footnote 12 The palatal traces were obtained by averaging six separate water-swallow trials, which were performed once at the beginning and once at the end of each session on both mid-sagittal and coronal planes.
3.3 Results
The generalisations based on the SS ANOVA in polar coordinates proved to be representative as the speakers had highly consistent tongue contours. We analysed the tongue shape for [z] and compared it to the tongue shapes for the fricative [s] and for the high vowels [i u ʉ]. The effect of context on the tongue configuration of [z] was shown by comparing labial and coronal contexts.
3.3.1 Comparing [z] to [s] and to [i u ʉ]
Figure 9 displays the mid-sagittal tongue contours for [z] compared to [s] and [i u ʉ]. For all six speakers, tongue configurations for [z] and [s] were similar to each other, while being different from those for the high vowels [i u ʉ].
SS ANOVA splines of mid-sagittal ultrasound tongue contours of the six speakers, extracted in polar coordinates at the nearest midpoint image of each segment (tongue front on the right and tongue root on the left). Each speaker is presented in an individual fan diagram, female speakers on the left and male speakers on the right (n = number of tokens per speaker). The tongue contours are presented with 95
 $\%$
Bayesian confidence intervals. The total range of data shown is 92º (from −46º to +46º), corresponding to the field of view of the ultrasound probe. The radius axis is in millimetres.

The difference in tongue shapes between [z] and the high vowels was more marked at the tongue dorsum, the basic gesture involved in the production of vowels. The tongue dorsum has a convex shape for [i u ʉ], and a relatively flat shape for [z] and [s]. The tongue front displayed variable configurations depending on speakers. Recall however that the tip of the tongue, generally considered neutral for vowels, was often invisible in ultrasound tongue images because of the mandible shadow, even with the ultrasound probe pointed towards the front of the tongue.
A slight difference in the tongue configurations for [s] and [z] could be observed for some speakers (e.g. FS1, MS2 and MS5), who displayed a lower tongue body for [z] than for [s]. As was shown in the acoustic experiment, most of the apical vowels had frication noise in the first half of their duration, and the frication noise decreased while the formant structure became clearer. The lowered tongue body for [z] observed here may be related to this reduction of frication noise: As the tongue body became lower, the narrowed air channel was widened, and frication noise diminished. The tongue dorsum lowering may also be explained by the laryngeal contrast between voiceless [s] and voiced [z]. In English and Portuguese, for example, tongue root advancement/tongue body lowering was found for the voiced plosives /b d ɡ/ compared to the voiceless counterparts /p t k/ (Westbury Reference Westbury1983, Ahn Reference Ahn2018). This adjustment served to maintain the voicing of /b d ɡ/ by enlarging the supraglottal cavity volume. In the case of the apical vowel [z], given that the same principle could be applied to voiced fricatives (Proctor, Shadle & Iskarous Reference Proctor, Shadle and Iskarous2010), this articulatory adjustment could contribute to the following scenario: The tongue body lowering could facilitate the voicing of [z], which in turn could be responsible for the decreasing frication noise.
SS ANOVA splines of coronal ultrasound tongue contours of the six speakers, extracted in polar coordinates at the nearest midpoint image of each segment. Each speaker is presented in an individual fan diagram, female speakers on the left and male speakers on the right (n = number of tokens per speaker). The tongue contours are presented with 95
 $\%$
Bayesian confidence intervals. The total range of data shown is 92º (from −46º to +46º), corresponding to the field of view of the ultrasound probe. The radius axis is in millimetres. The tongue shape of the vowel [i] from FS3 is not traced due to lack of consistent visibility in the data.

Figure 10 displays the coronal tongue contours for [z] compared to [s] and [i u ʉ]. Here too, the six speakers had virtually identical tongue shapes for [z] and [s], while both being different from those for the high vowels [i u ʉ]. Similar to [s], [z] displayed a medial-grooved tongue shape, with the medial part of the tongue being much lower than the lateral edges, signalling the presence of a narrowed air channel typical of fricatives. The two contours for [z s] could appear to be virtually identical as for FS3, or slightly different as for MS2 and MS5. For the latter two speakers, the medial-grooving was deeper in [z] than in [s]. This medial-groove deepening is most probably related to the tongue dorsum lowering exhibited by the same speakers and could be related to the disappearance of frication noise.
SS ANOVA splines of mid-sagittal ultrasound tongue contours of the six speakers, extracted in polar coordinates at the nearest midpoint image of apical vowel [z], grouped by labial or coronal onsets. Each speaker is presented in an individual fan diagram, female speakers on the left and male speakers on the right (n = number of tokens per speaker). The tongue contours are presented with 95
 $\%$
Bayesian confidence intervals. The total range of data shown is 92º (from −46º to +46º), corresponding to the field of view of the ultrasound probe. The radius axis is in millimetres.

SS ANOVA splines of coronal ultrasound tongue contours of the six speakers, extracted in polar coordinates at the nearest midpoint image of apical vowel [z], grouped by labial or coronal onsets. Each speaker is presented in an individual fan diagram, female speakers on the left and male speakers on the right (n = number of tokens per speaker). The tongue contours are presented with 95
 $\%$
Bayesian confidence intervals. The total range of data shown is 92º (from −46º to +46º), corresponding to the field of view of the ultrasound probe. The radius axis is in millimetres.

FS1 was a notable exception to this general pattern. Interestingly, this speaker did not produce a significant medially-grooved tongue shape for fricative [s] either (see also Figure 12 below).Footnote 13 Figure 10 also shows that [u] had a slightly medially-grooved tongue shape (namely for MS2). This slight grooving, also reported by Stone et al. (Reference Stone, Shawker, Talbot and Rich1988) and Stone & Lele (Reference Stone and Lele1992), was much shallower than for [z], and probably reflected the natural grooving of the tongue rather than an intended tongue gesture.
As reported in previous studies (e.g. Dixit & Hoffman Reference Prakash and Hoffman2004, Liker, Horga & Mildner Reference Liker, Horga and Mildner2012), the lingual–palatal contact for [z] and [s] was not always symmetrical (FS3 being an exception). In addition, the lateral edges for [z] seemed to be more raised than for [s] (for FS5 and MS5). This could be related to the articulatory difference between the two segments (Stone et al. Reference Stone1992, Dagenais Reference Dagenais, Lorendo and McCutcheon1994, Liker et al. Reference Liker, Horga and Mildner2012, Skarnitzl, Sturm & Machac Reference Skarnitzl, Sturm and Machac2013, Kochetov Reference Kochetov2014): [z] has more anterior lingual–palatal contact than [s], and the anterior medial groove is narrower in [z]. The lateral edges of the tongue were not symmetrical during the articulation of high vowels. For FS1, FS5 and MS3, one side of the lateral edges seemed to move less than the other side, which could be a case of lateral bracing that had been reported for other languages (Cheng, Schellenberg & Gick Reference Cheng, Schellenberg and Gick2017, Gick et al. Reference Gick, Allen, Roewer-Després and Stavness2017).
3.3.2 [z] preceded by labial and coronal consonants
We compared the smoothing splines of [z] in two contexts: after labials [p pʰ m] and after coronal sibilants [s ts tsʰ]. The aim was to determine whether the [s]-like tongue configuration for [z] was observed regardless of the nature of the preceding consonant. Results, presented in Figure 11 for the mid-sagittal plane, showed that the [s]-like tongue shape for [z] was implemented when [z] was preceded by both sibilants and non-sibilants. The same comparisons were conducted in the coronal plane. The results are shown in Figure 12. Here too, the medial-grooved [s]-like tongue shape for [z] was consistent regardless of the nature of the preceding consonant. The fact that [z] maintained the same tongue configuration, whether preceded by sibilants or not, is mirroring the results obtained in the acoustic study, strengthening the argument that this tongue shape is an inherent property of [z] in JHC.
3.4 Interim summary
The analysis of the ultrasound data showed that the tongue shape for [z] was virtually identical to that of the alveolar sibilant [s]. This similarity was observed in both mid-sagittal and coronal planes. The medially-grooved tongue shape of [z] was particularly important, as it was a fundamental indicator of a narrowed air channel which is typical for a fricative gesture. The fricative-like tongue shape of [z] was observed in both sibilant and non-sibilant contexts. This was another important finding since it showed that the tongue configuration of [z] was not a mere consequence of gestural overlap between homorganic sibilants and apical vowels. While the tongue configuration of [z] was similar to that of [s], it was very different from the configuration of high vowels. This difference was observed on the mid-sagittal plane, most notably regarding the arching of the dorsum typical of vowel articulation. It was even more evident on the coronal plane, with [z] displaying a medial-grooved configuration unlike genuine vowels.
It is important, however, to note that the tongue configurations of [z] and [s] displayed some differences. On the mid-sagittal plane, the tongue dorsum was positioned lower in [z] than in [s] for almost all speakers. And on the coronal plane, a deeper medial grooving for [z] was observed for some speakers. The medial-groove deepening and the tongue dorsum lowering indicated the enlargement of the narrowed air channel that could be responsible for the disappearance of the frication noise reported in the acoustic study.
4 General discussion and conclusion
This study investigated the acoustics and articulation of the apical vowel in Jixi-Hui Chinese (JHC). The results obtained showed that this segment had characteristics of an alveolar consonant. At the acoustic level, it exhibited frication noise for all the speakers recorded. This frication was systematically superposed on voicing. The presence of frication was independent of the nature of the preceding consonant, as it occurred when preceded by sibilants as well as by non-sibilants. The ultrasound data showed that the tongue configuration of [z] resembled that of the alveolar sibilant [s]. This similarity was observed in mid-sagittal planes with the two segments displaying similar (though not entirely identical) tongue configurations. Comparably, on the coronal plane, [z] displayed a medial-grooved tongue shape similar to the fricative [s]. The fricative-like tongue shape of [z] was also observed independently of the nature of the preceding segment.
While having acoustic and articulatory characteristics of a fricative consonant, the JHC [z] almost never displayed frication throughout its entire duration. Although present in 88
 $\%$
of the tokens, frication was implemented variably, from less than half to more than half of the segment. The gradual disappearance of noise gave way to a more and more visible formant structure. The dynamic behaviour of [z] during its time course made it often realised as a hybrid segment with the first part being fricative-like and the second part being more approximant-like. This ultimately raises the question of how to best define this segment: is it a fricative or an approximant? In the rest of this article, we briefly discuss the two alternatives.
An approximant is phonetically defined as a segment lacking turbulent noise (IPA 1999: 8; Martínez-Celdrán Reference Martínez-Celdrán2004; Ladefoged & Johnson Reference Ladefoged and Johnson2011: 15). Analysing the JHC apical vowel as an approximant requires an explanation for the presence of frication noise, akin to what has been proposed for Standard Chinese (SC) apical vowels. Given that in SC, apical vowels occur only after sibilants, the presence of frication noise can be readily explained by gestural overlap (Lee-Kim Reference Lee-Kim2014). The JHC case, however, is different: [z] appears after sibilants as well as after non-sibilants [p pʰ m n]. These non-sibilants have objectively no frication noise to propagate into the following segment. This being said, analysing JHC [z] as a fricative requires an account for its hybrid configuration. Our argument is that this is a consequence of two interacting constraints: a physical one related to the incompatibility of voicing and frication, and a structural one related to the role [z] plays within syllable structure.
The phonetic implementation of fricative [z] requires a compromise between voicing and frication. This is because of the incompatibility between two aerodynamic requirements: an increase in the intraoral pressure for frication and a certain transglottal pressure difference to maintain voicing. As Ohala (Reference Ohala and MacNeilage1983: 201–202) put it: ‘To the extent that the segment retains voicing, it may be less of a fricative, and if it is a good fricative it runs the risk of being devoiced’. Considering this aerodynamic voicing constraint, the JHC [z], and voiced fricatives in general, should imply a dichotomy between a voiceless fricative and a voiced approximant. In many languages, this incompatibility is achieved at the expense of voicing. This is the case in Tashlhiyt where geminate fricatives rarely maintain voicing throughout (Ridouane Reference Ridouane2007), or in English (Smith Reference Smith1997) and Hungarian (Bárkányi & Kiss Reference Bárkányi and Kiss2010) where /z/ and /v/ tend to devoice. In French, the variation of /ʁ/ leads to a continuum between unvoiced fricative and voiced approximant (Gendrot, Kühnert & Demolin Reference Gendrot, Kühnert and Demolin2015). In JHC, the compromise is never achieved at the expense of voicing. A possible reason for this could be related to the role [z] plays within the syllable structure. As a tone-bearing unit, [z] has to be voiced throughout to carry the tone. Being obligatorily voiced, it can hardly display strong frication noise throughout its full duration. This is all the more so given that [z], similar to other syllable nuclei, is particularly long (see Table 5 above). But why should frication be maintained? Why not produce a voiced approximant? A plausible answer, grounded on both structural and acoustic-auditory properties, is that the JHC [z] needs to differentiate itself from the close central vowel [ʉ]. Since the close central vowel [ʉ] has a formant structure which is similar to [z], the loss of frication noise may put the distinction between the two segments at risk.
While it favours a fricative account, our analysis of [z] in JHC does not totally rule out an approximant account. Indeed, one may object that it is more natural to have an approximant as a tone bearing unit, rather than a voiced fricative. Future studies will have to complement the present work in order to evaluate the proposed analyses and to increase our understanding of the nature of apical vowels in JHC in particular and in Chinese languages in general. One avenue for future studies concerns the perceptual cues to apical vowels and the role played by frication noise. Related to this is the assumption that frication noise may serve as an enhancing feature in some Chinese languages (Kong et al. Reference Kong, Wu and Li2019). A possible scenario could be that this frication was first introduced as an enhancing attribute to maximise the contrast between sibilants. Depending on the phonemic inventory this attribute took on a distinctive function in Chinese languages where [z] occurs not only following sibilants. This is clearly speculative although cases where enhancement gestures become primary (when the defining gestures are weakened or lost) have already been reported in literature. In many Bantu languages, the distinction between upper and lower vowels has disappeared and assibilation took the distinctive role (Mpiranya Reference Mpiranya1997, Clements & Ridouane Reference Clements and Ridouane2006). Assibilation, which was an enhancing gesture in the historical development of these vowels, preserves the distinction between words with earlier upper high vowels and those with earlier lower high vowels. A similar trajectory may have been followed in the historical sound change of apical vowels in Chinese languages.
Acknowledgements
The authors are grateful to the participants of this study. We would like to thank the Associate Editor Dr Alexei Kochetov and two anonymous reviewers for their valuable comments and careful proofreading, which greatly improved the quality of the manuscript. All errors remain our own. This work has partially benefited from a government grant managed by the Agence Nationale de la Recherche under the Investissements d’Avenir programme with the reference ANR-10-LABX-0083 (contributing to the IdEx University of Paris – ANR-18-IDEX-0001, LABEX-EFL).
Appendix
The structure of F1, F2 and F3 values (in Hz) of [i u a ʉ z] in JHC.

Statistical results of linear mixed-effects analyses conducted on formant values (Bark-scaled) of [z u ʉ] in JHC; standard deviations in parentheses.

FS = female speakers; MS = male speakers






 Open access

