INTRODUCTION
Tropical cyclones often have an immediate effect on forest structure and associated microclimate (Basnet et al. Reference BASNET, LIKENS, SCATENA and LUGO1992, Chazdon Reference CHAZDON2003, Mabry et al. Reference MABRY, HAMBURG, LIN, HORNG, KING and HSIA1998). For instance, understorey light levels may increase by 30% from canopy defoliation (Lin et al. Reference LIN, HAMBURG, HSIA, LIN, KING, WANG and LIN2003). Despite extensive short-term damage, recovery of forest structure and composition may be relatively rapid following tropical cyclones when only the forest canopy is affected (Chazdon Reference CHAZDON2003, Kang et al. Reference KANG, LIN, JAN and HWONG2005). However, forests that are repeatedly disturbed by cyclones, called typhoons in the western Pacific, show long-term changes in forest structure, such as a lower tree height and a decrease in tree diversity (Chang Reference CHANG2001, Chuang Reference CHUANG2005, Goode & Allen Reference GOODE and ALLEN2008, Kang et al. Reference KANG, LIN, JAN and HWONG2005, Lee et al. Reference LEE, LIN, VADEBONCOEUR and HWONG2008, Lin et al. Reference LIN, HAMBURG, LIN, WANG, CHANG, HSIA, VADEBONCOEUR, MCMULLEN and LIU2011, Lugo Reference LUGO2008). In particular when the cyclone triggers large-scale landslides in primary forest, such as during typhoon Morakot when in Taiwan a record-breaking 2777 mm rainfall fell in 72 h, the forest is unlikely to recover in the near future (Chu Reference CHU2014, Hilton et al. Reference HILTON, GALY, HOVIUS, CHEN, HORNG and CHEN2008, Tsai et al. Reference TSAI, HWANG, CHEN and LIN2010).
Whereas the devastating impact of a tropical cyclone on forest trees has been relatively well studied, far less is known about the effect of typhoons on other components of the forest (Lugo Reference LUGO2008). Canopy epiphytes may be severely impacted by cyclones, because they are subject to the full force of the winds and are especially vulnerable to changes in the microclimate associated with alteration of the forest structure (Benzing Reference BENZING1998). Immediate observations in Florida have shown that a single hurricane may have a devastating effect on the population density of epiphytic bromeliads, resulting in a reduction by 12–43% (Oberbauer et al. Reference OBERBAUER, VON KLEIST, WHELAN and KOPTUR1996). Representatives, but not all, of other epiphyte groups may be better attached and/or less sensitive to desiccation after impact, resulting in local changes in community assemblages. For example, orchids in Florida were less sensitive than bromeliads and in Honduras orchids were not as much affected as ferns (Batke & Kelly Reference BATKE and KELLY2015, Oberbauer et al. Reference OBERBAUER, VON KLEIST, WHELAN and KOPTUR1996).
Several studies suggest that the immediate impact of cyclones on epiphytes persists in the long term (Batke & Kelly Reference BATKE and KELLY2015, Mújica et al. Reference MÚJICA, RAVENTÓS, GONZÁLEZ and BONET2013). One reason for the slow recovery of the epiphyte vegetation may be that long-distance colonization by epiphytes of large depleted patches of forest is a slow process. In apparent agreement, epiphyte populations are shown to possess a clear spatial genetic structure in the landscape (Cascante-Marín et al. Reference CASCANTE‐MARÍN, OOSTERMEIJER, WOLF and FUCHS2014). Slow colonization is especially to be expected if source populations are small and at a large distance, as is often the case on isolated tropical islands. On tropical islands in the Caribbean, the low richness of epiphytes has indeed been attributed to geographic isolation and large-scale disturbances of tropical cyclones (Migenis & Ackerman Reference MIGENIS and ACKERMAN1993). Whereas the above-mentioned studies report shifts in epiphyte community structure near the vortex of the cyclone, it is less clear what happens in its periphery where associated increased precipitation may even benefit canopy epiphytes.
In this study, we addressed the hypothesis that in Taiwan typhoons have a long-term effect on epiphytic vegetation. Our specific hypotheses were as follows: (1) Repeated historical typhoons decrease local epiphyte species richness and (2) have an effect on the composition of epiphyte assemblages; (3) the effect near the vortex of the typhoon differs from that in its periphery.
Study area
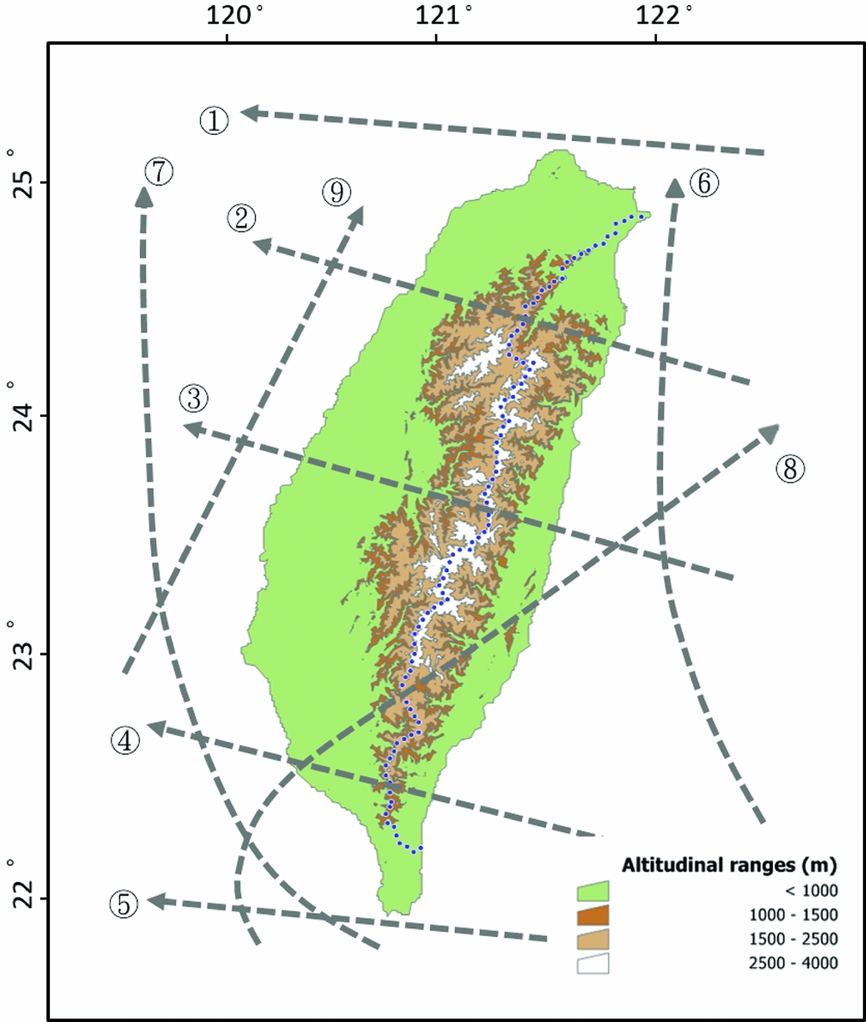
Taiwan is an island located in the western Pacific (21°–25°N, 119°–122°E; Figure 1) and tropical cyclones are an important aspect of the regional climate (Lin et al. Reference LIN, HAMBURG, LIN, WANG, CHANG, HSIA, VADEBONCOEUR, MCMULLEN and LIU2011). On average, 3.7 typhoons hit Taiwan every year, mostly from June to October. About 80% of all typhoons land on the island's east coast (Chu et al. Reference CHU, LIAU, LIN and SU2012, Wu & Kuo Reference WU and KUO1999; Figure 1). The central mountain range generally decreases the intensity of typhoons by more than 40% within 12 h after the eye of the cyclone reaches the island (Wu & Kuo Reference WU and KUO1999). Therefore, typhoon impact in the western leeward side of the central range is relatively mild.
Historical typhoon tracks in the island of Taiwan (21°–25°N, 119°–122°E). The Central Weather Bureau categorizes typhoons with warning records (for the period 1897 to 2014 there were 452 records) into nine trajectories (indicated as dashed lines) as follows: trajectory (1) 13%, (2) 12%, (3) 11%, (4) 10%, (5) 19%, (6) 15%, (7) 7%, (8) 4%, (9) 7%; about 2% were typhoons with singular trajectories. The blue dotted line indicates the highest point in the central mountain range of Taiwan and only the area east of this line was analysed in this study.

Despite its relatively small area (36000 km2), Taiwan is exceptionally rich in vascular plants (c. 4000 species) compared with other (sub-)tropical islands such as Hawaii (c. 2700 species), the Canary Islands (c. 1600 species) and New Caledonia (c. 1500 species) (Creese et al. Reference CREESE, LEE and SACK2011, Dawson Reference DAWSON1963, Reyes-Betancort et al. Reference REYES-BETANCORT, SANTOS GUERRA, GUMA, HUMPHRIES and CARINE2008). The presence of an extensive mountain system accounts for a high diversity of vegetation types on the island, ranging from alpine tundra to tropical rain forest, which partly explains the high species richness. In sharp contrast, but not unlike the Caribbean islands, Taiwan must be considered relatively poor in epiphytes. There have been c. 350 species of vascular epiphytes reported for Taiwan, comprising only 8% of the total vascular flora (Hsu & Wolf Reference HSU and WOLF2009). Worldwide, vascular epiphytes contribute approximately 9% to vascular plant diversity (Zotz Reference ZOTZ2013) and especially in wet tropical ecosystems epiphytes often contribute significantly more (Gentry & Dodson Reference GENTRY and DODSON1987), sometimes up to 52% (Kelly et al. Reference KELLY, O'DONAVAN, FEEHAN, MURPHY, DRANGEID and MARCANO-BERTI2004).
METHODS
We aimed to explore the long-term effect of past typhoons on the vascular epiphyte diversity of Taiwan. Epiphyte distribution is estimated from species distribution models. In our analyses, we separate the effect of lower wind speeds (Beaufort scale 7) enveloping the eye of typhoon from the effect of stronger winds (> Beaufort 10).
Epiphyte distribution
We first compiled occurrences of epiphytic species from herbarium records, published plant inventories and our own botanical observations into a comprehensive georeferenced epiphyte database. Epiphyte records included both true and hemiepiphytes (definitions following Kress, Reference KRESS1986). The final database contained 39084 records comprised of 331 species (24 families, 105 genera). Ferns and lycophytes contributed most species (171), followed by orchids (120). The epiphyte species in the database were divided into four subcategories, based on life form and taxonomy: hemiepiphytes (abbreviation hemis, e.g. Moraceae, Araceae), ferns and lycophytes (ferns), orchids (orchids) and dicotyledons (dicots). For more detailed information on the species in the database, see Hsu & Wolf (Reference HSU and WOLF2009).
Next, we allocated each of the 39084 plotless epiphyte occurrences in the database to grid cells with a spatial resolution of 1 km2, 35928 cells in total for the entire island. Multiple occurrences of a species in a grid cell were considered a single record, which reduced the total number of records to 29087. Whereas over the entire island the average number of documented species in the cells was thus less than one, in 252 cells at least 20 species were recorded with a maximum of 106 species.
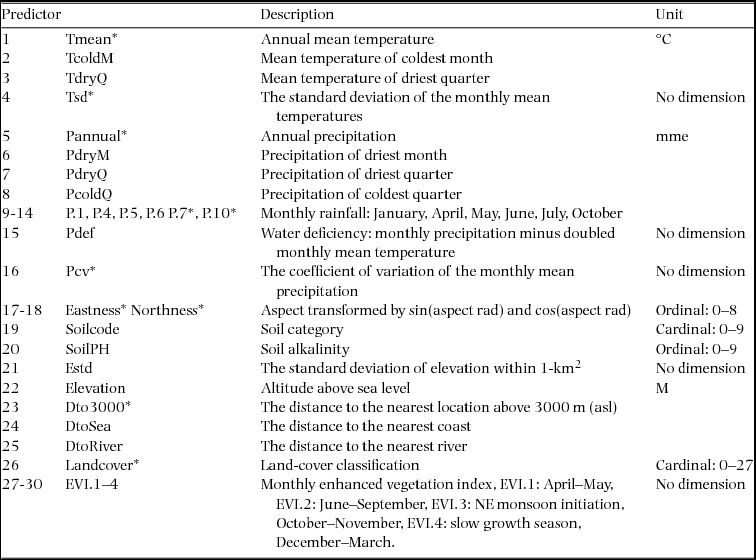
It is well known that botanical collections are biased for certain accessible localities as well as taxonomic groups and the absence of species in cells is likely due to insufficient sampling. To mitigate a sampling effect, we used MaXent (version 3.3.3k) species distribution models (SDMs) to fill in the distribution gaps (Phillips et al. Reference PHILLIPS, ANDERSON and SCHAPIRE2006). MaXent puts no weight on the absence of a species in a grid cell and is therefore particularly suited. For predictor variables, we used 30 environmental variables, including nine topographic variables, 16 climatic (12 precipitation-related and four temperature-related) variables and five land-cover/vegetation indices (Appendix 1). The resolution of the variables was identical to that of the typhoon disturbance measure (1-km2 grid).
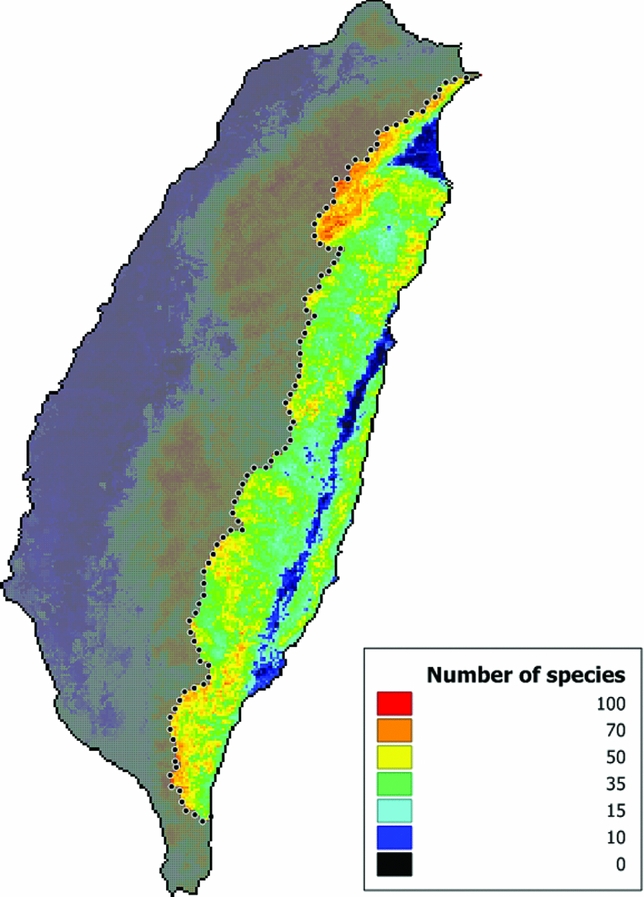
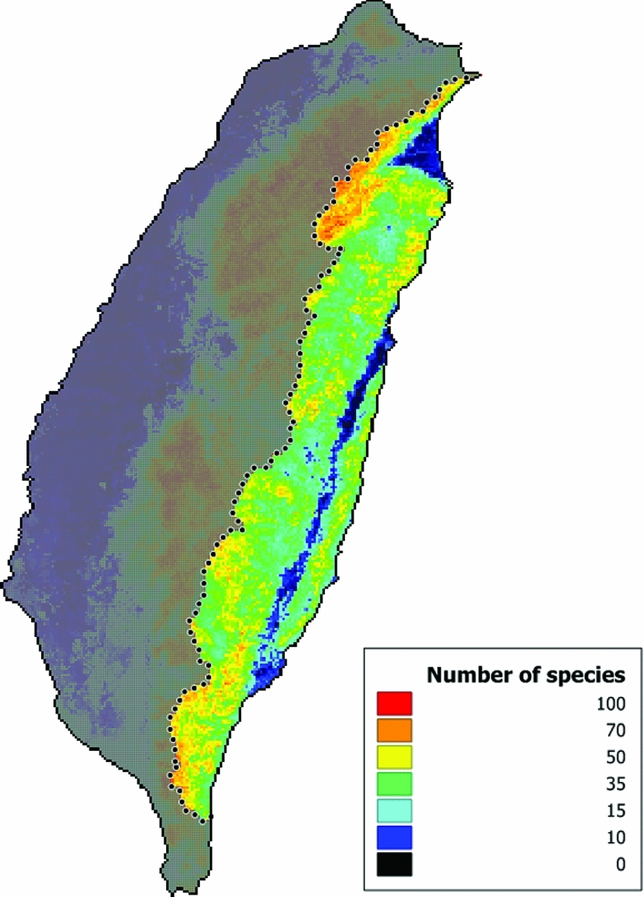
From the initial 331 species in the epiphyte database we excluded rare species (79) and species that could not be validated in the SDMs (93), leaving 156 species (78 ferns, 25 orchids, 15 dicots and 38 hemis) for which we predicted the potential presence in each of the 1-km2 grid cells. Due to the complex effect of the central mountain range on cyclone circulation, we only considered cells east of the central range, 10725 cells in total. After modelling, the average number of projected species records (391659 in total) in each cell was 36.5, ranging from 2 to 81 species per cell (Figure 2). For more detailed information on the epiphyte SDMs, see Hsu et al. (Reference HSU, WOLF and TAMIS2014).
Modelled epiphyte species richness in 1-km2 grid cells in Taiwan. The dotted line indicates the highest point in the central mountain range of Taiwan and in this study only the area east of this line was analysed for the effect of typhoons.
Typhoon disturbance
We analysed the pathways and strengths over time of all typhoons recorded by the Taiwanese Central Weather Bureau (CWB) that approached the east coast of Taiwan from 1958 to 2006, 167 in total. The CWB officially releases a typhoon warning when tropical cyclones reach sustained winds of at least 62 km h−1; note that this wind speed is considerably less than a Category 1 hurricane (119–153 km h−1) on the Saffir–Simpson Hurricane Wind Scale (Schott et al. Reference SCHOTT, LANDSEA, HAFELE, LORENS, TAYLOR, THURM, WARD, WILLIS and ZALESKI2012). In Taiwan, typhoons are categorized as mild (62–117 km h−1), moderate (118–183 km h−1) or severe (>183 km h−1). First, the track of each typhoon was traced as circles around the eye with radii of Beaufort scale 7 and 10, corresponding to sustained winds of at least 50 km h−1 and 89 km h−1, respectively (Lin et al. Reference LIN, TSAI, LAI and LIN2006). Next, the accumulated number of hits in each cell of the species distribution 1-km2 grid was calculated for each wind-speed cohort, yielding two separate cyclone disturbance variables (B7 and B10) as a proxy for cyclone disturbance. While there was overlap between the two levels of disturbance (when a cell is hit by a B10 cyclone it also counts as a B7 hit), B7 envelopes were generally more extensive, and the eye of a recorded typhoon did not always land on the island.
Analyses
The effect of tropical cyclone disturbance, namely the frequency of B7 and B10, on general and subcategory epiphyte species richness in the grid cells was tested with Pearson correlation analysis. We used a direct gradient ordination analysis, canonical correspondence analysis (CCA), to assess the influence of cyclone disturbance on epiphyte distribution (ter Braak Reference TER BRAAK1986). For species data, we used the projected occurrences of 156 epiphyte species in the 1-km2 grid cells. The environmental variables (30) were the same predictors as used in the SDMs. These variables were first subjected to a principal component analysis (PCA) to avoid multicollinearity. The first two PCA components, correlated with temperature and rainfall, together explained 52% of the variation in the data. Both PCA components were retained in the CCA, as opposed to a third component that had little additional explanatory value (9%). For more information on the PCA, see Hsu et al. (Reference HSU, WOLF and TAMIS2014). Next, we performed a partial CCA on the species distribution with the two cyclone disturbance measures, B7 and B10 frequencies, as environmental predictor variables and the two PCA components as covariables. The significance of the first extracted CCA axis that is constrained to be correlated with typhoon frequency was tested using a Monte Carlo test (999 permutations). The above analyses were performed in R, version 3.4.4, with vegan, a community ecology package available for free at https://cran.r-project.org/web/packages/vegan.
RESULTS
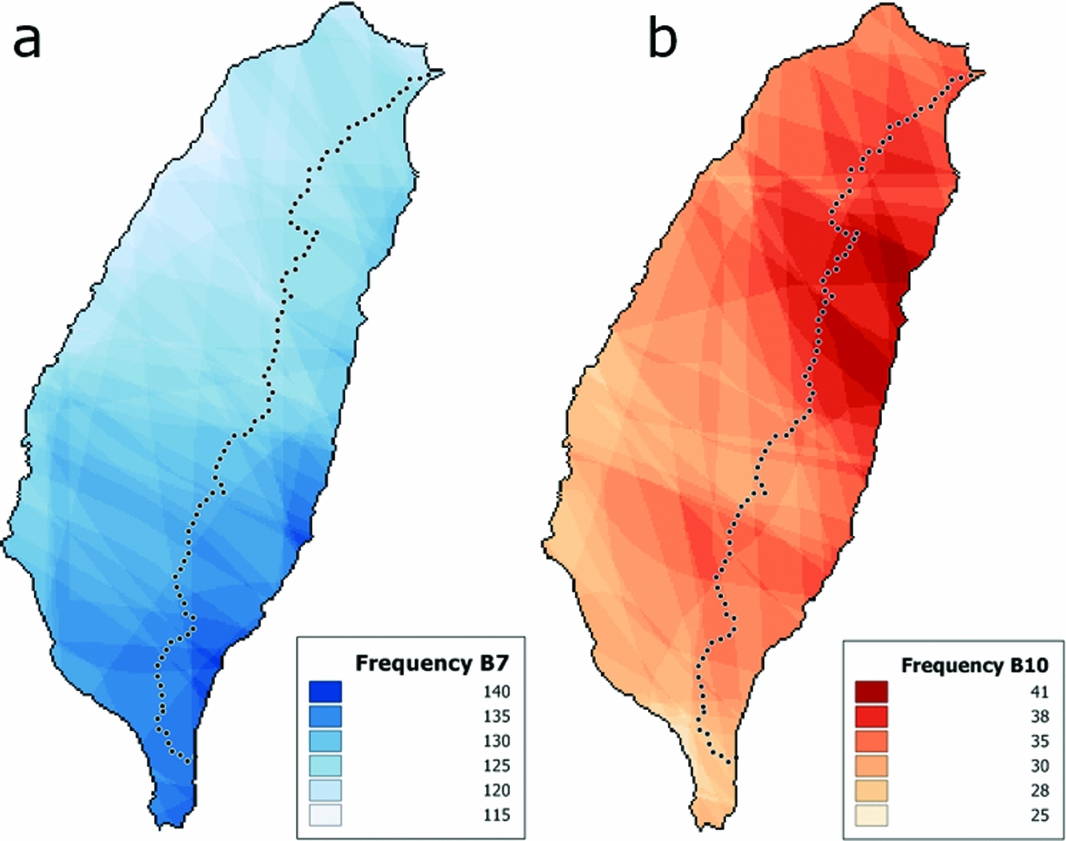
From 1958–2006, a total of 179 typhoon warnings were issued by the Central Weather Bureau, and we analysed 167 typhoons that approached Taiwan towards the east coast. The 1-km2 grid cell typhoon disturbance map shows areas with dissimilar frequencies of B7 and B10 cyclones (Figure 3). Most severe typhoons in Taiwan apparently land on the east coast at about one-third of its northern point.
Typhoon frequencies in Taiwan from 1958–2006 in 1-km2 grid cells, 167 typhoons in total (data from Taiwanese Central Weather Bureau). Tracks and eyes of typhoons were plotted as circles with radii of wind speed Beaufort scale 7 (B7) and 10 (B10) and the accumulated number of hits in each cell was calculated for both wind-speed cohorts, yielding two cyclone frequency maps (a: B7 and b: B10) as a proxy for cyclone disturbance. The dotted line on each map indicates the highest point in the central mountain range of Taiwan and only the area east of this line was analysed in this study.

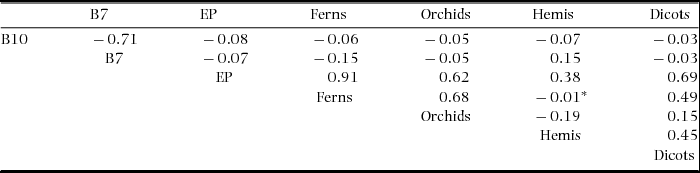
The correlation analysis between the B7 and B10 frequencies in the 1-km2 grid cells (10725 cells) and the projected epiphyte richness therein (Table 1) shows that typhoon disturbances generally have a significant negative impact on total epiphyte richness and its various components, with the exception of lesser B7 cyclones, which are positively correlated with hemiepiphyte richness (Figure 4).
A matrix of Pearson's r correlation coefficients between typhoon frequencies and modelled epiphyte species richness in 1-km2 grid cells in Taiwan (n= 10725). Typhoons were divided into two categories: wind speed Beaufort scale 7 (B7) and 10 (B10). Epiphyte species richness (EP, 156 spp.) was divided into several categories: ferns and lycophytes (ferns, 78 spp.), dicotyledons (dicots, 15 spp.), orchids (orchids, 25 spp.) and hemiepiphytes (hemis, 38 spp.). Correlation coefficients are all significant (P < 0.001), except the correlation between hemis and ferns (indicated by an asterisk).

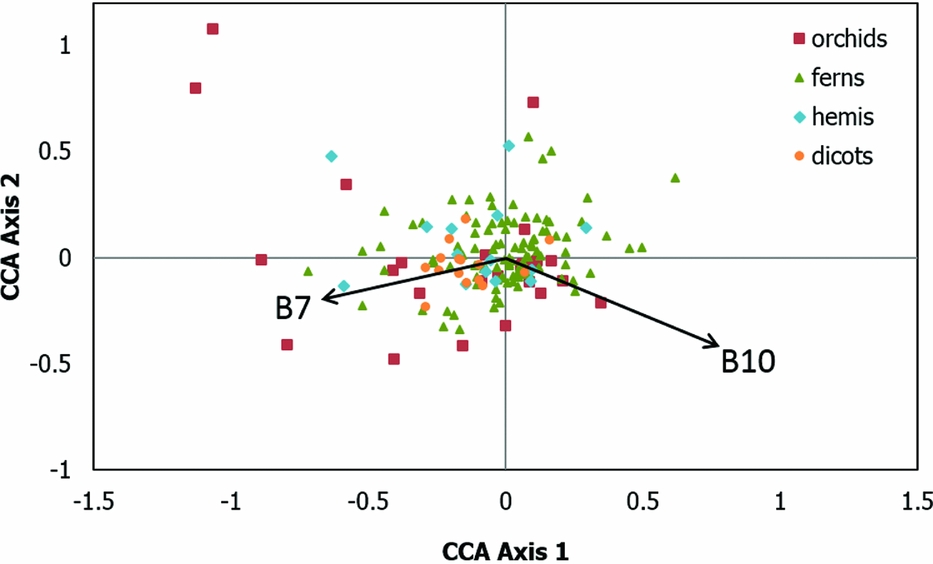
Ordination diagram of a partial canonical correspondence analysis of epiphyte species in 10725 1-km2 grid cells in east Taiwan with the frequencies of two cyclone strengths, Beaufort scale 7 and 10 (arrows), as explanatory variables. Covariables are related to temperature and water availability. Epiphyte species are arranged by subcategory: orchids (red squares), ferns (green triangles), hemiepiphytes (blue diamonds) and dicotyledons (orange circles). The first axis is significant (Monte Carlo, P < 0.01), explaining 1.6% of the variance.

The partial CCA shows that typhoons also exert an influence on the distribution of epiphytes. After subtracting the variation in the species data that was related to temperature and rainfall (PCA component-1 and -2), both axes related to typhoon frequency explained together 1.6% of the variance (Figure 4). Even though this is a relatively small amount of explained variation, the Monte Carlo permutation test showed that the first typhoon-related axis is nevertheless significantly (P < 0.01) different from randomly generated axes.
DISCUSSION
Studies on the effect of typhoons in the North-West Pacific are scarce, in particular on arboreal communities such as epiphyte vegetation. As has been observed in the Atlantic area (Oberbauer et al. Reference OBERBAUER, VON KLEIST, WHELAN and KOPTUR1996), anecdotal evidence indicates that epiphyte dislodgement by a typhoon may be extensive (R. Hsu pers. obs.). In Taiwan, fallen bird's-nest ferns and tree branches with epiphytes on the forest floor are very common after a typhoon event, as well as tree falls with heavy loads of epiphytes. The moderate typhoon Soudelor in 2015 caused more than 300 tree falls in the Taipei Botanical Garden (R. Hsu pers. obs.). Our previous study (Hsu et al. Reference HSU, WOLF and TAMIS2014) suggested the regional patterns of epiphyte distribution could be related to prevailing winds (north-east monsoons and south-west air flows) that create an additional source of seeds and rainfall. The present study suggests that, over the long-term, typhoons also have an effect on overall epiphyte richness (negative) and the distribution of epiphyte assemblages in the landscape.
Our analysis included 167 recorded typhoons that landed on the east coast of Taiwan between 1958 and 2006. Mild B7 cyclones generally prevailed in the south of the island, while heavy B10 cyclones were more predominant in the north. The differing frequency distribution pattern between the two types of cyclones made a separate analysis of both types of event feasible. Analysing the typhoon frequency over a c. 50-y period in 1-km2 grid cells, we found that B7 and B10 cyclones both had a significantly negative effect on the number of species recorded within those cells. Nonetheless, we observed that B7 cyclones exerted a positive influence on hemiepiphyte richness; this may well be a non-causal relationship, since hemiepiphytes are mostly found in the tropical lowlands at the southern peninsula of Taiwan (Hsu et al. Reference HSU, WOLF and TAMIS2014), which coincides with the higher frequency of B7 cyclones in the south. Batke & Kelly (Reference BATKE and KELLY2015) suggested that hurricane disturbance on mechanically dependent plants is greatly influenced by their attached position and life form. Hence, we cannot rule out that particular hemiepiphytes, such as strangler figs and aroids, which seem relatively resistant to direct winds, may derive a benefit from the accompanying cyclone precipitation during these relatively warm months. Consequently, rain and wind should be regarded as independent factors, as previously advocated in hurricane research (Lugo Reference LUGO2008).
Ordination analyses also indicated that typhoons have a significant influence on the distribution of epiphytes. However, since typhoons are often associated with periods of great rainfall and rainfall was also one of the predictors in the SDMs, there are clearly some caveats. Indeed, correlation analyses showed that both B7 and B10 wind scales were significantly correlated with the rainfall-related PCA component-2 (Pearson's r = −0.44 and 0.32, respectively; P < 0.001). To minimize circularity, we performed a partial CCA, in which we entered rainfall (PCA component-2) and temperature (PCA component-1) as covariables. This partial ordination analysis showed that typhoons have a significant influence on epiphyte communities, independently of temperature and rainfall-related variables. Nevertheless, the amount of explained variation by the first extracted axis was low (1.6%). However, it should be noted that the actual amount of variation explained by the first axis, correlated with typhoons, is much higher since the variation correlated with temperature and water availability, PCA-1 and PCA-2, was removed from the data (as covariables) and these PCA components that together explained 52% of the variation in the data were highly correlated with typhoons.
In conclusion, our analyses suggest that historical typhoons have a long-term effect on the distribution of epiphytes in Taiwan and locally shape both species richness and community composition. As a follow-up to this indirect study, we recommend in situ monitoring of epiphyte vegetation, particularly in the north-east of the island, where B10 typhoons are most frequent.
Acknowledgements
We thank Hsu-Hsin Shen for keying in typhoon data. We are grateful to Dr Yue-Joe Hsia, Teng-Chiu Lin and Hone-Jay Chu for their advice on interpreting historical typhoons in Taiwan and we thank Dr Ming-Yu Fan and Ya-fen Chan for guidance on the statistical analyses. We thank an anonymous reviewer for the valuable comments.
Environmental predictors that were used for modelling the distribution of epiphyte species in 1-km2 grid cells in Taiwan. Predictors included four temperature-related (1–4), 12 precipitation-related (5–16), nine topographic variables (17–25), and five land-cover/vegetation indices (16–30). * Indicates predictors that were only used in the model building of rare species (i.e. with < 80 occurrences). For more details, see Hsu et al. (Reference HSU, WOLF and TAMIS2014).