1 Introduction
Periodic variation of a system parameter drives oscillatory motion, which is known as parametric excitation. Pumping a playground swing by standing and squatting on it is a typical example. Parametric excitation is commonly observed in various systems and, in the specific case of the ocean, it plays a vital role in the dissipation of internal waves and resulting vertical water mixing (Hibiya & Nagasawa Reference Hibiya and Nagasawa2004; Hibiya, Nagasawa & Niwa Reference Hibiya, Nagasawa and Niwa2006). In the context of physical oceanography, enhancement of fine disturbances in a higher-frequency and larger-scale ambient wave field is in particular named parametric subharmonic instability (PSI). Despite many years of ocean research, the actual efficiency of PSI remains uncertain, even today (MacKinnon et al. Reference MacKinnon, Zhao, Whalen, Waterhouse, Trossman, Sun, Laurent, Simmons, Polzin, Pinkel, Pickering, Norton, Nash, Musgrave, Merchant, Melet, Mater, Legg, Large, Kunze, Klymak, Jochum, Jayne, Hallberg, Griffies, Diggs, Danabasoglu, Chassignet, Buijsman, Bryan, Briegleb, Barna, Arbic, Ansong and Alford2017).
Because the spatial structure of an internal wave varies depending on the situation in which it is generated and propagates, PSI has been separately investigated for each case: e.g. spatially monochromatic wave trains (Sonmor & Klaassen Reference Sonmor and Klaassen1997), low-vertical-mode wave trains (MacKinnon & Winters Reference MacKinnon and Winters2005; Young, Tsang & Balmforth Reference Young, Tsang and Balmforth2008; Hazewinkel & Winters Reference Hazewinkel and Winters2011), vertically propagating beam waves (Bourget et al. Reference Bourget, Scolan, Dauxois, Bars, Odier and Joubaud2014; Karimi & Akylas Reference Karimi and Akylas2014, Reference Karimi and Akylas2017) and waves near boundaries (Gerkema, Staquet & Bouruet-Aubertot Reference Gerkema, Staquet and Bouruet-Aubertot2006; Chalamalla & Sarkar Reference Chalamalla and Sarkar2016). Several studies specifically considered irrotational cases, whereas the recent geophysical interest is mainly directed to the effect of variation of the Coriolis parameter that makes up the latitudinal dependence of the PSI efficiency (Hibiya, Nagasawa & Niwa Reference Hibiya, Nagasawa and Niwa2002; Furuichi, Hibiya & Niwa Reference Furuichi, Hibiya and Niwa2005). The common factor in all of these studies is the discussion of the stability of a temporally monochromatic wave. However, the monochromatic assumption is not necessarily appropriate when applied to real ocean systems.
In general, the most significant forces inducing periodic motion of seawater are those exerted by tides. Variation in the gravity potential produces primarily a very large-scale barotropic flow, which collides with seamounts or continental shelves to generate secondary baroclinic motion, called internal tides. If we assume the linearity in the response (i.e. ignoring advection), the generated internal tides can be considered monochromatic in time with the same frequency as the original tidal force. However, large-scale internal tides subsequently propagate as wave trains through a temporally fluctuating geostrophic flow field, experiencing time-dependent refraction and then producing ‘incoherent’ components (Zaron & Egbert Reference Zaron and Egbert2014). From an in situ observation, Alford & Zhao (Reference Alford and Zhao2007) indeed reported phase modulation of the internal tides far from their generation sites. As will be made clear in this paper, stochastic phase modulation acts to disturb the frequency of a harmonic oscillation, broadening its energy spectrum in the frequency space. All the studies mentioned above have only investigated the complete line spectrum cases, leading to the effects of wave frequency fluctuations on PSI being insufficiently considered.
In the stochastic problem, the ordinary deterministic approach for parametric excitation, which is based on the famous Floquet theory, does not work. An alternative approach is to employ statistical methods, which is rather effective when stochastic noise exists. A standard model used to describe the statistical evolution of a continuous spectrum is the kinetic equation. This equation is primarily utilised for the study of weak turbulence, i.e. a turbulent system where weakly nonlinear interactions among dispersive waves cause energy transfer over a broadly distributed spectrum (Zakharov, L’vov & Falkovich Reference Zakharov, L’vov and Falkovich1992). Resonant interactions in the oceanic wave field had been rigorously investigated using the kinetic equation until the 1980s (Müller et al. Reference Müller, Holloway, Henyey and Pomphrey1986). Also in this field, PSI is defined as a major class of resonant triad interactions that acts to transfer energy towards large-wavenumber low-frequency regions (McComas Reference McComas1977).
Here, we recognise that PSI has two definitions, one being the instability of a monochromatic wave and the second as a class of resonant interactions in a continuous spectrum. A simple explanation for the difference between these concepts can be given based on their interaction time scales. In the former case, disturbance waves are exponentially amplified, with their maximum growth rate proportional to the amplitude of the parent wave (Hasselmann Reference Hasselmann1967). In the latter case, the growth rate of the disturbance energy is proportional to the energy density of the parent components (McComas & Müller Reference McComas and Müller1981). Letting
 $\unicode[STIX]{x1D716}$
be the typical size of the wave amplitude, the time scale of PSI in a monochromatic wave is represented as
 $t\sim O(\unicode[STIX]{x1D716}^{-1})$
, whereas in the broadband spectrum case, it is given as
 $t\sim O(\unicode[STIX]{x1D716}^{-2})$
. In the theory of weak turbulence, these two time scales are respectively called the ‘dynamic’ and ‘kinetic’ time scales (Kartashova Reference Kartashova2013). We note that the specific definitions depend on the system being considered. For surface water waves, the dynamic and kinetic time scales are respectively defined as
 $t\sim O(\unicode[STIX]{x1D716}^{-2})$
and
 $t\sim O(\unicode[STIX]{x1D716}^{-4})$
. The difference from the case of internal waves comes from the fact that surface waves never cause resonant triad interactions and, alternatively, four-wave interactions play the dominant role. In any case, assuming that
 $\unicode[STIX]{x1D716}$
is sufficiently small, the kinetic time scale will be much larger than the dynamic time scale. Accordingly, the kinetic equation can be interpreted as a model that describes the long-term evolution of the system.
Bearing in mind the ideas mentioned above, one may expect that the growth rate of PSI in an internal tide derived using the kinetic equation becomes much smaller than the deterministic counterpart. In reality, however, if the kinetic equation is applied to a narrow-band wave spectrum, the growth rate of the instability becomes unnaturally large and even diverges in the limit of a monochromatic wave train. This problem was identified in Polzin & Lvov (Reference Polzin and Lvov2011), but a satisfactory explanation for this unphysical result has yet to be given.
There has been another line of research that addresses the ‘decay rates’ of internal tides caused by resonant interactions, which are also derivable from the kinetic equation (Olbers & Pomphrey Reference Olbers and Pomphrey1981; Olbers Reference Olbers1983; Eden & Olbers Reference Eden and Olbers2014; Onuki & Hibiya Reference Onuki and Hibiya2018). Contrary to the disturbance growth rate, the decay rate of an internal tide depends on the energy of the recipient waves, and not on the spectrum shape of the internal tide itself. Therefore, the decay rate takes a finite value, even for a monochromatic wave, so long as the overall spectrum is sufficiently smooth. Young et al. (Reference Young, Tsang and Balmforth2008) compared the decay time of internal tides estimated by Olbers & Pomphrey (Reference Olbers and Pomphrey1981) of
 $O(100)$
days with the growth time of disturbances in a monochromatic internal tide, which is
 $O(10)$
days, and concluded that the classical statistical approach overlooked the significance of PSI. This consideration may be somewhat misleading, as the kinetic equation does not underestimate but extremely overestimates the growth of disturbance energy if applied to monochromatic waves.
Since the conventional kinetic equation cannot be applied to PSI in a narrow-band wave spectrum, we must reconsider the statistical theory of resonant wave–wave interaction and formulate a new model that meets the present requirements. Although our attention focuses mainly on internal wave dynamics, the theoretical considerations have much in common with other research subjects, especially with surface water waves.
The stability of a wave train on a water surface has been a major topic since Benjamin & Feir (Reference Benjamin and Feir1967). It is currently known that a sinusoidal wave with slight phase modulation is dynamically unstable. This type of phenomenon is called a Benjamin–Feir instability and the concept has also been extended to a random wave field. Alber (Reference Alber1978) formulated a stability condition for a narrow-band random wave train from a two-dimensional nonlinear Schrödinger equation, in which a cubic term causes four-wave interactions. He derived and analysed an evolution equation of a two-point correlation function by assuming a Gaussian random wave field. As for PSI caused by three-wave interactions, a different approach is required to construct a statistical equation suitable for analysis. Moreover, the statistical features of PSI are different from those of Benjamin–Feir-type instabilities, containing new and important findings related to nonlinear wave dynamics in general, as we shall see in this study.
A summary of this paper is as follows. In § 2, we start the story with a classical stochastic oscillator equation. This simple linear model offers basic insights into the difference between the dynamic and kinetic properties of general resonant phenomena. In addition to the conventional two types of time scales, we introduce the ‘time ranges’ to clarify the transition from the dynamic- to kinetic-type responses in the oscillator, which enables us to readily understand why the kinetic equation is bankrupt for monochromatic wave cases. In § 3, we switch the discussion to a linear parametric excitation model, dividing the section into two parts: we first investigate the difference of the two types of energy growth in the stochastic parametric excitation in a heuristic manner based on the consideration in the previous section; and, after that, we introduce a more systematic approach by employing statistical assumptions. The former approach is rather intuitive, whereas the latter, which leads to an identical result, is more relevant to the weak turbulence theory. In § 4, we extend the discussion to the finite-dimensional case. Following the derivation procedure of the classical kinetic equation, we explain why it does not accurately represent the energy growth of PSI and how it can be fixed. Using a generalised version of the kinetic equation, we conduct analytical and numerical stability analyses for a modulating wave train, to find a simple expression for the growth rate of PSI. In § 5, we compare the analytically obtained growth rate with the results from numerical experiments with a one-dimensional model that mimics the parametric growth of small-scale waves in a progressive internal tide. We confirm the favourable agreement between the analytical and experimental results and discuss how the present study can be translated in terms of real oceanographic research. Concluding remarks are given in § 6.
2 Statistical description of resonant oscillation
The statistical theory of resonant interactions has a long history. Above all, Hasselmann (Reference Hasselmann1962) presented a monumental work in which the kinetic equation for surface water waves was derived for the first time. A key ingredient in his approach is the consideration of the asymptotic behaviour of an undamped harmonic oscillator in response to stochastic forcing. This type of problem frequently arises from fluid equations expanded in Fourier space and thus has a wide range of application including that to oceanic internal waves (Hasselmann Reference Hasselmann1966). In his original formulation, however, the difference between the common deterministic theory and the statistical approach is somewhat obscure. To elucidate the essence of the kinetic equation, we revisit this basic problem from a different viewpoint.
Let us consider an ordinary differential equation
 $$\begin{eqnarray}\frac{\text{d}^{2}x}{\text{d}t^{2}}+x=\unicode[STIX]{x1D716}f,\end{eqnarray}$$
the identical model to equation (3.6) of Hasselmann (Reference Hasselmann1962), together with initial conditions
 $x(0)={\dot{x}}(0)=0$
. The function
 $f(t)$
represents an external driving force to the harmonic system, with the parameter
 $\unicode[STIX]{x1D716}$
specifying its typical size. In general, equation (2.1) can be analytically solved as
 $$\begin{eqnarray}\displaystyle & \displaystyle x=\unicode[STIX]{x1D716}\int _{0}^{t}\sin (t-t_{1})f(t_{1})\,\text{d}t_{1}, & \displaystyle\end{eqnarray}$$
 $$\begin{eqnarray}\displaystyle & \displaystyle {\dot{x}}=\unicode[STIX]{x1D716}\int _{0}^{t}\cos (t-t_{1})f(t_{1})\,\text{d}t_{1}. & \displaystyle\end{eqnarray}$$
 $E(t)=(x^{2}+{\dot{x}}^{2})/2$
, can be written as
 $$\begin{eqnarray}E=\frac{\unicode[STIX]{x1D716}^{2}}{2}\int _{0}^{t}\int _{0}^{t}\cos (t_{1}-t_{2})f(t_{1})f(t_{2})\,\text{d}t_{1}\,\text{d}t_{2}.\end{eqnarray}$$
Notice that the scale of
 $E$
is limited to
 $O(\unicode[STIX]{x1D716}^{2})$
so long as the time integration in (2.3) does not grow secularly. We now assume
 $f$
to be a stochastic stationary process, with an associated autocorrelation function
 $$\begin{eqnarray}\langle \,f(t+\unicode[STIX]{x1D70F})f(t)\rangle =F(\unicode[STIX]{x1D70F}),\end{eqnarray}$$
which we know in advance. It is specified here that the notation
 $\langle \cdot \rangle$
represents the expectation value or the ensemble average of the function within the brackets, and not a temporal average. The Wiener–Khinchin theorem relates the autocorrelation function to the power spectrum
 $S(\unicode[STIX]{x1D714})$
as
 $$\begin{eqnarray}F(\unicode[STIX]{x1D70F})=\frac{1}{2\unicode[STIX]{x03C0}}\int _{-\infty }^{\infty }S(\unicode[STIX]{x1D714})\cos (\unicode[STIX]{x1D714}\unicode[STIX]{x1D70F})\,\text{d}\unicode[STIX]{x1D714}.\end{eqnarray}$$
Taking the average of (2.3), using (2.5), and integrating it with respect to both
 $t_{1}$
and
 $t_{2}$
, we may write the expectation of energy in the form
 $$\begin{eqnarray}\displaystyle \langle E\rangle =\frac{\unicode[STIX]{x1D716}^{2}}{2\unicode[STIX]{x03C0}}\int _{-\infty }^{\infty }S(\unicode[STIX]{x1D714})K(\unicode[STIX]{x1D714},t)\,\text{d}\unicode[STIX]{x1D714}, & & \displaystyle\end{eqnarray}$$
where
 $K(\unicode[STIX]{x1D714},t)$
acts as the time-dependent kernel associating the forcing spectrum
 $S(\unicode[STIX]{x1D714})$
with the energy of the system,
 $\langle E(t)\rangle$
, at any time
 $t$
. The specific expression for
 $K$
is
 $$\begin{eqnarray}\displaystyle K(\unicode[STIX]{x1D714},t)=\frac{1-\cos ((\unicode[STIX]{x1D714}+1)t)}{2(\unicode[STIX]{x1D714}+1)^{2}}+\frac{1-\cos ((\unicode[STIX]{x1D714}-1)t)}{2(\unicode[STIX]{x1D714}-1)^{2}}. & & \displaystyle\end{eqnarray}$$
Figure 1(a) shows plots of
 $K(\unicode[STIX]{x1D714},t)$
as a function of
 $\unicode[STIX]{x1D714}$
for several values of
 $t$
. As time progresses, values of
 $K$
at
 $\unicode[STIX]{x1D714}=\pm 1$
grow to form sharp spectral peaks, indicating that most of the energy provided to the oscillator system comes from the narrow-band components in the forcing spectrum. The peak frequency of
 $K$
, in this case
 $|\unicode[STIX]{x1D714}|=1$
, corresponds to the natural frequency of the oscillator.
From the above considerations, we recall another, and perhaps more famous, case; that is, a forced damped oscillator, which can be represented as
 $$\begin{eqnarray}\frac{\text{d}^{2}x}{\text{d}t^{2}}+\unicode[STIX]{x1D708}\frac{\text{d}x}{\text{d}t}+x=\unicode[STIX]{x1D716}f(t)\quad (\unicode[STIX]{x1D708}>0).\end{eqnarray}$$
Also in this system, the time evolution of the energy can be represented in the form of (2.6), using a different function
 $K$
. Owing to the damping effect,
 $K(\unicode[STIX]{x1D714},t)$
uniformly converges in the limit of
 $t\rightarrow \infty$
as
 $$\begin{eqnarray}K(\unicode[STIX]{x1D714},t)\rightarrow k(\unicode[STIX]{x1D714})\equiv \frac{1+\unicode[STIX]{x1D714}^{2}}{(\unicode[STIX]{x1D714}^{2}-1)^{2}+\unicode[STIX]{x1D708}^{2}}.\end{eqnarray}$$
Figure 1(b) shows the shape of the function
 $k(\unicode[STIX]{x1D714})$
. The square root of
 $k(\unicode[STIX]{x1D714})$
corresponds to the classical resonance curve, which represents the ratio of the amplitude of the oscillator to that of the forcing for each frequency in a steady state. In contrast, for the completely undamped case (2.1),
 $K(\unicode[STIX]{x1D714},t)$
diverges at
 $\unicode[STIX]{x1D714}=\pm 1$
in the long-time limit. Therefore,
 $\langle E\rangle$
will never reach a steady state. In the following, excluding the damping effect, we focus on such an unsteady process and discuss the rate at which the energy grows in response to several types of driving forces.
(a) Plots of the kernel
 $K(\unicode[STIX]{x1D714},t)$
as defined in (2.7) versus frequency
 $\unicode[STIX]{x1D714}$
at different times
 $t$
. (b) Plot of
 $k(\unicode[STIX]{x1D714})$
, the asymptotic form of the kernel
 $K(\unicode[STIX]{x1D714},t)$
for a damping oscillator, as defined in (2.9).

2.1 Types of response
First, we consider a monochromatic forcing
 $F(\unicode[STIX]{x1D70F})=\cos (\unicode[STIX]{x1D70F})$
. In this case, the corresponding forcing spectrum forms a line shape
 $S(\unicode[STIX]{x1D714})=\unicode[STIX]{x03C0}(\unicode[STIX]{x1D6FF}(\unicode[STIX]{x1D714}+1)+\unicode[STIX]{x1D6FF}(\unicode[STIX]{x1D714}-1))$
, substitution of which into (2.6) yields
 $$\begin{eqnarray}\langle E\rangle =\frac{\unicode[STIX]{x1D716}^{2}t^{2}}{4}+\frac{\unicode[STIX]{x1D716}^{2}\sin ^{2}t}{4}.\end{eqnarray}$$
As time progresses, the first term on the right-hand side of (2.10) quickly becomes dominant. This result may seem natural because, as is well known, when an oscillator is driven with its natural frequency, its oscillation amplitude becomes directly proportional to time, and therefore the energy, being proportional to amplitude squared, is proportional to the square of time.
Second, we consider stochastic white-noise forcing
 $F(\unicode[STIX]{x1D70F})=\unicode[STIX]{x1D6FF}(\unicode[STIX]{x1D70F})$
, which corresponds to
 $S(\unicode[STIX]{x1D714})=1$
. In this case, (2.3) directly yields the energy expectation value
 $$\begin{eqnarray}\langle E\rangle =\frac{\unicode[STIX]{x1D716}^{2}t}{2}.\end{eqnarray}$$
This result also corresponds to the familiar feature of a basic stochastic process: variance of the spatial displacement of a randomly forced particle grows proportionally with time.
The contrasting expressions (2.10) and (2.11),
 $\langle E\rangle \propto t^{2}$
for the former case and
 $\langle E\rangle \propto t$
for the latter case, represent the essential difference between dynamic and kinetic responses. Moreover, an additional viewpoint can be introduced by focusing on the amplitude parameter of the forcing term
 $\unicode[STIX]{x1D716}$
. The energy expectation value reaches
 $O(1)$
in
 $t\sim O(\unicode[STIX]{x1D716}^{-1})$
in the former case and
 $t\sim O(\unicode[STIX]{x1D716}^{-2})$
in the latter case. They are exactly the dynamic and kinetic time scales, as defined in § 1.
From the above example, we have verified that the energy expectation value of the oscillator in response to a simple white noise grows linearly with time. In fact, this property holds for more general situations. To see this, we differentiate (2.6) with respect to
 $t$
and use an elementary asymptotic relation,
 $\sin (\unicode[STIX]{x1D714}t)/\unicode[STIX]{x1D714}\rightarrow \unicode[STIX]{x03C0}\unicode[STIX]{x1D6FF}(\unicode[STIX]{x1D714})$
, that holds in the limit of
 $t\rightarrow \infty$
. We then obtain
 $$\begin{eqnarray}\frac{\text{d}\langle E\rangle }{\text{d}t}=\frac{\unicode[STIX]{x1D716}^{2}}{4}\int _{-\infty }^{\infty }S(\unicode[STIX]{x1D714})(\unicode[STIX]{x1D6FF}(\unicode[STIX]{x1D714}+1)+\unicode[STIX]{x1D6FF}(\unicode[STIX]{x1D714}-1))\,\text{d}\unicode[STIX]{x1D714}.\end{eqnarray}$$
Equation (2.12) shows that the long-term evolution of the energy expectation value can be described by a first-order differential equation. This is the cornerstone of Hasselmann’s work that underlies the derivation of the kinetic equation. However, a problem arises at this point; the right-hand side of (2.12) never takes a finite value when the forcing spectrum
 $S(\unicode[STIX]{x1D714})$
is also composed of delta functions, as is the case for the monochromatic driving forces. Therefore, equation (2.12) never explains the existing result (2.10), in which the energy expectation value grows nonlinearly with time:
 $\langle E\rangle \propto t^{2}$
. Yet, this puzzle can be resolved if we consider the following.
We have already seen the responses of an oscillator to monochromatic and white-noise forcing. Let us now consider the intermediate case, that is, a quasi-periodic forcing with a narrow-band spectrum. A simple model is introduced as
 $$\begin{eqnarray}f(t)=\sqrt{2}\sin (t+\sqrt{2\unicode[STIX]{x1D707}}W_{t}+\unicode[STIX]{x1D703}),\end{eqnarray}$$
where
 $W_{t}$
represents the Wiener process,
 $\unicode[STIX]{x1D703}$
is a uniform random number ranging from
 $0$
to
 $2\unicode[STIX]{x03C0}$
, and
 $\unicode[STIX]{x1D707}>0$
is an additional constant. In accordance with appendix A, the autocorrelation of (2.13) is written as
 $$\begin{eqnarray}F(\unicode[STIX]{x1D70F})=\langle \,f(t+\unicode[STIX]{x1D70F})f(t)\rangle =\exp (-\unicode[STIX]{x1D707}|\unicode[STIX]{x1D70F}|)\cos (\unicode[STIX]{x1D70F}),\end{eqnarray}$$
with an associated power spectrum,
 $$\begin{eqnarray}S(\unicode[STIX]{x1D714})=\frac{\unicode[STIX]{x1D707}}{(\unicode[STIX]{x1D714}+1)^{2}+\unicode[STIX]{x1D707}^{2}}+\frac{\unicode[STIX]{x1D707}}{(\unicode[STIX]{x1D714}-1)^{2}+\unicode[STIX]{x1D707}^{2}}.\end{eqnarray}$$
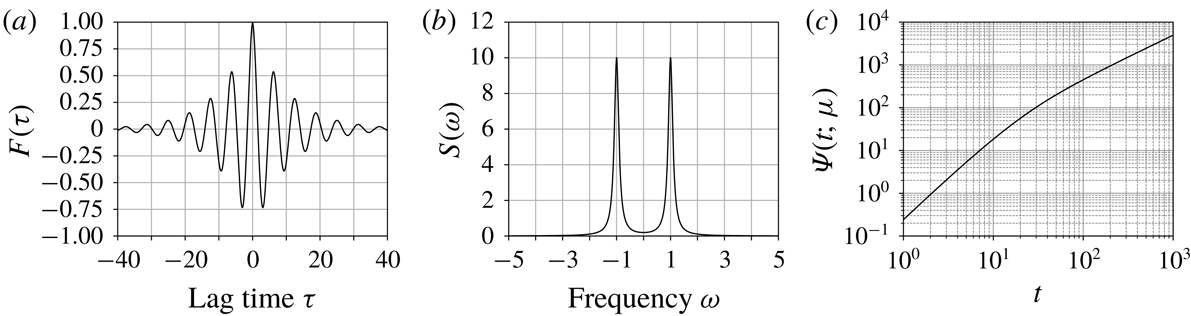
The function (2.13) represents a phase-modulating wave, with
 $\unicode[STIX]{x1D707}$
specifying the intensity of modulation. The parameter
 $\unicode[STIX]{x1D707}$
is interpreted physically as the reciprocal of the correlation length in the time domain (see figure 2
a) or the half-value width in the frequency domain (figure 2
b). Since
 $S(\unicode[STIX]{x1D714})$
and
 $K(\unicode[STIX]{x1D714},t)$
both include two terms with their spectrum peaks occurring at
 $\unicode[STIX]{x1D714}=\pm 1$
, if we ignore cross-multiplication terms, (2.6) can be calculated as
 $$\begin{eqnarray}\langle E\rangle \sim \frac{\unicode[STIX]{x1D716}^{2}t}{2\unicode[STIX]{x1D707}}+\frac{\unicode[STIX]{x1D716}^{2}}{2\unicode[STIX]{x1D707}^{2}}(\exp (-\unicode[STIX]{x1D707}t)-1)\equiv \unicode[STIX]{x1D716}^{2}\unicode[STIX]{x1D6F9}(t;\unicode[STIX]{x1D707}),\end{eqnarray}$$
where a new function
 $\unicode[STIX]{x1D6F9}(t;\unicode[STIX]{x1D707})$
is introduced. This function has two types of asymptotic forms:
 $$\begin{eqnarray}\unicode[STIX]{x1D6F9}(t;\unicode[STIX]{x1D707})=\frac{t}{2\unicode[STIX]{x1D707}}+\frac{\exp (-\unicode[STIX]{x1D707}t)-1}{2\unicode[STIX]{x1D707}^{2}}\sim \left\{\begin{array}{@{}ll@{}}\displaystyle \frac{t^{2}}{4}\quad & \text{for}~t\sim 0,\\ \displaystyle \frac{t}{2\unicode[STIX]{x1D707}}\quad & \text{for}~t\sim \infty .\end{array}\right.\end{eqnarray}$$
Notice that the power laws with respect to
 $t$
in (2.17) correspond to the prior two cases (2.10) and (2.11). Figure 2(c) presents plots of (2.17) on double-logarithmic axes, showing the transition of energy growth from the dynamic- to kinetic-type responses. Since the transition time can be scaled as
 $t\sim \unicode[STIX]{x1D707}^{-1}$
, let us define the ‘dynamic time range’ as
 $t\ll \unicode[STIX]{x1D707}^{-1}$
, and the ‘kinetic time range’ as
 $t\gg \unicode[STIX]{x1D707}^{-1}$
. It is interesting to note that conventional dynamic and kinetic ‘time scales’ are defined in terms of the amplitude of forcing, but the new concept of ‘time ranges’ are now introduced in terms of the spectrum width.
(a) Autocorrelation function of the modulated sinusoidal function, as defined in (2.14). (b) Power spectrum of the modulated sinusoidal function, as defined in (2.15). (c) Double-logarithmic plot of function
 $\unicode[STIX]{x1D6F9}(t;\unicode[STIX]{x1D707})$
, which represents the time evolution of the energy expectation value of an oscillator in response to stochastic forcing (2.13). In all panels,
 $\unicode[STIX]{x1D707}=0.1$
is adopted.

The above result provides a criterion that determines the validity of (2.12). For the energy expectation value to be represented by (2.12), the measurement time
 $t$
must be longer than the correlation time of the forcing
 $\unicode[STIX]{x1D707}^{-1}$
. This property is rewarded in terms of the spectrum width. If we consider the integrand of the right-hand side of (2.6), the spectrum width of
 $K(\unicode[STIX]{x1D714},t)$
becomes narrower with time, whereas
 $S(\unicode[STIX]{x1D714})$
remains unchanged. For short times,
 $S(\unicode[STIX]{x1D714})$
is much narrower than
 $K(\unicode[STIX]{x1D714},t)$
, whereas over longer times the relation is reversed. The interchange occurs at
 $t\sim \unicode[STIX]{x1D707}^{-1}$
, corresponding to a transition from dynamic to kinetic time ranges. In the line spectrum limit
 $\unicode[STIX]{x1D707}\rightarrow 0$
, the transition time diverges to infinity, making the kinetic time range inaccessible. This is the simplest explanation as to why the expression (2.12) becomes invalid for a situation involving monochromatic forcing.
We can explain the difference between the two types of responses in an alternative way. In figure 3, grey curves show the numerically calculated sample paths of
 $E$
, excited by quasi-periodic forcing (2.13), whereas the black curve depicts their expectation value
 $\langle E\rangle$
. In the dynamic time range, almost all of the sample paths are close to the expectation value. In the kinetic time range, in contrast, each path shows random variations, deviating around the expectation value. From this property, it can be said that the transition from the dynamic to kinetic ranges corresponds to that from deterministic to stochastic ranges.
Time evolution of the energy of the oscillator in response to stochastic forcing as specified in (2.1) and (2.13), depicted in a double-logarithmic graph. The grey curves are numerically obtained sample paths. The black curve represents their expectation value, which is defined in (2.16). The parameters are chosen as
 $\unicode[STIX]{x1D716}=1$
and
 $\unicode[STIX]{x1D707}=0.03$
.

3 Parametric excitation
In the case of a linear response, the division point between dynamic- and kinetic-type responses depends only on the bandwidth of the forcing spectrum, which is given by
 $\unicode[STIX]{x1D707}$
in this paper. For a nonlinear system, we also need to take into account the amplitude of oscillation that determines the intensity of self-interaction. Since the full nonlinear equations are difficult to analyse directly, we begin with a linear parametric excitation model, which can demonstrate the essence of self-interaction and resulting wave amplification.
Parametric excitation can be described by a differential equation with variable coefficients. Here, we consider a model equation,
 $$\begin{eqnarray}\frac{\text{d}^{2}x}{\text{d}t^{2}}+(1+\unicode[STIX]{x1D716}f(t))x=0,\end{eqnarray}$$
with associated initial conditions
 $x(0)=0$
and
 ${\dot{x}}(0)=a$
. The parameter
 $\unicode[STIX]{x1D716}$
, which represents the typical amplitude of the variable coefficient, is assumed here to be small. Unlike the case of linear response, parametric excitation shows an exponential growth in energy,
 $E\sim C\text{e}^{\unicode[STIX]{x1D706}t}$
. The constant
 $\unicode[STIX]{x1D706}$
is generally called the growth rate.
If
 $f(t)$
is a simple sinusoidal function, equation (3.1) reduces to the Mathieu equation. Let us consider the special case where the frequency of
 $f$
coincides with twice the natural frequency of the system,
 $$\begin{eqnarray}f=\sqrt{2}\sin (2t+\unicode[STIX]{x1D703}),\end{eqnarray}$$
where
 $\unicode[STIX]{x1D703}$
is again a random constant taking values ranging from
 $0$
to
 $2\unicode[STIX]{x03C0}$
. In this case, equation (3.1) can be solved in the usual asymptotic manner (appendix B). As a result, the energy expectation value can be approximately expressed as
 $$\begin{eqnarray}\langle E\rangle =\frac{1}{2\unicode[STIX]{x03C0}}\int _{0}^{2\unicode[STIX]{x03C0}}\frac{1}{2}(x^{2}+{\dot{x}}^{2})\,\text{d}\unicode[STIX]{x1D703}\sim \frac{a^{2}}{2}\cosh \left(\frac{\sqrt{2}\unicode[STIX]{x1D716}t}{2}\right).\end{eqnarray}$$
Equation (3.3) shows that the growth rate is proportional to the coefficient
 $\unicode[STIX]{x1D716}$
. In other words, excitation occurs on the dynamic time scale.
For an arbitrary function
 $f(t)$
, it is difficult to solve equation (3.1) exactly. If
 $f$
is a periodic function perturbed by stochastic noise, in particular, the problem becomes so-called stochastic parametric excitation. Although stochastic parametric excitation has so far been investigated in several studies (e.g., Floris Reference Floris2012), we revisit this topic in connection with wave–wave interaction theory. In the following, we first present a heuristic procedure to derive the growth rate of a basic model of stochastic parametric excitation. After that, a more general statistical theory is introduced.
3.1 Heuristic approach
Let us construct an asymptotic solution for (3.1) by first expanding
 $x$
in terms of
 $\unicode[STIX]{x1D716}$
:
 $$\begin{eqnarray}x=x_{0}+\unicode[STIX]{x1D716}x_{1}+\unicode[STIX]{x1D716}^{2}x_{2}+\cdots \,.\end{eqnarray}$$
The solutions up to the second order are as follows:
 $$\begin{eqnarray}\displaystyle & \displaystyle x_{0}=a\sin t, & \displaystyle\end{eqnarray}$$
 $$\begin{eqnarray}\displaystyle & \displaystyle x_{1}=-a\int _{0}^{t}\sin (t-t_{1})f(t_{1})\sin t_{1}\,\text{d}t_{1}, & \displaystyle\end{eqnarray}$$
 $$\begin{eqnarray}\displaystyle & \displaystyle x_{2}=a\int _{0}^{t}\sin (t-t_{1})f(t_{1})\int _{0}^{t_{1}}\sin (t_{1}-t_{2})f(t_{2})\sin t_{2}\,\text{d}t_{1}\,\text{d}t_{2}. & \displaystyle\end{eqnarray}$$
 $f(t)$
to be a stationary process and define its power spectrum as
 $S(\unicode[STIX]{x1D714})$
. Using (3.5), the energy expectation value
 $\langle E(t)\rangle =\langle x^{2}+{\dot{x}}^{2}\rangle /2$
can be approximately written as
 $$\begin{eqnarray}\displaystyle & \displaystyle \langle E\rangle =\frac{a^{2}}{2}+\frac{\unicode[STIX]{x1D716}^{2}a^{2}}{2\unicode[STIX]{x03C0}}\int _{-\infty }^{\infty }S(\unicode[STIX]{x1D714})K(\unicode[STIX]{x1D714},t)\,\text{d}\unicode[STIX]{x1D714}+O(\unicode[STIX]{x1D716}^{3}), & \displaystyle\end{eqnarray}$$
 $$\begin{eqnarray}\displaystyle & \displaystyle K(\unicode[STIX]{x1D714},t)=\frac{1-\cos ((\unicode[STIX]{x1D714}-2)t)}{2\unicode[STIX]{x1D714}(\unicode[STIX]{x1D714}-2)^{2}}-\frac{1-\cos ((\unicode[STIX]{x1D714}+2)t)}{2\unicode[STIX]{x1D714}(\unicode[STIX]{x1D714}+2)^{2}}. & \displaystyle\end{eqnarray}$$
 $K(\unicode[STIX]{x1D714},t)$
has peaks at
 $\unicode[STIX]{x1D714}=\pm 2$
.
Let us now assume that the variable coefficient is a phase-modulating wave,
 $$\begin{eqnarray}\displaystyle f(t)=\sqrt{2}\sin (2t+\sqrt{2\unicode[STIX]{x1D707}}W_{t}+\unicode[STIX]{x1D703}), & & \displaystyle\end{eqnarray}$$
and hence
 $$\begin{eqnarray}\displaystyle S(\unicode[STIX]{x1D714})=\frac{\unicode[STIX]{x1D707}}{(\unicode[STIX]{x1D714}+2)^{2}+\unicode[STIX]{x1D707}^{2}}+\frac{\unicode[STIX]{x1D707}}{(\unicode[STIX]{x1D714}-2)^{2}+\unicode[STIX]{x1D707}^{2}}. & & \displaystyle\end{eqnarray}$$
Ignoring the cross-multiplication terms and replacing the factors
 $\unicode[STIX]{x1D714}$
in the denominator of
 $K$
by the peak frequency
 $\pm 2$
, we can calculate (3.6) as
 $$\begin{eqnarray}\langle E\rangle =\frac{a^{2}}{2}+\frac{\unicode[STIX]{x1D716}^{2}a^{2}}{2}\left[\frac{t}{2\unicode[STIX]{x1D707}}+\frac{\exp (-\unicode[STIX]{x1D707}t)-1}{2\unicode[STIX]{x1D707}^{2}}\right]+O(\unicode[STIX]{x1D716}^{3}).\end{eqnarray}$$
The bracketed terms on the right-hand side of (3.9) are secular, which means that the resonant feedback to the energy of the oscillator accumulates with time and thus the solution (3.9) does not hold for large
 $t$
. To obtain a global solution, a singular perturbation approach is needed. Traditional singular perturbation methods such as described by Bender & Orszag (Reference Bender and Orszag1999) are not applicable to this problem; however, the renormalisation theory developed by Chen, Goldenfeld & Oono (Reference Chen, Goldenfeld and Oono1996) may be suitable. That is, we reconstruct a differential equation that is consistent with the regular perturbation solution (3.9) in
 $t\ll \unicode[STIX]{x1D716}^{-1}$
. In fact, this idea has already been employed in the derivation of (2.12). Although our method is not a strict mathematical procedure, the result agrees well with the numerical solutions and, more importantly, gives us basic insight into the applicability of the kinetic equation.
To make the problem simpler, the regular perturbation solution (3.9) is rewritten as
 $$\begin{eqnarray}\langle E(t)\rangle =\langle E(0)\rangle +\unicode[STIX]{x1D716}^{2}\unicode[STIX]{x1D6F9}(t;\unicode[STIX]{x1D707})\langle E(0)\rangle .\end{eqnarray}$$
We then consider two special cases.
Firstly, the function
 $\unicode[STIX]{x1D6F9}$
is evaluated in the dynamic time range. The energy expectation value (3.10) can then be approximated as
 $$\begin{eqnarray}\langle E(t)\rangle =\langle E(0)\rangle +\frac{\unicode[STIX]{x1D716}^{2}t^{2}}{4}\langle E(0)\rangle .\end{eqnarray}$$
The first and second derivatives of (3.11) at
 $t=0$
are written as
 $$\begin{eqnarray}\frac{\text{d}}{\text{d}t}\langle E\rangle =0,\quad \frac{\text{d}^{2}}{\text{d}t^{2}}\langle E\rangle =\frac{\unicode[STIX]{x1D716}^{2}}{2}\langle E\rangle .\end{eqnarray}$$
Again, solving the latter equation of (3.12) with the initial condition of the former, we obtain
 $$\begin{eqnarray}\langle E\rangle =\langle E(0)\rangle \cosh \left(\frac{\sqrt{2}\unicode[STIX]{x1D716}t}{2}\right).\end{eqnarray}$$
This result coincides with the basic solution (3.3).
Another situation occurs when
 $\unicode[STIX]{x1D6F9}$
is evaluated in the kinetic time range. In this case, equation (3.10) can be approximated as
 $$\begin{eqnarray}\langle E(t)\rangle =\langle E(0)\rangle +\frac{\unicode[STIX]{x1D716}^{2}t}{2\unicode[STIX]{x1D707}}\langle E(0)\rangle .\end{eqnarray}$$
The first derivative of (3.14) at
 $t=0$
is
 $$\begin{eqnarray}\frac{\text{d}}{\text{d}t}\langle E\rangle =\frac{\unicode[STIX]{x1D716}^{2}}{2\unicode[STIX]{x1D707}}\langle E\rangle ,\end{eqnarray}$$
which is solved as
 $$\begin{eqnarray}\langle E\rangle =\langle E(0)\rangle \exp \left(\frac{\unicode[STIX]{x1D716}^{2}t}{2\unicode[STIX]{x1D707}}\right).\end{eqnarray}$$
For the kinetic case, the growth rate is proportional to the square of
 $\unicode[STIX]{x1D716}$
and diverges in the narrow-band limit,
 $\unicode[STIX]{x1D707}\rightarrow 0$
, as mentioned in § 1.
The difference between (3.13) and (3.16) originates from the choice of a time range in which the resonance feedback is evaluated. How, then, should we adopt the time range? The answer depends on when the secular terms reach
 $O(1)$
. That is, if
 $\unicode[STIX]{x1D716}^{2}\unicode[STIX]{x1D6F9}(t)\sim O(1)$
occurs within the dynamic time range
 $t\ll \unicode[STIX]{x1D707}^{-1}$
, the approximation (3.11) is valid. If
 $\unicode[STIX]{x1D716}^{2}\unicode[STIX]{x1D6F9}(t)\sim O(1)$
occurs in the kinetic time range
 $t\gg \unicode[STIX]{x1D707}^{-1}$
, the approximation (3.14) becomes valid instead. Moreover, in the latter case, the time evolution of the energy expectation value is described by the first-order differential equation (3.15) in the same way as (2.12). The kinetic equation is generally derived in this way.
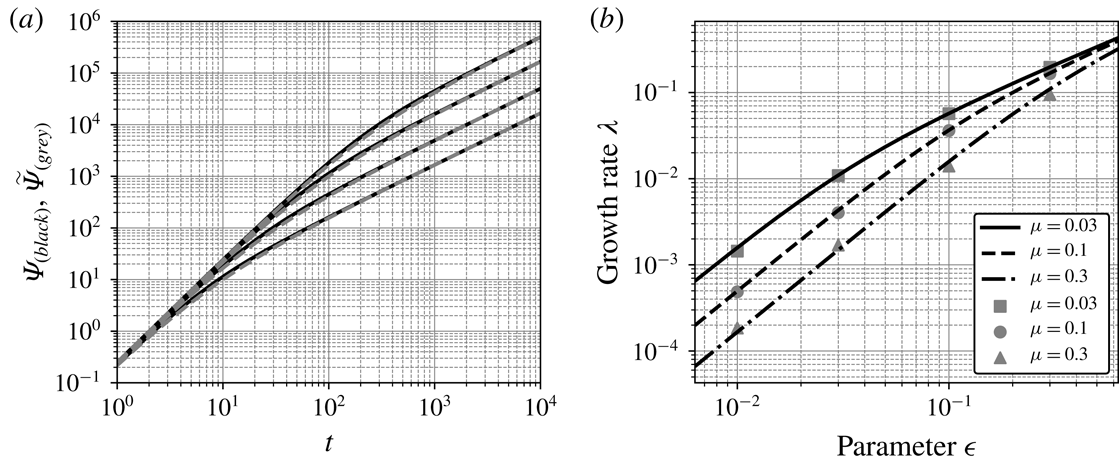
(a) Double-logarithmic plots of
 $\unicode[STIX]{x1D6F9}(t;\unicode[STIX]{x1D707})$
(solid black curves) and its approximate form
 $\tilde{\unicode[STIX]{x1D6F9}}(t;\unicode[STIX]{x1D707})$
(broken grey curves) for
 $\unicode[STIX]{x1D707}=0.01,0.03,0.1,0.3$
. The expressions are defined in (2.17) and (3.18). (b) Growth rates of the energy expectation value of the stochastically excited oscillator, as specified in (3.1) and (3.7). The black curves represent analytical solution (3.21), whereas the grey symbols represent experimental values. The numerical calculation was conducted 1000 times for each case using the fourth-order Runge–Kutta method with a time interval
 $\unicode[STIX]{x0394}t=0.03$
. The logarithm of the average energy is linearly fitted for
 $90\leqslant t\leqslant 450$
to estimate the growth rates.

We now seek a unified expression of the growth rate that is applicable to both the dynamic and kinetic cases. In the derivation of (3.12) and (3.15), we have replaced the secular terms in (3.10) by polynomial forms. Extending this idea, we consider a rational function
 $$\begin{eqnarray}\frac{t^{2}}{\unicode[STIX]{x1D6FC}+\unicode[STIX]{x1D6FD}t},\end{eqnarray}$$
which approaches
 $t^{2}/\unicode[STIX]{x1D6FC}$
as
 $t\rightarrow 0$
and
 $t/\unicode[STIX]{x1D6FD}$
as
 $t\rightarrow \infty$
. Choosing
 $\unicode[STIX]{x1D6FC}=4$
and
 $\unicode[STIX]{x1D6FD}=2\unicode[STIX]{x1D707}$
makes (2.17) and (3.17) asymptotically identical in both the short- and long-time limits. With this in mind, we define a new function,
 $$\begin{eqnarray}\tilde{\unicode[STIX]{x1D6F9}}(t;\unicode[STIX]{x1D707})=\frac{t^{2}}{4+2\unicode[STIX]{x1D707}t},\end{eqnarray}$$
and replace
 $\unicode[STIX]{x1D6F9}(t;\unicode[STIX]{x1D707})$
in (3.10) by
 $\tilde{\unicode[STIX]{x1D6F9}}(t;\unicode[STIX]{x1D707})$
. Figure 4(a) compares
 $\unicode[STIX]{x1D6F9}(t;\unicode[STIX]{x1D707})$
and
 $\tilde{\unicode[STIX]{x1D6F9}}(t;\unicode[STIX]{x1D707})$
in double-logarithmic plots. Close agreement between the two functions is promising regarding the validity of this approximation. Let us transform the equation
 $\langle E(t)\rangle =\langle E(0)\rangle +\unicode[STIX]{x1D716}^{2}\tilde{\unicode[STIX]{x1D6F9}}(t;\unicode[STIX]{x1D707})\langle E(0)\rangle$
into the following:
 $$\begin{eqnarray}(4+2\unicode[STIX]{x1D707}t)(\langle E(t)\rangle -\langle E(0)\rangle )-\unicode[STIX]{x1D716}^{2}t^{2}\langle E(0)\rangle =0.\end{eqnarray}$$
The second derivative of (3.19) at
 $t=0$
yields
 $$\begin{eqnarray}\frac{\text{d}^{2}}{\text{d}t^{2}}\langle E\rangle +\unicode[STIX]{x1D707}\frac{\text{d}}{\text{d}t}\langle E\rangle -\frac{\unicode[STIX]{x1D716}^{2}}{2}\langle E\rangle =0.\end{eqnarray}$$
The positive root of the characteristic equation of (3.20) is
 $$\begin{eqnarray}\unicode[STIX]{x1D706}=\frac{-\unicode[STIX]{x1D707}+\sqrt{\unicode[STIX]{x1D707}^{2}+2\unicode[STIX]{x1D716}^{2}}}{2}.\end{eqnarray}$$
The solution (3.21) has two asymptotic forms:
 $$\begin{eqnarray}\unicode[STIX]{x1D706}\sim \left\{\begin{array}{@{}ll@{}}\displaystyle \frac{\sqrt{2}\unicode[STIX]{x1D716}}{2}\quad & \text{for }\unicode[STIX]{x1D707}\ll \unicode[STIX]{x1D716},\\ \displaystyle \frac{\unicode[STIX]{x1D716}^{2}}{2\unicode[STIX]{x1D707}}\quad & \text{for }\unicode[STIX]{x1D707}\gg \unicode[STIX]{x1D716},\end{array}\right.\end{eqnarray}$$
in agreement with the dynamic and kinetic results, equations (3.13) and (3.16). Figure 4(b) compares the analytical solution (3.21) with the experimentally obtained growth rates. The unified solution (3.21) also agrees well with the results from direct numerical integrations.
3.2 Statistical theory
In § 3.1, the growth rate of stochastic parametric excitation was heuristically derived. Here, a more systematic consideration is presented based on a general statistical approach. Attention should be paid to the assumptions to be employed, as the validity of these is a central concern in the resonant interaction theory.
First, we introduce a complex variable
 $a=(x+\text{i}{\dot{x}})/\sqrt{2}$
, and rewrite (3.1) as
 $$\begin{eqnarray}\frac{\text{d}a}{\text{d}t}=-\text{i}a-\frac{\text{i}\unicode[STIX]{x1D716}}{2}fa-\frac{\text{i}\unicode[STIX]{x1D716}}{2}fa^{\dagger },\end{eqnarray}$$
where
 $^{\dagger }$
indicates the complex conjugate. Since the energy expectation value can be expressed as
 $\langle E\rangle =\langle a^{\dagger }a\rangle$
, equation (3.23) yields a simple energy equation,
 $$\begin{eqnarray}\frac{\text{d}}{\text{d}t}\langle E\rangle =-\unicode[STIX]{x1D716}\,\text{Im}\langle \,fa^{2}\rangle .\end{eqnarray}$$
This equation implies that the variation in energy expectation value is induced by the triple correlation of the complex variable
 $a$
and the forcing function
 $f$
. Now, we expand the complex variable as
 $$\begin{eqnarray}a(t)=a_{0}(t)+\unicode[STIX]{x1D716}a_{1}(t)+O(\unicode[STIX]{x1D716}^{2}).\end{eqnarray}$$
Substituting this into (3.23) gives the zero- and first-order equations:
 $$\begin{eqnarray}\displaystyle & \displaystyle \frac{\text{d}a_{0}}{\text{d}t}=-\text{i}a_{0}, & \displaystyle\end{eqnarray}$$
 $$\begin{eqnarray}\displaystyle & \displaystyle \frac{\text{d}a_{1}}{\text{d}t}=-\text{i}a_{1}-\frac{\text{i}\unicode[STIX]{x1D716}}{2}fa_{0}-\frac{\text{i}\unicode[STIX]{x1D716}}{2}fa_{0}^{\dagger }. & \displaystyle\end{eqnarray}$$
 $$\begin{eqnarray}a_{1}=-\frac{\text{i}\unicode[STIX]{x1D716}}{2}\int ^{t}\text{e}^{-\text{i}(t-t^{\prime })}(f(t^{\prime })a_{0}(t^{\prime })+f(t^{\prime })a_{0}^{\dagger }(t^{\prime }))\,\text{d}t^{\prime }.\end{eqnarray}$$
Substituting
 $a\sim a_{0}+\unicode[STIX]{x1D716}a_{1}$
together with (3.27) into (3.24) with the assumptions for the statistical properties,
 $$\begin{eqnarray}\displaystyle & \displaystyle \langle \,f(t)a_{0}(t)^{2}\rangle =0, & \displaystyle\end{eqnarray}$$
 $$\begin{eqnarray}\displaystyle & \displaystyle \langle \,f(t)f(t^{\prime })a_{0}(t)a_{0}(t^{\prime })\rangle =0, & \displaystyle\end{eqnarray}$$
 $$\begin{eqnarray}\displaystyle & \displaystyle \langle \,f(t)f(t^{\prime })a_{0}(t)a_{0}^{\dagger }(t^{\prime })\rangle =\langle \,f(t)f(t^{\prime })\rangle \langle a_{0}(t)a_{0}^{\dagger }(t^{\prime })\rangle , & \displaystyle\end{eqnarray}$$
 $$\begin{eqnarray}\frac{\text{d}}{\text{d}t}\langle E\rangle =\unicode[STIX]{x1D716}^{2}\,\text{Im}\int ^{t}\text{i}\text{e}^{-\text{i}(t-t^{\prime })}\langle \,f(t)f(t^{\prime })\rangle \langle a_{0}(t)a_{0}^{\dagger }(t^{\prime })\rangle \,\text{d}t^{\prime }.\end{eqnarray}$$
Taking into account
 $\langle \,f(t)f(t^{\prime })\rangle =F(t-t^{\prime })$
and making an additional assumption that
 $\langle a_{0}(t)a_{0}^{\dagger }(t^{\prime })\rangle \sim \text{e}^{-\text{i}(t-t^{\prime })}\langle E(t^{\prime })\rangle$
, which comes from (3.26a
), a closed equation
 $$\begin{eqnarray}\frac{\text{d}}{\text{d}t}\langle E\rangle =\unicode[STIX]{x1D716}^{2}\int ^{t}\cos (2(t-t^{\prime }))F(t-t^{\prime })\langle E(t^{\prime })\rangle \,\text{d}t^{\prime }\end{eqnarray}$$
is obtained. Conditions (3.28) argue that variations in the oscillator and the forcing function are statistically independent at their lowest order and their correlations can be evaluated from the perturbation terms. This corresponds to the classical Gaussian assumption (see § 4.1 for details) frequently made in turbulence theory.
In (3.30), the evolution of
 $\langle E\rangle$
depends on its earlier values. As we would like to discuss the long-term evolution of the system, the choice of initial condition at
 $t=0$
is inconvenient. Alternatively, we define the initial condition to be
 $$\begin{eqnarray}\langle E\rangle \rightarrow 0\quad \text{for }t\rightarrow -\infty .\end{eqnarray}$$
One may consider an additional Markovian approximation: to replace the energy expectation value
 $\langle E(t^{\prime })\rangle$
in the integrand of (3.30) by the present value
 $\langle E(t)\rangle$
. This allows the time integration on the right-hand side to be performed without solving the differential equation. This coincides with the procedure in the derivation of (2.12), which again breaks down if the correlation function
 $F(\unicode[STIX]{x1D70F})$
involves a pure sinusoidal function. To avoid this problem, we now directly solve (3.30), by assuming only an exponential function
 $\langle E(t)\rangle =\text{e}^{\unicode[STIX]{x1D706}t}$
as its solution. Transforming the correlation function
 $F(\unicode[STIX]{x1D70F})$
into the power spectrum
 $S(\unicode[STIX]{x1D714})$
and integrating the right-hand side of (3.30) from
 $-\infty$
to
 $0$
, we obtain the characteristic equation
 $$\begin{eqnarray}\unicode[STIX]{x1D706}=\frac{\unicode[STIX]{x1D716}^{2}}{2\unicode[STIX]{x03C0}}\int _{-\infty }^{\infty }S(\unicode[STIX]{x1D714})\left(\frac{\unicode[STIX]{x1D706}}{2((\unicode[STIX]{x1D714}+2)^{2}+\unicode[STIX]{x1D706}^{2})}+\frac{\unicode[STIX]{x1D706}}{2((\unicode[STIX]{x1D714}-2)^{2}+\unicode[STIX]{x1D706}^{2})}\right)\text{d}\unicode[STIX]{x1D714},\end{eqnarray}$$
which determines the growth rate
 $\unicode[STIX]{x1D706}$
in response to a given power spectrum
 $S$
.
A special choice of
 $S$
for a phase-modulating wave, (3.8), reduces (3.32) to a simple algebraic equation,
 $$\begin{eqnarray}\unicode[STIX]{x1D706}=\frac{\unicode[STIX]{x1D716}^{2}}{2(\unicode[STIX]{x1D706}+\unicode[STIX]{x1D707})},\end{eqnarray}$$
where trivial cross-multiplication terms are neglected. The positive root of (3.33) is given as
 $\unicode[STIX]{x1D706}=(-\unicode[STIX]{x1D707}+\sqrt{\unicode[STIX]{x1D707}^{2}+2\unicode[STIX]{x1D716}^{2}})/2$
. This is equivalent to the result of § 3.1, that is, (3.21).
Although the heuristic method in § 3.1 and the statistical theory introduced here both produce the same result in the current example, the latter is a more useful methodological approach than the former. The difference between them can be clearly seen when we consider the effect of detuning. If the central frequency of the external function in (3.1) deviates slightly from twice the natural frequency of the system as
 $$\begin{eqnarray}f=\sqrt{2}\sin ((2+\unicode[STIX]{x1D702})t+\sqrt{2\unicode[STIX]{x1D707}}W_{t}+\unicode[STIX]{x1D703})\quad (\unicode[STIX]{x1D702}\ll 1),\end{eqnarray}$$
the energy growth moderates as
 $\unicode[STIX]{x1D702}$
increases. The heuristic method fails to cope with this problem. On the other hand, the characteristic equation (3.32) derived from the statistical theory in this case reduces to
 $$\begin{eqnarray}\unicode[STIX]{x1D706}=\frac{\unicode[STIX]{x1D716}^{2}(\unicode[STIX]{x1D706}+\unicode[STIX]{x1D707})}{2(\unicode[STIX]{x1D706}+\unicode[STIX]{x1D707})^{2}+\unicode[STIX]{x1D702}^{2}}.\end{eqnarray}$$
This is a reasonable result since the positive root of (3.35) coincides with the classical solution (appendix B) in the limit of
 $\unicode[STIX]{x1D707}\rightarrow 0$
.
4 Finite-dimensional case
In §§ 2 and 3, the fundamentals of linear resonance and parametric excitation have been explored for the zero-dimensional cases. In this section, being concerned with real wave systems, we extend the discussion to the finite-dimensional cases. The course is essentially the same as that in § 3.2; we derive the growth rate of PSI using a statistical theory of weak wave–wave interactions. Note that the methodology developed here may apply to a wide range of weakly nonlinear wave systems, including the oceanic internal wave field where resonant triad interaction plays the dominant role in the energy transfer in wavevector space.
4.1 Statistical description of wave–wave interaction
Wave motions are generally described by partial differential equations in which all the variables are defined as functions of both spatial and temporal coordinates. To discuss the wave–wave interactions, however, it is rather convenient to take the Fourier transform such that each spatial coordinate is replaced by the corresponding wavenumber. As a result, the governing equations are transformed into an integro-differential equation. Moreover, in many cases, a conservative wave system can be represented in a simple Hamiltonian form, and a common procedure can be utilised to derive a statistical equation that describes the energy transfer in wavevector space (see Zakharov et al.
Reference Zakharov, L’vov and Falkovich1992). The most standard model for a three-wave system in
 $d$
-dimensional space is described by the Hamiltonian
 $$\begin{eqnarray}\displaystyle & \displaystyle {\mathcal{H}}={\mathcal{H}}_{2}+\unicode[STIX]{x1D716}{\mathcal{H}}_{3}, & \displaystyle\end{eqnarray}$$
 $$\begin{eqnarray}\displaystyle & \displaystyle {\mathcal{H}}_{2}=\int \unicode[STIX]{x1D714}(\boldsymbol{k})a^{\dagger }(\boldsymbol{k})a(\boldsymbol{k})\,\text{d}\boldsymbol{k}, & \displaystyle\end{eqnarray}$$
 $$\begin{eqnarray}\displaystyle {\mathcal{H}}_{3} & = & \displaystyle \int \left\{\frac{1}{2}V(\boldsymbol{k}_{1},\boldsymbol{k}_{2},\boldsymbol{k}_{3})a^{\dagger }(\boldsymbol{k}_{1})a(\boldsymbol{k}_{2})a(\boldsymbol{k}_{3})\unicode[STIX]{x1D6FF}(\boldsymbol{k}_{1}-\boldsymbol{k}_{2}-\boldsymbol{k}_{3})\right.\nonumber\\ \displaystyle & & \displaystyle \left.+\,\frac{1}{6}U(\boldsymbol{k}_{1},\boldsymbol{k}_{2},\boldsymbol{k}_{3})a(\boldsymbol{k}_{1})a(\boldsymbol{k}_{2})a(\boldsymbol{k}_{3})\unicode[STIX]{x1D6FF}(\boldsymbol{k}_{1}+\boldsymbol{k}_{2}+\boldsymbol{k}_{3})\right\}\text{d}\boldsymbol{k}_{1}\,\text{d}\boldsymbol{k}_{2}\,\text{d}\boldsymbol{k}_{3}+\text{c.c.},\quad\end{eqnarray}$$
 $$\begin{eqnarray}\text{i}\frac{\unicode[STIX]{x2202}a}{\unicode[STIX]{x2202}t}=\frac{\unicode[STIX]{x1D6FF}{\mathcal{H}}}{\unicode[STIX]{x1D6FF}a^{\dagger }},\end{eqnarray}$$
where
 $a(\boldsymbol{k},t)$
is a complex variable defined as a function of wavevector
 $\boldsymbol{k}\in \mathbb{R}^{d}$
,
 $\unicode[STIX]{x1D6FF}(\boldsymbol{k})$
is the
 $d$
-dimensional delta function, coefficients
 $\unicode[STIX]{x1D714}(\boldsymbol{k})$
,
 $V(\boldsymbol{k}_{1},\boldsymbol{k}_{2},\boldsymbol{k}_{3})$
and
 $U(\boldsymbol{k}_{1},\boldsymbol{k}_{2},\boldsymbol{k}_{3})$
are functions constant in time,
 $\unicode[STIX]{x1D716}$
is a constant parameter, c.c. denotes the complex conjugate of the previous terms, and integration is performed over the whole wavenumber space. Without loss of generality, we may assume the symmetry of the arguments of the coefficients:
 $V(\boldsymbol{k}_{1},\boldsymbol{k}_{2},\boldsymbol{k}_{3})=V(\boldsymbol{k}_{1},\boldsymbol{k}_{3},\boldsymbol{k}_{2})$
and
 $U$
does not change under any permutation of the arguments. We further assume that
 $\unicode[STIX]{x1D714}(\boldsymbol{k})>0$
holds almost everywhere in
 $\mathbb{R}^{d}$
, which assures the positivity of the Hamiltonian
 ${\mathcal{H}}$
in the asymptotic limit
 $\unicode[STIX]{x1D716}\rightarrow 0$
. Appendix C briefly describes the formulation of this model for the case of rotating long internal waves.
Variable
 $a(\boldsymbol{k},t)$
specifies the amplitude and phase of the wavevector
 $\boldsymbol{k}$
component; it is translated to the real domain,
 $\boldsymbol{r}\in \mathbb{R}^{d}$
, by the inverse Fourier transform,
 $(2\unicode[STIX]{x03C0})^{-d/2}\int a(\boldsymbol{k},t)\text{e}^{\text{i}\boldsymbol{k}\boldsymbol{\cdot }\boldsymbol{r}}\,\text{d}\boldsymbol{k}$
. Expanding the functional derivative of (4.2) leads to an integro-differential equation:
 $$\begin{eqnarray}\text{i}\frac{\unicode[STIX]{x2202}a_{1}}{\unicode[STIX]{x2202}t}=\unicode[STIX]{x1D714}_{1}a_{1}+\unicode[STIX]{x1D716}\int \left(\frac{1}{2}V_{123}a_{2}a_{3}\unicode[STIX]{x1D6FF}_{1-2-3}+V_{213}^{\dagger }a_{2}a_{3}^{\dagger }\unicode[STIX]{x1D6FF}_{2-1-3}+\frac{1}{2}U_{123}^{\dagger }a_{2}^{\dagger }a_{3}^{\dagger }\unicode[STIX]{x1D6FF}_{1+2+3}\right)\text{d}\boldsymbol{k}_{23},\end{eqnarray}$$
where, for conciseness, subscripts are used to represent the arguments of a variable; specifically,
 $a_{1}=a(\boldsymbol{k}_{1},t),~\unicode[STIX]{x1D714}_{1}=\unicode[STIX]{x1D714}(\boldsymbol{k}_{1}),~V_{123}=V(\boldsymbol{k}_{1},\boldsymbol{k}_{2},\boldsymbol{k}_{3}),~U_{123}=U(\boldsymbol{k}_{1},\boldsymbol{k}_{2},\boldsymbol{k}_{3})$
and
 $\unicode[STIX]{x1D6FF}_{1-2-3}=\unicode[STIX]{x1D6FF}(\boldsymbol{k}_{1}-\boldsymbol{k}_{2}-\boldsymbol{k}_{3})$
. From (4.3), one may understand that
 $\unicode[STIX]{x1D714}(\boldsymbol{k})$
represents the linear dispersion relation,
 $V(\boldsymbol{k}_{1},\boldsymbol{k}_{2},\boldsymbol{k}_{3})$
and
 $U(\boldsymbol{k}_{1},\boldsymbol{k}_{2},\boldsymbol{k}_{3})$
represent the nonlinear coupling coefficients for triad interaction, and
 $\unicode[STIX]{x1D716}$
specifies the intensity of the nonlinear interaction. We shall regard
 $\unicode[STIX]{x1D716}$
to be small, that is, the nonlinearity is sufficiently weak.
In the following, we will construct a statistical model to describe the nonlinear energy transfer among waves. First of all, as in the previous sections, let us introduce the notation
 $\langle \cdot \rangle$
to specify the ensemble average. Then, we assume the spatial homogeneity of the system in a statistical sense; that is, any kind of statistical quantity is invariant with respect to the coordinate change in the real domain,
 $\boldsymbol{r}\rightarrow \boldsymbol{r}+\boldsymbol{r}^{\prime }$
. Since this transformation changes the
 $m$
th moment of
 $a$
and
 $a^{\dagger }$
as
 $$\begin{eqnarray}\langle a_{1}\ldots a_{l}a_{l+1}^{\dagger }\ldots a_{m}^{\dagger }\rangle \rightarrow \langle a_{1}\ldots a_{l}a_{l+1}^{\dagger }\ldots a_{m}^{\dagger }\rangle \text{e}^{-\text{i}(\boldsymbol{k}_{1}+\cdots +\boldsymbol{k}_{l}-\boldsymbol{k}_{l+1}-\cdots -\boldsymbol{k}_{m})\boldsymbol{\cdot }\boldsymbol{r}^{\prime }},\end{eqnarray}$$
it can become non-zero only if
 $\boldsymbol{k}_{1}+\cdots +\boldsymbol{k}_{l}-\boldsymbol{k}_{l+1}-\cdots -\boldsymbol{k}_{m}=0$
is satisfied. This condition allows the second- and third-order correlation functions (here we omit
 $\langle a_{1}a_{2}\rangle$
since it will not appear in the following discussion) to be represented as
 $$\begin{eqnarray}\displaystyle & \displaystyle \langle a^{\dagger }(\boldsymbol{k}_{1},t)a(\boldsymbol{k}_{2},t)\rangle =n(\boldsymbol{k}_{1},t)\unicode[STIX]{x1D6FF}(\boldsymbol{k}_{1}-\boldsymbol{k}_{2}), & \displaystyle\end{eqnarray}$$
 $$\begin{eqnarray}\displaystyle & \displaystyle \langle a^{\dagger }(\boldsymbol{k}_{1},t)a(\boldsymbol{k}_{2},t)a(\boldsymbol{k}_{3},t)\rangle =J(\boldsymbol{k}_{1},\boldsymbol{k}_{2},\boldsymbol{k}_{3},t)\unicode[STIX]{x1D6FF}(\boldsymbol{k}_{1}-\boldsymbol{k}_{2}-\boldsymbol{k}_{3}), & \displaystyle\end{eqnarray}$$
 $$\begin{eqnarray}\displaystyle & \displaystyle \langle a(\boldsymbol{k}_{1},t)a(\boldsymbol{k}_{2},t)a(\boldsymbol{k}_{3},t)\rangle =K(\boldsymbol{k}_{1},\boldsymbol{k}_{2},\boldsymbol{k}_{3},t)\unicode[STIX]{x1D6FF}(\boldsymbol{k}_{1}+\boldsymbol{k}_{2}+\boldsymbol{k}_{3}). & \displaystyle\end{eqnarray}$$
 $n,~J,~K$
, such as
 $n_{1}=n(\boldsymbol{k}_{1},t),~J_{123}=J(\boldsymbol{k}_{1},\boldsymbol{k}_{2},\boldsymbol{k}_{3},t)$
and
 $K_{123}=K(\boldsymbol{k}_{1},\boldsymbol{k}_{2},\boldsymbol{k}_{3},t)$
. Multiplying (4.3) by
 $a_{1^{\prime }}^{\dagger }$
, subtracting its complex conjugate, taking an ensemble average, substituting (4.5), and integrating it with respect to
 $\boldsymbol{k}_{1^{\prime }}$
, we obtain the evolution equation for the second-order correlation function
 $n$
as
 $$\begin{eqnarray}\displaystyle \frac{\unicode[STIX]{x2202}n_{1}}{\unicode[STIX]{x2202}t}=\unicode[STIX]{x1D716}\,\text{Im}\int (V_{123}J_{123}\unicode[STIX]{x1D6FF}_{1-2-3}-2V_{213}J_{213}\unicode[STIX]{x1D6FF}_{2-1-3}-U_{123}K_{123}\unicode[STIX]{x1D6FF}_{1+2+3})\,\text{d}\boldsymbol{k}_{23}. & & \displaystyle\end{eqnarray}$$
To calculate this equation, we need to evaluate the third-order correlation functions
 $J$
and
 $K$
in terms of the second-order correlation function
 $n$
. This closure problem can be solved under the weak nonlinearity condition and the statistical assumptions.
Assuming that the nonlinear parameter
 $\unicode[STIX]{x1D716}$
is small, let us expand the variable
 $a$
as
 $$\begin{eqnarray}a=a^{0}+\unicode[STIX]{x1D716}a^{1}+\cdots \,,\end{eqnarray}$$
where the superscripts denote the order of perturbation. Substituting (4.7) into (4.3) and evaluating the
 $O(1)$
and
 $O(\unicode[STIX]{x1D716})$
terms, respectively, we readily obtain the leading-order solution,
 $$\begin{eqnarray}\displaystyle a^{0}(\boldsymbol{k},t)=a^{0}(\boldsymbol{k},t^{\prime })\text{e}^{-\text{i}\unicode[STIX]{x1D714}(\boldsymbol{k})(t-t^{\prime })}, & & \displaystyle\end{eqnarray}$$
where the ‘initial’ time
 $t^{\prime }$
can be arbitrarily chosen, and the first-order solution,
 $$\begin{eqnarray}\displaystyle a_{1}^{1} & = & \displaystyle -\text{i}\int ^{t}\text{e}^{-\text{i}\unicode[STIX]{x1D714}_{1}(t-t^{\prime })}\int \left(\frac{1}{2}V_{123}a_{2}^{0}(t^{\prime })a_{3}^{0}(t^{\prime })\unicode[STIX]{x1D6FF}_{1-2-3}\right.\nonumber\\ \displaystyle & & \displaystyle \left.+\,V_{213}^{\dagger }a_{2}^{0}(t^{\prime })a_{3}^{0\dagger }(t^{\prime })\unicode[STIX]{x1D6FF}_{2-1-3}+\frac{1}{2}U_{123}^{\dagger }a_{2}^{0\dagger }(t^{\prime })a_{3}^{0\dagger }(t^{\prime })\unicode[STIX]{x1D6FF}_{1+2+3}\right)\text{d}\boldsymbol{k}_{23}\,\text{d}t^{\prime }.\end{eqnarray}$$
Next we employ the statistical assumptions for the different-time correlations of the leading-order variable
 $a^{0}$
. (The assumption used here is referred to as the random phase and amplitude (RPA) field (Nazarenko Reference Nazarenko2011), a generalised version of the classical Gaussian field. Since the phase-modulated wave adopted in this study, such as (2.13), is not Gaussian, RPA is more suitable in the present context.) Although a similar assumption has already been introduced in § 3.2, here we explain it more precisely. Let us separate
 $a^{0}$
into its amplitude and phase:
 $$\begin{eqnarray}\displaystyle a^{0}(\boldsymbol{k},t)=\unicode[STIX]{x1D6FC}(\boldsymbol{k},t)\text{e}^{\text{i}\unicode[STIX]{x1D703}(\boldsymbol{k},t)}. & & \displaystyle\end{eqnarray}$$
Then we regard
 $\unicode[STIX]{x1D6FC}(\boldsymbol{k},t)$
and
 $\unicode[STIX]{x1D703}(\boldsymbol{k},t)$
as statistically independent of all
 $\boldsymbol{k}\in \mathbb{R}^{d}$
with
 $\unicode[STIX]{x1D703}(\boldsymbol{k},t)$
distributed uniformly from
 $0$
to
 $2\unicode[STIX]{x03C0}$
. This assumption makes odd-order correlations trivially zero. Besides, an even-order correlation can become non-zero only if
 $a$
and
 $a^{\dagger }$
appear the same times in it; i.e. if
 $m=2l$
holds in
 $\langle a_{1}^{0}\ldots a_{l}^{0}a_{l+1}^{0\dagger }\ldots a_{m}^{0\dagger }\rangle$
. With use of (4.8), the non-trivial second-order correlation is written as
 $$\begin{eqnarray}\displaystyle \langle a_{1}^{0}(t)a_{2}^{0\dagger }(t^{\prime })\rangle =n_{1}(t^{\prime })\unicode[STIX]{x1D6FF}(\boldsymbol{k}_{1}-\boldsymbol{k}_{2})\text{e}^{-\text{i}\unicode[STIX]{x1D714}_{1}(t-t^{\prime })}. & & \displaystyle\end{eqnarray}$$
The non-trivial fourth-order correlation is evaluated by using the second-order correlations as
 $$\begin{eqnarray}\displaystyle \langle a_{1}^{0}a_{2}^{0}a_{3}^{0\dagger }a_{4}^{0\dagger }\rangle =\langle a_{1}^{0}a_{3}^{0\dagger }\rangle \langle a_{2}^{0}a_{4}^{0\dagger }\rangle +\langle a_{1}^{0}a_{4}^{0\dagger }\rangle \langle a_{2}^{0}a_{3}^{0\dagger }\rangle , & & \displaystyle\end{eqnarray}$$
except for the special case of
 $\boldsymbol{k}_{1}=\boldsymbol{k}_{2}=\boldsymbol{k}_{3}=\boldsymbol{k}_{4}$
, which we neglect since it will not contribute to resonant interaction in dispersive wave systems. We substitute (4.7) together with (4.9) into the left-hand sides of (4.5b
) and (4.5c
), evaluate the correlation terms using (4.11) and (4.12), perform the wavenumber integrations, and omit the delta functions on both sides, to obtain
 $$\begin{eqnarray}\displaystyle & \displaystyle J_{123}=\text{i}\unicode[STIX]{x1D716}\int ^{t}\text{e}^{\text{i}(\unicode[STIX]{x1D714}_{1}-\unicode[STIX]{x1D714}_{2}-\unicode[STIX]{x1D714}_{3})(t-t^{\prime })}V_{123}^{\dagger }(n_{2}(t^{\prime })n_{3}(t^{\prime })-n_{1}(t^{\prime })n_{3}(t^{\prime })-n_{1}(t^{\prime })n_{2}(t^{\prime }))\,\text{d}t^{\prime },\qquad & \displaystyle\end{eqnarray}$$
 $$\begin{eqnarray}\displaystyle & \displaystyle K_{123}=-\frac{\text{i}\unicode[STIX]{x1D716}}{2}\int ^{t}\text{e}^{-\text{i}(\unicode[STIX]{x1D714}_{1}+\unicode[STIX]{x1D714}_{2}+\unicode[STIX]{x1D714}_{3})(t-t^{\prime })}U_{123}^{\dagger }(n_{1}(t^{\prime })n_{2}(t^{\prime })+n_{1}(t^{\prime })n_{3}(t^{\prime })+n_{2}(t^{\prime })n_{3}(t^{\prime }))\,\text{d}t^{\prime }. & \displaystyle \nonumber\\ \displaystyle & & \displaystyle\end{eqnarray}$$
 $J$
and
 $K$
can be evaluated by the second-order correlation
 $n$
, making (4.6) closed in terms of
 $n$
.
If we replace the past value of the second-order correlation
 $n(t^{\prime })$
in (4.13) by its present value
 $n(t)$
, i.e. using the Markovian approximation, and then integrate (4.13) from
 $-\infty$
to
 $t$
, (4.6) reduces to the usual kinetic equation,
 $$\begin{eqnarray}\displaystyle \frac{\unicode[STIX]{x2202}n_{1}}{\unicode[STIX]{x2202}t} & = & \displaystyle \unicode[STIX]{x1D716}^{2}\unicode[STIX]{x03C0}\int \{|V_{123}|^{2}(n_{2}n_{3}-n_{1}n_{3}-n_{1}n_{2})\unicode[STIX]{x1D6FF}(\boldsymbol{k}_{1}-\boldsymbol{k}_{2}-\boldsymbol{k}_{3})\unicode[STIX]{x1D6FF}(\unicode[STIX]{x1D714}_{1}-\unicode[STIX]{x1D714}_{2}-\unicode[STIX]{x1D714}_{3})\nonumber\\ \displaystyle & & \displaystyle -\,2|V_{213}|^{2}(n_{1}n_{3}-n_{1}n_{2}-n_{2}n_{3})\unicode[STIX]{x1D6FF}(\boldsymbol{k}_{2}-\boldsymbol{k}_{1}-\boldsymbol{k}_{3})\unicode[STIX]{x1D6FF}(\unicode[STIX]{x1D714}_{2}-\unicode[STIX]{x1D714}_{1}-\unicode[STIX]{x1D714}_{3})\}\,\text{d}\boldsymbol{k}_{23}.\qquad\end{eqnarray}$$
(Here, we assume that
 $\unicode[STIX]{x1D714}_{1}+\unicode[STIX]{x1D714}_{2}+\unicode[STIX]{x1D714}_{3}$
never becomes equal to zero, so that the terms involving
 $U$
trivially vanish.) However, this procedure is valid only in a steady state. For an unsteady process, especially for the instability problem, the Markovian approximation might not be valid. In such a case, a set of equations (4.6) and (4.13) is a more appropriate statistical model since it takes into account the ‘hysteresis’ of the spectrum.
4.2 Stability analysis
We now analyse the stability of a modulating wave train using the statistical equation, (4.6) and (4.13). To simplify the problem, some presumptions are made:
(i) The action density is decomposed into separable background and infinitesimal disturbance components,
 $n=N_{B}+n^{\prime }$
. The background spectrum
$N_{B}(\boldsymbol{k})$
is idealised as a strict stationary solution of the basic statistical equation, i.e.
$N_{B}(\boldsymbol{k})$
is a solution of the kinetic equation (4.14) with
$\unicode[STIX]{x2202}n/\unicode[STIX]{x2202}t=0$
.
(ii) The background spectrum
$N_{B}(\boldsymbol{k})$
represents a modulating wave train with the carrier wavevector
$\boldsymbol{k}_{B}$
. Therefore,
$N_{B}(\boldsymbol{k})$
vanishes except in the vicinity of a sharp peak at
$\boldsymbol{k}_{B}$
.(iii) The disturbance spectrum
$n^{\prime }(\boldsymbol{k})$
is enhanced through the resonant or near-resonant interactions with the background components. Therefore,
$n^{\prime }(\boldsymbol{k})$
vanishes except in the vicinity of the
$(d-1)$
-dimensional manifold where wavevectors
$\boldsymbol{k}_{1}$
and
$\boldsymbol{k}_{2}$
satisfy the perfect resonance conditions: (4.15)$$\begin{eqnarray}\displaystyle \boldsymbol{k}_{1}+\boldsymbol{k}_{2}-\boldsymbol{k}_{B}=0,\quad \unicode[STIX]{x1D714}(\boldsymbol{k}_{1})+\unicode[STIX]{x1D714}(\boldsymbol{k}_{2})-\unicode[STIX]{x1D714}(\boldsymbol{k}_{B})=0. & & \displaystyle\end{eqnarray}$$
(iv) Terms that do not cause resonance, especially all the terms with the coefficient
$U$
, are ignored.


Consequently, combining (4.6) and (4.13), we can obtain the approximate evolution equation for
 $n^{\prime }$
as
 $$\begin{eqnarray}\displaystyle \frac{\unicode[STIX]{x2202}n^{\prime }(\boldsymbol{k}_{\unicode[STIX]{x1D6FC}},t)}{\unicode[STIX]{x2202}t} & = & \displaystyle 2\unicode[STIX]{x1D716}^{2}\,\text{Re}\int \text{d}\boldsymbol{k}\,\text{d}\boldsymbol{k}_{\unicode[STIX]{x1D6FD}}\,\unicode[STIX]{x1D6FF}(-\boldsymbol{k}_{\unicode[STIX]{x1D6FC}}+\boldsymbol{k}-\boldsymbol{k}_{\unicode[STIX]{x1D6FD}})\nonumber\\ \displaystyle & & \displaystyle \times \int ^{t}\text{d}t^{\prime }\,\{\text{e}^{\text{i}(\unicode[STIX]{x1D714}(\boldsymbol{k}_{\unicode[STIX]{x1D6FC}})-\unicode[STIX]{x1D714}(\boldsymbol{k})+\unicode[STIX]{x1D714}(\boldsymbol{k}_{\unicode[STIX]{x1D6FD}}))(t-t^{\prime })}|V(\boldsymbol{k},\boldsymbol{k}_{\unicode[STIX]{x1D6FC}},\boldsymbol{k}_{\unicode[STIX]{x1D6FD}})|^{2}N_{B}(\boldsymbol{k})n^{\prime }(\boldsymbol{k}_{\unicode[STIX]{x1D6FD}},t^{\prime })\nonumber\\ \displaystyle & & \displaystyle +\,\text{e}^{\text{i}(\unicode[STIX]{x1D714}(\boldsymbol{k}_{\unicode[STIX]{x1D6FC}})-\unicode[STIX]{x1D714}(\boldsymbol{k})+\unicode[STIX]{x1D714}(\boldsymbol{k}_{\unicode[STIX]{x1D6FD}}))(t-t^{\prime })}|V(\boldsymbol{k},\boldsymbol{k}_{\unicode[STIX]{x1D6FC}},\boldsymbol{k}_{\unicode[STIX]{x1D6FD}})|^{2}N_{B}(\boldsymbol{k})n^{\prime }(\boldsymbol{k}_{\unicode[STIX]{x1D6FC}},t^{\prime })\}.\end{eqnarray}$$
Supposing the solution of (4.16) to be an exponential function
 $n^{\prime }=N(\boldsymbol{k})\text{e}^{\unicode[STIX]{x1D706}t}$
, integration of the right-hand side with respect to
 $t^{\prime }$
from
 $-\infty$
to
 $0$
yields a nonlinear eigenvalue problem,
 $$\begin{eqnarray}\displaystyle \unicode[STIX]{x1D706}N(\boldsymbol{k}_{\unicode[STIX]{x1D6FC}}) & = & \displaystyle \unicode[STIX]{x1D716}^{2}\int \text{d}\boldsymbol{k}\,\text{d}\boldsymbol{k}_{\unicode[STIX]{x1D6FD}}\,\unicode[STIX]{x1D6FF}(-\boldsymbol{k}_{\unicode[STIX]{x1D6FC}}+\boldsymbol{k}-\boldsymbol{k}_{\unicode[STIX]{x1D6FD}})\nonumber\\ \displaystyle & & \displaystyle \times \{\unicode[STIX]{x1D6F7}(\unicode[STIX]{x1D714}(\boldsymbol{k}_{\unicode[STIX]{x1D6FC}})-\unicode[STIX]{x1D714}(\boldsymbol{k})+\unicode[STIX]{x1D714}(\boldsymbol{k}_{\unicode[STIX]{x1D6FD}}),\unicode[STIX]{x1D706})|V(\boldsymbol{k},\boldsymbol{k}_{\unicode[STIX]{x1D6FC}},\boldsymbol{k}_{\unicode[STIX]{x1D6FD}})|^{2}N_{B}(\boldsymbol{k})N(\boldsymbol{k}_{\unicode[STIX]{x1D6FD}})\nonumber\\ \displaystyle & & \displaystyle +\,\unicode[STIX]{x1D6F7}(\unicode[STIX]{x1D714}(\boldsymbol{k}_{\unicode[STIX]{x1D6FC}})-\unicode[STIX]{x1D714}(\boldsymbol{k})+\unicode[STIX]{x1D714}(\boldsymbol{k}_{\unicode[STIX]{x1D6FD}}),\unicode[STIX]{x1D706})|V(\boldsymbol{k},\boldsymbol{k}_{\unicode[STIX]{x1D6FC}},\boldsymbol{k}_{\unicode[STIX]{x1D6FD}})|^{2}N_{B}(\boldsymbol{k})N(\boldsymbol{k}_{\unicode[STIX]{x1D6FC}})\},\end{eqnarray}$$
with an associated transfer function,
 $$\begin{eqnarray}\unicode[STIX]{x1D6F7}(\unicode[STIX]{x1D714},\unicode[STIX]{x1D706})\equiv \frac{2\unicode[STIX]{x1D706}}{(\unicode[STIX]{x1D714}^{2}+\unicode[STIX]{x1D706}^{2})}.\end{eqnarray}$$
Equation (4.17) is a kind of self-consistent equation; the ‘renormalised’ transfer function
 $\unicode[STIX]{x1D6F7}$
contains an unknown parameter
 $\unicode[STIX]{x1D706}$
that is to be determined. It is worth noting that, in the limit of
 $\unicode[STIX]{x1D706}\rightarrow 0$
,
 $\unicode[STIX]{x1D6F7}(\unicode[STIX]{x1D714},\unicode[STIX]{x1D706})$
approaches
 $2\unicode[STIX]{x03C0}\unicode[STIX]{x1D6FF}(\unicode[STIX]{x1D714})$
and hence the problem reduces to that obtained from the usual kinetic equation. In the following, we discuss the solution of (4.17) with finite
 $\unicode[STIX]{x1D706}$
using some simplifications.
4.3 One-dimensional case
Although interaction among oceanic internal waves is a three-dimensional process, we make the discussion simpler by first considering a one-dimensional problem
 $(d=1)$
. In this model, both the analytical and numerical solutions for (4.17) are accessible. Attention should be directed to the additional factor from the case in § 3, namely, the shape of the disturbance spectrum
 $N(\boldsymbol{k})$
, which corresponds to the eigenfunction of the unstable mode.
Let us write the solution of the resonant condition (4.15) as
 $k_{1}=k_{1}^{c},~k_{2}=k_{2}^{c}$
and decompose the disturbance spectrum as
 $N(k)=N_{1}(k)+N_{2}(k)$
with
 $N_{1}$
and
 $N_{2}$
concentrated near
 $k_{1}^{c}$
and
 $k_{2}^{c}$
, respectively. We then redefine the wavenumber coordinates as the deviations from
 $k_{B},~k_{1}^{c},~k_{2}^{c}$
, i.e.
 $k=k_{B}+k^{\prime }$
and
 $(k_{\unicode[STIX]{x1D6FC}},k_{\unicode[STIX]{x1D6FD}})=(k_{1}^{c},k_{2}^{c})+(k_{1}^{\prime },k_{2}^{\prime })$
or
 $(k_{\unicode[STIX]{x1D6FC}},k_{\unicode[STIX]{x1D6FD}})=(k_{2}^{c},k_{1}^{c})+(k_{2}^{\prime },k_{1}^{\prime })$
. The first-order truncation of a Taylor expansion in the denominator of the transfer function in (4.17) yields
 $$\begin{eqnarray}\displaystyle \unicode[STIX]{x1D6F7}(\unicode[STIX]{x1D714}(k_{1})+\unicode[STIX]{x1D714}(k_{2})-\unicode[STIX]{x1D714}(k),\unicode[STIX]{x1D706})\sim \frac{2\unicode[STIX]{x1D706}}{((c-c_{1})k^{\prime }+(c_{1}-c_{2})k_{2}^{\prime })^{2}+\unicode[STIX]{x1D706}^{2}} & & \displaystyle\end{eqnarray}$$
 $$\begin{eqnarray}\displaystyle =\frac{2\unicode[STIX]{x1D706}}{((c-c_{2})k^{\prime }+(c_{2}-c_{1})k_{1}^{\prime })^{2}+\unicode[STIX]{x1D706}^{2}}, & & \displaystyle\end{eqnarray}$$
 $k^{\prime }=k_{1}^{\prime }+k_{2}^{\prime }$
is used, and the group velocity
 $c_{g}(k)=\unicode[STIX]{x2202}\unicode[STIX]{x1D714}/\unicode[STIX]{x2202}k$
and the abbreviations
 $c=c_{g}(k_{B}),~c_{1}=c_{g}(k_{1}^{c}),~c_{2}=c_{g}(k_{2}^{c})$
are defined. Since the interaction is restricted in a narrow-band region, it may be natural to approximate the coupling coefficients as a constant value,
 $|V(k,k_{\unicode[STIX]{x1D6FC}},k_{\unicode[STIX]{x1D6FD}})|^{2}\sim |V(k_{B},k_{1}^{c},k_{2}^{c})|^{2}\equiv |V|^{2}$
. Hereinafter, we rewrite the spectrum functions as
 ${\tilde{N}}_{1}(k_{1}^{\prime })\equiv N_{1}(k_{1}^{c}+k_{1}^{\prime }),~{\tilde{N}}_{2}(k_{2}^{\prime })\equiv N_{2}(k_{2}^{c}+k_{2}^{\prime }),~{\tilde{N}}_{B}(k^{\prime })\equiv N_{B}(k_{B}^{c}+k^{\prime })$
.
For (4.17) to be solved, the background spectrum
 ${\tilde{N}}_{B}(k^{\prime })$
requires specification. In fact, several model spectra for a modulating wave train have been suggested in studies for surface waves (Stiassnie, Regev & Agnon Reference Stiassnie, Regev and Agnon2008). In this paper, we choose
 $$\begin{eqnarray}{\tilde{N}}_{B}(k^{\prime })=\frac{2N_{0}\unicode[STIX]{x1D707}_{k}}{k^{\prime 2}+\unicode[STIX]{x1D707}_{k}^{2}},\end{eqnarray}$$
where
 $\unicode[STIX]{x1D707}_{k}$
is the spectrum width in wavenumber space. In § 2, we have derived the frequency spectrum for a modulating sinusoidal function as (2.15), which is the same form as (4.20) when the frequency
 $\unicode[STIX]{x1D714}$
is replaced by the wavenumber
 $k$
. From this fact, one may understand that (4.20) represents the spectrum of a wave train subject to spatial random phase modulation. The eigenvalue equation (4.17) is now explicitly represented as
 $$\begin{eqnarray}\displaystyle \unicode[STIX]{x1D706}{\tilde{N}}_{1}(k_{1}^{\prime }) & = & \displaystyle \unicode[STIX]{x1D716}^{2}|V|^{2}\int \left\{\frac{2\unicode[STIX]{x1D706}}{((c-c_{2})k^{\prime }+(c_{2}-c_{1})k_{1}^{\prime })^{2}+\unicode[STIX]{x1D706}^{2}}\frac{2N_{0}\unicode[STIX]{x1D707}_{k}}{k^{\prime 2}+\unicode[STIX]{x1D707}_{k}^{2}}{\tilde{N}}_{2}(-k_{1}^{\prime }+k^{\prime })\right.\nonumber\\ \displaystyle & & \displaystyle \left.+\,\frac{2\unicode[STIX]{x1D706}}{((c-c_{2})k^{\prime }+(c_{2}-c_{1})k_{1}^{\prime })^{2}+\unicode[STIX]{x1D706}^{2}}\frac{2N_{0}\unicode[STIX]{x1D707}_{k}}{k^{\prime 2}+\unicode[STIX]{x1D707}_{k}^{2}}{\tilde{N}}_{1}(k_{1}^{\prime })\right\}\text{d}k^{\prime },\end{eqnarray}$$
 $$\begin{eqnarray}\displaystyle \unicode[STIX]{x1D706}{\tilde{N}}_{2}(k_{2}^{\prime }) & = & \displaystyle \unicode[STIX]{x1D716}^{2}|V|^{2}\int \left\{\frac{2\unicode[STIX]{x1D706}}{((c-c_{1})k^{\prime }+(c_{1}-c_{2})k_{2}^{\prime })^{2}+\unicode[STIX]{x1D706}^{2}}\frac{2N_{0}\unicode[STIX]{x1D707}_{k}}{k^{\prime 2}+\unicode[STIX]{x1D707}_{k}^{2}}{\tilde{N}}_{1}(-k_{2}^{\prime }+k^{\prime })\right.\nonumber\\ \displaystyle & & \displaystyle \left.+\,\frac{2\unicode[STIX]{x1D706}}{((c-c_{1})k^{\prime }+(c_{1}-c_{2})k_{2}^{\prime })^{2}+\unicode[STIX]{x1D706}^{2}}\frac{2N_{0}\unicode[STIX]{x1D707}_{k}}{k^{\prime 2}+\unicode[STIX]{x1D707}_{k}^{2}}{\tilde{N}}_{2}(k_{2}^{\prime })\right\}\,\text{d}k^{\prime }.\end{eqnarray}$$
 ${\tilde{N}}_{1,2}$
to be determined along with
 $\unicode[STIX]{x1D706}$
.
Let us tentatively set the disturbance spectra
 ${\tilde{N}}_{1,2}$
in the integrands to be constant, to reduce the equations to
 $$\begin{eqnarray}\displaystyle & \displaystyle \unicode[STIX]{x1D706}{\tilde{N}}_{1}=\frac{4\unicode[STIX]{x03C0}\unicode[STIX]{x1D716}^{2}|V|^{2}N_{0}}{|c-c_{2}|\unicode[STIX]{x1D707}_{k}+\unicode[STIX]{x1D706}}{\tilde{N}}_{2}+\frac{4\unicode[STIX]{x03C0}\unicode[STIX]{x1D716}^{2}|V|^{2}N_{0}}{|c-c_{2}|\unicode[STIX]{x1D707}_{k}+\unicode[STIX]{x1D706}}{\tilde{N}}_{1}, & \displaystyle\end{eqnarray}$$
 $$\begin{eqnarray}\displaystyle & \displaystyle \unicode[STIX]{x1D706}{\tilde{N}}_{2}=\frac{4\unicode[STIX]{x03C0}\unicode[STIX]{x1D716}^{2}|V|^{2}N_{0}}{|c-c_{1}|\unicode[STIX]{x1D707}_{k}+\unicode[STIX]{x1D706}}{\tilde{N}}_{1}+\frac{4\unicode[STIX]{x03C0}\unicode[STIX]{x1D716}^{2}|V|^{2}N_{0}}{|c-c_{1}|\unicode[STIX]{x1D707}_{k}+\unicode[STIX]{x1D706}}{\tilde{N}}_{2}. & \displaystyle\end{eqnarray}$$
 $|c|\gg |c_{1}|,|c_{2}|$
, which is generally valid for large-scale background waves and small-scale disturbance waves in the ocean, further reduces (4.22) to a simple quadratic equation for
 $\unicode[STIX]{x1D706}$
. The growth rate can then be written in the same form as (3.21), namely,
 $$\begin{eqnarray}\unicode[STIX]{x1D706}=\frac{-\unicode[STIX]{x1D707}+\sqrt{\unicode[STIX]{x1D707}^{2}+4CE_{B}}}{2},\end{eqnarray}$$
where parameters are rearranged as
 $$\begin{eqnarray}\unicode[STIX]{x1D707}\equiv |c|\unicode[STIX]{x1D707}_{k}=\left|\frac{\unicode[STIX]{x2202}\unicode[STIX]{x1D714}}{\unicode[STIX]{x2202}k}\right|_{k_{B}}\unicode[STIX]{x1D707}_{k},\quad C\equiv \frac{8\unicode[STIX]{x03C0}\unicode[STIX]{x1D716}^{2}|V|^{2}}{\unicode[STIX]{x1D714}(k_{B})},\quad E_{B}\equiv \unicode[STIX]{x1D714}(k_{B})N_{0}.\end{eqnarray}$$
Recalling that
 $\unicode[STIX]{x1D707}_{k}$
represents the spectrum width of the background wave in wavenumber space,
 $\unicode[STIX]{x1D707}$
corresponds to the spectrum width in frequency space in the same way as the zero-dimensional case (§ 2). The parameter
 $E_{B}$
represents the energy density of the background wave. We again emphasise that the solution (4.23) possesses two asymptotic forms: the dynamic limit
 $\unicode[STIX]{x1D706}\sim \sqrt{CE_{B}}$
for
 $\unicode[STIX]{x1D707}\ll \sqrt{CE_{B}}$
and the kinetic limit
 $\unicode[STIX]{x1D706}\sim CE_{B}/\unicode[STIX]{x1D707}$
for
 $\unicode[STIX]{x1D707}\gg \sqrt{CE_{B}}$
. In this way, the two classical approaches are unified.
Figure 5(a) plots the analytical expression (4.23) and the direct numerical solutions of eigenvalue equations (4.21). See appendix D for the details of the numerical solver of the eigenproblem. Despite the assumption that the disturbance spectra are taken to be constant, the analytical expression coincides well with the numerical solution. This favourable result can be attributed to the following.
Numerical and approximate analytical solutions to the eigenvalue equations (4.21). (a) Solutions of growth rates versus the background action density
 $N_{0}$
with the group velocity of the background wave chosen as
 $c=3.0,5.0,8.0$
. Numerically obtained results are plotted as scatterplots, whereas the analytical expression (4.23) is depicted as curves. (b–d) Spectrum shapes of the eigenfunctions
 ${\tilde{N}}_{1}$
that represent the disturbance spectra, in comparison with the background wave spectrum
 ${\tilde{N}}_{B}$
and the transfer functions
 $\unicode[STIX]{x1D6F7}$
. Each function is normalised such that it becomes
 $1.0$
at
 $k^{\prime }=0$
. Three cases
 $(c=5.0,N_{0}=0.01)$
,
 $(c=5.0,N_{0}=0.16)$
and
 $(c=8.0,N_{0}=0.1)$
are shown. See appendix D for the details of the calculation.

Generally speaking, the integrands on the right-hand side of (4.21) possess innumerable singular points in the complex plane of
 $k^{\prime }$
. Each singular point contributes to the total integral through the residue theorem. The relative contribution of each depends on the functional form. In the present case, since all the integrands are real and finite, singular points always occur as a set of conjugate numbers. Therefore, the integrands may be separated into the factors of
 $1/((k^{\prime }-\unicode[STIX]{x1D6FC})^{2}+\unicode[STIX]{x1D6FD}^{2})$
, the residue of which is proportional to
 $\unicode[STIX]{x1D6FD}^{-1}$
. This means that the relative contribution from each singular point strongly depends on its imaginary part, or the bandwidth of the factor. As the bandwidth
 $\unicode[STIX]{x1D6FD}$
becomes smaller, the contribution from its associated singular point becomes more significant. With this in mind, we again consider the equations (4.21). The integrands involve three factors: the transfer function
 $\unicode[STIX]{x1D6F7}$
, the background energy spectrum
 ${\tilde{N}}_{B}$
and the disturbance spectrum
 ${\tilde{N}}_{1,2}$
. To see the relative bandwidths of these, figure 5(b–d) shows the numerically obtained eigenfunctions
 ${\tilde{N}}_{1}(k_{1}^{\prime })$
with
 $\unicode[STIX]{x1D6F7}$
and
 ${\tilde{N}}_{B}$
for three cases. The bandwidth of the disturbance spectrum
 ${\tilde{N}}_{1}$
never becomes smallest among those of the three functions. Therefore, at least in these examples, the contribution to the integration from the singular points in
 ${\tilde{N}}_{1}$
is minor. Hence, the disturbance spectrum can be regarded as constant in the integration, making the analytical solution (4.23) a good approximation of the true solution of (4.21).
Taking further estimates, supposing
 $|c|\gg |c_{1}|,|c_{2}|$
, integration on the right-hand side of (4.21) with
 $N_{1,2}$
in the integrands taken as constants yields
 $$\begin{eqnarray}\unicode[STIX]{x1D706}{\tilde{N}}_{1,2}\sim \frac{8\unicode[STIX]{x03C0}\unicode[STIX]{x1D716}^{2}|V|^{2}N_{0}(|c|\unicode[STIX]{x1D707}_{k}+\unicode[STIX]{x1D706})}{(|c|\unicode[STIX]{x1D707}_{k}+\unicode[STIX]{x1D706})^{2}+(c_{1}-c_{2})^{2}k_{1,2}^{\prime 2}},\end{eqnarray}$$
which shows that the half-value width of the disturbance spectrum is approximately equal to
 $(|c|\unicode[STIX]{x1D707}_{k}+\unicode[STIX]{x1D706})/|c_{1}-c_{2}|\equiv \unicode[STIX]{x1D6FD}_{D}$
. Again taking into account
 $|c|\gg |c_{1}|,|c_{2}|$
, along with the fact that the bandwidths of
 $\unicode[STIX]{x1D6F7}$
and
 $\tilde{B}_{B}$
are, respectively,
 $\unicode[STIX]{x1D706}/|c|\equiv \unicode[STIX]{x1D6FD}_{T}$
and
 $\unicode[STIX]{x1D707}_{k}\equiv \unicode[STIX]{x1D6FD}_{B}$
, we find that
 $\unicode[STIX]{x1D6FD}_{D}$
is always larger than
 $\unicode[STIX]{x1D6FD}_{T}$
or
 $\unicode[STIX]{x1D6FD}_{B}$
. Consequently, the disturbance spectrum
 $N_{1,2}$
can be regarded as constant in the integration, which is self-consistent with the derivation of (4.25).
The considerations above can be reinterpreted from a physical point of view. When the background spectrum
 $N_{B}$
has a sharp peak at some wavenumber, the resonant interaction specified by the transfer function
 $\unicode[STIX]{x1D6F7}$
produces peaks in the disturbance spectrum
 $N$
, as well. However, if the group velocity of disturbances is much slower than that of the background wave, the spectrum width of
 $N$
does not become as narrow as
 $N_{B}$
and
 $\unicode[STIX]{x1D6F7}$
. Therefore
 $N$
can be taken to be constant in the integration.
We additionally consider the relative contributions from the singular points in the transfer function
 $\unicode[STIX]{x1D6F7}$
and the background spectrum
 ${\tilde{N}}_{B}$
, which are determined from the relative magnitudes of
 $\unicode[STIX]{x1D6FD}_{T}$
and
 $\unicode[STIX]{x1D6FD}_{B}$
. If
 $\unicode[STIX]{x1D6FD}_{T}\gg \unicode[STIX]{x1D6FD}_{B}$
holds, the singular point in
 ${\tilde{N}}_{B}$
dominates the integration; and if
 $\unicode[STIX]{x1D6FD}_{T}\ll \unicode[STIX]{x1D6FD}_{B}$
, on the other hand, the singular point in
 $\unicode[STIX]{x1D6F7}$
becomes dominant. These respectively correspond to the cases discussed in § 2; we name the situation when the spectrum width of
 $K(\unicode[STIX]{x1D714},t)$
is much larger than that of
 $S(\unicode[STIX]{x1D714})$
in (2.6) the dynamic time range and its opposite the kinetic time range. The present situations,
 $\unicode[STIX]{x1D6FD}_{T}\gg \unicode[STIX]{x1D6FD}_{B}$
and
 $\unicode[STIX]{x1D6FD}_{T}\ll \unicode[STIX]{x1D6FD}_{B}$
, can be similarly called the ‘dynamic’ and ‘kinetic’ ranges of PSI, respectively.
4.4 Three-dimensional case
For oceanographic applications, we should discuss the three-dimensional case, analysing the eigenvalue equation (4.17) with
 $d=3$
. This problem is so complicated that a significant effort is required to solve it for both
 $N$
and
 $\unicode[STIX]{x1D706}$
even numerically. Nonetheless, also in this problem, imposing the assumptions on the group velocities and the spectrum widths, we retain the main result in the one-dimensional case, namely solution (4.23). Relegating the rigorous derivation of it to appendix E, let us proceed to the numerical experiments in the next section.
5 Numerical experiments
In § 4, the growth rate of PSI is obtained by solving the eigenvalue problem (4.17) both analytically and numerically, but (4.17) is itself derived under several assumptions. The most crucial one is the statistical assumptions as described in (4.10) to (4.12). To assess the validity of the analytical result, we should conduct direct numerical experiments excluding these assumptions. However, direct calculation for the oceanic internal wave field, such as conducted by Lvov & Yokoyama (Reference Lvov and Yokoyama2009), is too hard due to the following reasons. In general, numerical simulation of an interacting wave field requires careful treatment. While the theoretical consideration so far is aimed at continuous wave spectra, numerical computation requires discretisation of wavevector space, the interval of which is determined by the size of the model domain
 $L$
. Over the time scale of
 $\unicode[STIX]{x1D70F}=L/|\unicode[STIX]{x1D735}\unicode[STIX]{x1D714}|$
, which represents the time for wave packets to cross over the domain, resonant interaction is subject to the finite size effect (Nazarenko Reference Nazarenko2011). Since
 $\unicode[STIX]{x1D70F}$
should be much longer than the interaction time of PSI, a sufficiently large model size is required. Another problem is that, to discuss statistical properties of the system, numerous trials for the same situation are needed. To avoid the massive computation, we adopt a very simplified model here.
The motivation of this study originates from the speculation that parametric instability within the oceanic internal tides might be impeded by the phase modulation occurring due to geostrophic eddies. Therefore, the model should inherit the characters of the interaction between modulated internal tides and enhanced disturbances. Based on the understanding that internal tides form a progressive wave train exciting a pair of disturbance waves with opposite wavenumbers (Young et al. Reference Young, Tsang and Balmforth2008), the suitable model is the one that mimics a one-way propagating background wave and bi-directional unstable disturbances. Additionally, we may well consider the following prescriptions: (i) dispersion is not important as long as the group velocity of the background wave is much larger than that of disturbance components, (ii) amplitudes of disturbances are so small that the feedback to the background wave is negligible, and (iii) interaction is expressed through the fluctuation of the coefficient parameter of the governing equation of disturbance components. Note that (i) comes from the consideration in the previous section and, for (iii), phase velocity should be a suitable coefficient parameter for a non-dispersive wave equation. Finally, we come up with basic model equations as
 $$\begin{eqnarray}\displaystyle & \displaystyle \frac{\unicode[STIX]{x2202}^{2}u}{\unicode[STIX]{x2202}t^{2}}-\frac{\unicode[STIX]{x2202}}{\unicode[STIX]{x2202}x}(1+\unicode[STIX]{x1D716}U)\frac{\unicode[STIX]{x2202}u}{\unicode[STIX]{x2202}x}=0, & \displaystyle\end{eqnarray}$$
 $$\begin{eqnarray}\displaystyle & \displaystyle \frac{\unicode[STIX]{x2202}U}{\unicode[STIX]{x2202}t}+c\frac{\unicode[STIX]{x2202}U}{\unicode[STIX]{x2202}x}=0, & \displaystyle\end{eqnarray}$$
 $U$
stands for the internal tide wave train and
 $u$
the disturbance components amplified through the interaction with
 $U$
. Parameter
 $c$
represents the phase speed of the internal tides and should be larger than that of the disturbance components, namely, unity. On the other hand, the coupling parameter
 $\unicode[STIX]{x1D716}$
should be sufficiently smaller than unity. The initial condition of the background component
 $U$
is
 $$\begin{eqnarray}U(x,t=0)=\sqrt{2}\sin (k_{B}x+\sqrt{2\unicode[STIX]{x1D707}_{k}}W_{x}+\unicode[STIX]{x1D703}),\end{eqnarray}$$
where
 $W_{x}$
is the Wiener process and
 $\unicode[STIX]{x1D703}$
is a uniform random number ranging from
 $0$
to
 $2\unicode[STIX]{x03C0}$
. Definitions of the carrier wavenumber
 $k_{B}$
and the spectrum width
 $\unicode[STIX]{x1D707}_{k}$
follow those in § 4. Equations (5.1) along with (5.2) meet all the requirements for the present study. In the following, taking the Fourier transform, we will solve (5.1) numerically in the wavenumber domain.
Assuming periodic boundary conditions of length
 $L$
, we determine the interval in the wavenumber domain as
 $\unicode[STIX]{x0394}k=2\unicode[STIX]{x03C0}/L$
. To simplify the problem, we exclude the homogeneous component in advance:
 $\int u\,\text{d}x=0$
. Accordingly, the set of wavenumbers is specified as
 $$\begin{eqnarray}\mathbb{K}\equiv \left\{\pm \unicode[STIX]{x0394}k,\pm 2\unicode[STIX]{x0394}k,\ldots \right\}.\end{eqnarray}$$
The Fourier series expansion is applied:
 $$\begin{eqnarray}u=\mathop{\sum }_{k\in \mathbb{K}}\tilde{u} (k)\text{e}^{\text{i}kx},\quad U=\mathop{\sum }_{k\in \mathbb{K}}\tilde{U} (k)\text{e}^{\text{i}kx}.\end{eqnarray}$$
We then introduce a new variable
 $a$
defined as
 $$\begin{eqnarray}a(k)=\frac{1}{\sqrt{2|k|}}\left(\frac{\text{d}\tilde{u} (k)}{\text{d}t}+\text{i}|k|\tilde{u} (k)\right).\end{eqnarray}$$
The equations of motion (5.1) are consequently transformed into
 $$\begin{eqnarray}\displaystyle \text{i}\frac{\text{d}a(k)}{\text{d}t} & = & \displaystyle |k|a(k)+\unicode[STIX]{x1D716}\mathop{\sum }_{k^{\prime }\in \mathbb{K}}\left[\frac{k(k-k^{\prime })}{2\sqrt{|k(k-k^{\prime })|}}\tilde{U} (k^{\prime })a(k-k^{\prime })\right.\nonumber\\ \displaystyle & & \displaystyle \left.+\,\frac{k(k-k^{\prime })}{2\sqrt{|k(k-k^{\prime })|}}\tilde{U} (k^{\prime })a^{\dagger }(k^{\prime }-k)\right],\end{eqnarray}$$
 $$\begin{eqnarray}\displaystyle \text{i}\frac{\text{d}\tilde{U} (k)}{\text{d}t}=ck\tilde{U} (k). & & \displaystyle\end{eqnarray}$$
The following resonant conditions determine wavenumbers
 $k_{1}^{c}$
and
 $k_{2}^{c}$
which most intensively interact with each other:
 $$\begin{eqnarray}k_{1}^{c}+k_{2}^{c}-k_{B}=0,\quad |k_{1}^{c}|+|k_{2}^{c}|-ck_{B}=0.\end{eqnarray}$$
Without loss of generality,
 $k_{1}^{c}>0$
and
 $k_{2}^{c}<0$
can be assumed. Different from usual spectral models in which grids are homogeneously distributed in the wavenumber domain, calculation points are chosen to be concentrated near
 $k_{B},~k_{1}^{c},~k_{2}^{c}$
in the present study. Specifically, three sets of wavenumbers are arranged as
 $$\begin{eqnarray}\displaystyle & \displaystyle \mathbb{K}^{\prime }=\{k_{B},k_{B}\pm \unicode[STIX]{x0394}k,\ldots ,k_{B}\pm (n-1)\unicode[STIX]{x0394}k/2\}, & \displaystyle\end{eqnarray}$$
 $$\begin{eqnarray}\displaystyle & \displaystyle \mathbb{K}_{1}^{\prime }=\{k_{1}^{c},k_{1}^{c}\pm \unicode[STIX]{x0394}k,\ldots ,k_{1}^{c}\pm (n-1)\unicode[STIX]{x0394}k/2\}, & \displaystyle\end{eqnarray}$$
 $$\begin{eqnarray}\displaystyle & \displaystyle \mathbb{K}_{2}^{\prime }=\{k_{2}^{c},k_{2}^{c}\pm \unicode[STIX]{x0394}k,\ldots ,k_{2}^{c}\pm (n-1)\unicode[STIX]{x0394}k/2\}, & \displaystyle\end{eqnarray}$$
 $\mathbb{K}^{\prime },~\mathbb{K}_{1}^{\prime },~\mathbb{K}_{2}^{\prime }$
are taken into consideration. Solving (5.6a
) using the fourth-order Runge–Kutta method, we simulate the time evolution of
 $a(k)$
from initial white noise. Detailed settings and parameters are listed in table 1.
Parameters for numerical experiments.

Examples of the time series of the average energy density obtained in the numerical experiments for the model equation (5.1). All of the data are normalised such that
 $E=1$
is satisfied at
 $t=0$
. The spectrum width of the background wave varies in
 $\unicode[STIX]{x1D707}_{k}=0.0,0.01,0.02,\ldots ,0.1$
with a fixed amplitude
 $\unicode[STIX]{x1D716}=0.05$
. The energy growth rate decreases monotonically as
 $\unicode[STIX]{x1D707}_{k}$
increases.

Growth rates of the expectation value of energy density
 $E$
for the model equation (5.1) versus (a) the amplitude of the background wave
 $\unicode[STIX]{x1D716}$
with a fixed spectrum width
 $\unicode[STIX]{x1D707}_{k}=0.02$
and (b)
 $\unicode[STIX]{x1D707}_{k}$
with a fixed
 $\unicode[STIX]{x1D716}=0.05$
. Grey squares are empirical values obtained from numerical experiments. Solid black curves show
 $\unicode[STIX]{x1D706}=(-5.0\unicode[STIX]{x1D707}_{k}+\sqrt{(5.0\unicode[STIX]{x1D707}_{k})^{2}+1.732\unicode[STIX]{x1D716}^{2}})/2$
, which corresponds to (4.23), whereas broken curves correspond to the two asymptotic limits.

Examples of the time series of average energy density
 $E=\langle \sum _{k}|k|\,|a(k)|^{2}\rangle$
are shown in figure 6. It is clear that, after a sufficiently long time, the energy expectation value grows exponentially. Linear fitting of
 $\log E$
versus
 $t$
gives an empirical growth rate
 $\unicode[STIX]{x1D706}$
. The parameter dependence of
 $\unicode[STIX]{x1D706}$
is compared with the theoretical estimates in figure 7. The unified expression (4.23), denoted as the solid black curves, seems to agree well with the numerical results, the grey squares. We also point out that, when the spectrum width
 $\unicode[STIX]{x1D707}_{k}$
takes a halfway value between the dynamic and kinetic ranges, both the asymptotic expressions, the broken curves, overestimate the growth rates. Our unified theory is useful to investigate the effect of weak modulation of the background wave.
The results in figure 7(b) provide further insights. Let us define the intercept of the analytical solution on the vertical axis as
 $\unicode[STIX]{x1D706}_{0}$
to rewrite (4.23) as
 $$\begin{eqnarray}\unicode[STIX]{x1D706}=\frac{-\unicode[STIX]{x1D707}+\sqrt{\unicode[STIX]{x1D707}^{2}+4\unicode[STIX]{x1D706}_{0}^{2}}}{2}.\end{eqnarray}$$
It is noticeable that the coupling coefficient
 $C$
involved in the original formula (4.23), which is generally hard to get, now disappears and
 $\unicode[STIX]{x1D706}_{0}$
appears instead, which represents the growth rate in the case of
 $\unicode[STIX]{x1D707}=0$
. This is an advantage since, without conducting experiments for random wave fields as in the present simulation, we can discuss quantitatively the effect of phase modulation on PSI combining the single experimental result,
 $\unicode[STIX]{x1D706}_{0}$
, with the information about the bandwidth,
 $\unicode[STIX]{x1D707}$
. As discussed at the beginning of § 1, the previous experimental studies have deterministically estimated the growth rate of PSI. Equation (5.9) serves as the correction formula to give the actual growth rate of PSI from the conventional estimate,
 $\unicode[STIX]{x1D706}_{0}$
, with the spectrum information of internal tides,
 $\unicode[STIX]{x1D707}$
, in the real ocean.
6 Concluding remarks
Previous studies of parametric subharmonic instability can be classified into two types that are concerned with the dynamic and kinetic time scales, which have been carried out using, say, deterministic and statistical theories, respectively. The applicability of the two theories depends on the spectrum width of the background waves. The deterministic theory is applicable only to systems with discrete line spectra. The classical statistical theory described by the kinetic equation works well if the bandwidth of the frequency spectrum is sufficiently broad. Our new solution (4.23), obtained by solving the nonlinear eigenvalue equation (4.17), unifies these past two results and is valid even for the case of a slowly modulating wave train.
In this paper, we have also investigated the theoretical foundation of the general wave–wave interactions. In the study of oceanic internal waves, the validity of the kinetic equation has been questioned in terms of its two underlying assumptions: the weak nonlinearity (Holloway Reference Holloway1980) and the random phase property (Young et al.
Reference Young, Tsang and Balmforth2008). The present study offers another viewpoint to this problem; that is, even though the weak nonlinearity and the random phase assumption are both employed in our formulation, the result still involves the rapid instability occurring at the dynamic time scale
 $t\sim O(\unicode[STIX]{x1D716}^{-1})$
, which cannot be seen in the classical kinetic equation. We further point out that the additional Markovian approximation is the crucial premise for the derivation of the kinetic equation, which may break down when applied to an unsteady process. From this perspective, formulations (4.6) and (4.13), which do not involve the Markovian approximation, serve as extensions of the classical kinetic equation.
Again, looking at (4.23) and figure 7, we notice that as the dimensionless number
 $\unicode[STIX]{x1D6FF}\equiv (CE_{B})^{1/2}/\unicode[STIX]{x1D707}$
decreases, the growth rate deviates from that observed in standard deterministic (or dynamic) theory. This parameter
 $\unicode[STIX]{x1D6FF}$
corresponds to the so-called Benjamin–Feir index (BFI) for water surface waves (Janssen Reference Janssen2003). As for Benjamin–Feir instability in four-wave systems, BFI has a threshold value below which instability does not occur. On the other hand, in three-wave systems, as long as the resonant conditions are satisfied, instability will always occur, but its properties vary continuously from dynamic to kinetic types as
 $\unicode[STIX]{x1D6FF}$
decreases. On this point, the effect of phase modulation on the resonant instability is essentially different between surface and internal waves. In the study of the four-wave interactions among surface gravity waves, a statistical model corresponding to (4.6) and (4.13) has recently been referred to as the generalised kinetic equation (gKE) and applied to the non-stationary spectra in response to wind forcing (Annenkov & Shrira Reference Annenkov and Shrira2006, Reference Annenkov and Shrira2015, Reference Annenkov and Shrira2018). However, the applicability of gKE to the Benjamin–Feir instability is yet to be discussed. To deepen understanding of the statistics of resonant interaction systems, thorough comparison between the instabilities of surface and internal waves is required.
Based on the results of this study, we suggest a proposal that, towards the quantification of PSI in the ocean, we need to take into account not only the amplitude or the wavenumber of a wave train but also its spectrum shape. It is expected that, utilising time-series data obtained from long-term mooring systems, spectrum width
 $\unicode[STIX]{x1D707}$
will be estimated empirically and applied to the formula (4.23) or (5.9). There remains a lot of work to do for the detailed clarification of PSI in the global ocean.
Acknowledgements
This study was supported by JSPS KAKENHI Grants JP18H04918 and JP15H05824. This paper forms part of the first author’s doctoral dissertation at the University of Tokyo completed in 2017.
Appendix A. Autocorrelation of the modulated sinusoidal function
The autocorrelation function of (2.13) is written as
 $$\begin{eqnarray}\displaystyle \langle \,f(t+\unicode[STIX]{x1D70F})f(t)\rangle & = & \displaystyle \left\langle \cos (\unicode[STIX]{x1D70F}+\sqrt{2\unicode[STIX]{x1D707}}(W_{\unicode[STIX]{x1D70F}+t}-W_{t}))\right\rangle \nonumber\\ \displaystyle & & \displaystyle -\,\left\langle \cos (2t+\unicode[STIX]{x1D70F}+\sqrt{2\unicode[STIX]{x1D707}}(W_{\unicode[STIX]{x1D70F}+t}+W_{t})+\unicode[STIX]{x1D703})\right\rangle .\end{eqnarray}$$
Given that
 $\unicode[STIX]{x1D703}$
is a uniform random number, the last term identically vanishes. We shall write
 $W_{\unicode[STIX]{x1D70F}+t}-W_{t}\equiv W_{\unicode[STIX]{x1D70F}}$
, whose moments depend only on the lag time
 $\unicode[STIX]{x1D70F}$
. The basic property of the Wiener process yields
 $$\begin{eqnarray}\displaystyle \left\langle \exp (\text{i}(\unicode[STIX]{x1D70F}+\sqrt{2\unicode[STIX]{x1D707}}W_{\unicode[STIX]{x1D70F}}))\right\rangle & = & \displaystyle \exp (\text{i}\unicode[STIX]{x1D70F})\left\langle \exp (\text{i}\sqrt{2\unicode[STIX]{x1D707}}W_{\unicode[STIX]{x1D70F}})\right\rangle \nonumber\\ \displaystyle & = & \displaystyle \exp (\text{i}\unicode[STIX]{x1D70F})\mathop{\sum }_{n=0}^{\infty }\frac{\left\langle (\text{i}\sqrt{2\unicode[STIX]{x1D707}}W_{\unicode[STIX]{x1D70F}})^{n}\right\rangle }{n!}\nonumber\\ \displaystyle & = & \displaystyle \exp (\text{i}\unicode[STIX]{x1D70F})\mathop{\sum }_{n=0}^{\infty }\frac{(-2\unicode[STIX]{x1D707}|\unicode[STIX]{x1D70F}|)^{n}\cdot 1\cdot 3\cdots (2n-1)}{(2n)!}\nonumber\\ \displaystyle & = & \displaystyle \exp (\text{i}\unicode[STIX]{x1D70F})\mathop{\sum }_{n=0}^{\infty }\frac{(-\unicode[STIX]{x1D707}|\unicode[STIX]{x1D70F}|)^{n}}{n!}\nonumber\\ \displaystyle & = & \displaystyle \exp (\text{i}\unicode[STIX]{x1D70F}-\unicode[STIX]{x1D707}|\unicode[STIX]{x1D70F}|).\end{eqnarray}$$
Appendix B. Approximate solution of the Mathieu equation
Let us consider the Mathieu equation:
 $$\begin{eqnarray}\frac{\text{d}^{2}x}{\text{d}t^{2}}+(1+\sqrt{2}\unicode[STIX]{x1D716}\sin ((2+\unicode[STIX]{x1D702})t+\unicode[STIX]{x1D703}))x=0,\end{eqnarray}$$
with the associated initial conditions
 $x(0)=0,~{\dot{x}}(0)=a$
. If
 $\unicode[STIX]{x1D716}$
and
 $\unicode[STIX]{x1D702}$
are small, following Landau & Lifshitz (Reference Landau and Lifshitz1976), we may assume an approximate solution of (B 1) as
 $$\begin{eqnarray}x=u\sin \left(\left(1+\frac{\unicode[STIX]{x1D702}}{2}\right)t+\frac{\unicode[STIX]{x1D703}}{2}\right)+v\cos \left(\left(1+\frac{\unicode[STIX]{x1D702}}{2}\right)t+\frac{\unicode[STIX]{x1D703}}{2}\right),\end{eqnarray}$$
where
 $u$
and
 $v$
are slow functions of
 $t$
such that
 $\dot{u}$
and
 $\dot{v}$
are regarded as sufficiently small. Therefore, the derivative of
 $x$
is approximately
 $$\begin{eqnarray}{\dot{x}}\sim u\cos \left(\left(1+\frac{\unicode[STIX]{x1D702}}{2}\right)t+\frac{\unicode[STIX]{x1D703}}{2}\right)-v\sin \left(\left(1+\frac{\unicode[STIX]{x1D702}}{2}\right)t+\frac{\unicode[STIX]{x1D703}}{2}\right).\end{eqnarray}$$
From these expressions, the initial conditions are represented as
 $u(0)=a\cos (\unicode[STIX]{x1D703}/2)$
and
 $v(0)=-a\sin (\unicode[STIX]{x1D703}/2)$
.
We now consider the variation in
 $u$
and
 $v$
. Substituting (B 2) into (B 1) and ignoring the second derivatives of
 $u$
and
 $v$
and higher-order harmonic terms yields
 $$\begin{eqnarray}\displaystyle & \displaystyle 2\frac{\text{d}u}{\text{d}t}-\unicode[STIX]{x1D702}v+\frac{\sqrt{2}\unicode[STIX]{x1D716}}{2}u=0, & \displaystyle\end{eqnarray}$$
 $$\begin{eqnarray}\displaystyle & \displaystyle -2\frac{\text{d}v}{\text{d}t}-\unicode[STIX]{x1D702}u+\frac{\sqrt{2}\unicode[STIX]{x1D716}}{2}v=0. & \displaystyle\end{eqnarray}$$
 $$\begin{eqnarray}\pm \unicode[STIX]{x1D706}_{a}\equiv \pm \frac{1}{2}\left(\frac{\unicode[STIX]{x1D716}^{2}}{2}-\unicode[STIX]{x1D702}^{2}\right)^{1/2}.\end{eqnarray}$$
Let us now assume
 $\unicode[STIX]{x1D716}^{2}/4-\unicode[STIX]{x1D702}^{2}>0$
so that
 $\unicode[STIX]{x1D706}_{a}$
takes a positive real value. Taking into account the initial conditions, the solutions of (B 4) become
 $u=u_{+}\text{e}^{\unicode[STIX]{x1D706}_{a}t}+u_{-}\text{e}^{-\unicode[STIX]{x1D706}_{a}t}$
and
 $v=v_{+}\text{e}^{\unicode[STIX]{x1D706}_{a}t}+v_{-}\text{e}^{-\unicode[STIX]{x1D706}_{a}t}$
, where
 $$\begin{eqnarray}\displaystyle & \displaystyle u_{+}=\left(\frac{a}{2}-\frac{\sqrt{2}\unicode[STIX]{x1D716}a}{8\unicode[STIX]{x1D706}_{a}}\right)\cos \frac{\unicode[STIX]{x1D703}}{2}-\frac{\unicode[STIX]{x1D702}a}{4\unicode[STIX]{x1D706}_{a}}\sin \frac{\unicode[STIX]{x1D703}}{2}, & \displaystyle\end{eqnarray}$$
 $$\begin{eqnarray}\displaystyle & \displaystyle u_{-}=\left(\frac{a}{2}+\frac{\sqrt{2}\unicode[STIX]{x1D716}a}{8\unicode[STIX]{x1D706}_{a}}\right)\cos \frac{\unicode[STIX]{x1D703}}{2}+\frac{\unicode[STIX]{x1D702}a}{4\unicode[STIX]{x1D706}_{a}}\sin \frac{\unicode[STIX]{x1D703}}{2}, & \displaystyle\end{eqnarray}$$
 $$\begin{eqnarray}\displaystyle & \displaystyle v_{+}=-\frac{\unicode[STIX]{x1D702}a}{4\unicode[STIX]{x1D706}_{a}}\cos \frac{\unicode[STIX]{x1D703}}{2}-\left(\frac{a}{2}+\frac{\sqrt{2}\unicode[STIX]{x1D716}a}{8\unicode[STIX]{x1D706}_{a}}\right)\sin \frac{\unicode[STIX]{x1D703}}{2}, & \displaystyle\end{eqnarray}$$
 $$\begin{eqnarray}\displaystyle & \displaystyle v_{-}=\frac{\unicode[STIX]{x1D702}a}{4\unicode[STIX]{x1D706}_{a}}\cos \frac{\unicode[STIX]{x1D703}}{2}-\left(\frac{a}{2}-\frac{\sqrt{2}\unicode[STIX]{x1D716}a}{8\unicode[STIX]{x1D706}_{a}}\right)\sin \frac{\unicode[STIX]{x1D703}}{2}. & \displaystyle\end{eqnarray}$$
 $\unicode[STIX]{x1D703}$
as a uniform random number ranging from
 $0$
to
 $2\unicode[STIX]{x03C0}$
, the energy expectation value is calculated as
 $$\begin{eqnarray}\displaystyle \langle E\rangle & = & \displaystyle \frac{1}{2\unicode[STIX]{x03C0}}\int _{0}^{2\unicode[STIX]{x03C0}}(x^{2}+{\dot{x}}^{2})\,\text{d}\unicode[STIX]{x1D703}\sim \frac{1}{2\unicode[STIX]{x03C0}}\int _{0}^{2\unicode[STIX]{x03C0}}(u^{2}+v^{2})\,\text{d}\unicode[STIX]{x1D703}\nonumber\\ \displaystyle & = & \displaystyle \left(\frac{1}{2}+\frac{\unicode[STIX]{x1D716}^{2}}{16\unicode[STIX]{x1D706}_{a}^{2}}+\frac{\unicode[STIX]{x1D702}^{2}}{8\unicode[STIX]{x1D706}_{a}^{2}}\right)a^{2}\cosh (2\unicode[STIX]{x1D706}_{a}t)-\frac{\unicode[STIX]{x1D702}^{2}a^{2}}{4\unicode[STIX]{x1D706}_{a}^{2}}.\end{eqnarray}$$
Note that the growth rate of the energy expectation value is twice that of the amplitude of the oscillator, i.e.
 $\unicode[STIX]{x1D706}=2\unicode[STIX]{x1D706}_{a}$
. In the no-detuning case
 $\unicode[STIX]{x1D702}=0$
, equation (B 7) reduces to (3.3).
Appendix C. Hamiltonian description of long internal waves
A basic Hamiltonian description of long internal waves is summarised here. For a more detailed derivation, refer to the work by Lvov & Tabak (Reference Lvov and Tabak2004) or Medvedev & Zeitlin (Reference Medvedev and Zeitlin2007). Let us consider an inviscid, incompressible, rotating, stratified fluid under the hydrostatic approximation. We employ the isopycnal coordinate system
 $\boldsymbol{r}=(x,y,\unicode[STIX]{x1D70C})$
and choose the horizontal velocities
 $(u,v)$
and the thickness
 $h$
as dependent variables. Further utilising the Boussinesq approximation with representative density
 $\unicode[STIX]{x1D70C}_{0}$
, the thickness variable is defined in terms of vertical position
 $z$
as
 $h\equiv -\unicode[STIX]{x1D70C}_{0}z_{\unicode[STIX]{x1D70C}}$
(here the subscript represents the partial derivative). Note that
 $z$
is also a function of
 $(x,y,\unicode[STIX]{x1D70C})$
and is always associated with
 $h$
. The governing equations are
 $$\begin{eqnarray}\displaystyle & \displaystyle \frac{\unicode[STIX]{x2202}u}{\unicode[STIX]{x2202}t}+u\frac{\unicode[STIX]{x2202}u}{\unicode[STIX]{x2202}x}+v\frac{\unicode[STIX]{x2202}u}{\unicode[STIX]{x2202}y}-fv=-\frac{1}{\unicode[STIX]{x1D70C}_{0}}\frac{\unicode[STIX]{x2202}M}{\unicode[STIX]{x2202}x}, & \displaystyle\end{eqnarray}$$
 $$\begin{eqnarray}\displaystyle & \displaystyle \frac{\unicode[STIX]{x2202}v}{\unicode[STIX]{x2202}t}+u\frac{\unicode[STIX]{x2202}v}{\unicode[STIX]{x2202}x}+v\frac{\unicode[STIX]{x2202}v}{\unicode[STIX]{x2202}y}+fu=-\frac{1}{\unicode[STIX]{x1D70C}_{0}}\frac{\unicode[STIX]{x2202}M}{\unicode[STIX]{x2202}y}, & \displaystyle\end{eqnarray}$$
 $$\begin{eqnarray}\displaystyle & \displaystyle \frac{\unicode[STIX]{x2202}h}{\unicode[STIX]{x2202}t}+\frac{\unicode[STIX]{x2202}uh}{\unicode[STIX]{x2202}x}+\frac{\unicode[STIX]{x2202}vh}{\unicode[STIX]{x2202}y}=0, & \displaystyle\end{eqnarray}$$
 $f$
is a constant Coriolis parameter and
 $M$
is the Montgomery potential defined such as
 $M_{\unicode[STIX]{x1D70C}}=gz$
. As a reference field, we consider the state of rest
 $u=v=0$
with horizontally uniform thickness
 $h=h_{0}(\unicode[STIX]{x1D70C})$
, and then introduce the thickness deviation as
 $\unicode[STIX]{x1D702}\equiv h-h_{0}$
. The governing equations (C 1) are consequently rewritten in the form of
 $$\begin{eqnarray}\frac{\unicode[STIX]{x2202}}{\unicode[STIX]{x2202}t}\left(\begin{array}{@{}c@{}}u\\ v\\ \unicode[STIX]{x1D702}\end{array}\right)=\unicode[STIX]{x1D645}\left(\begin{array}{@{}c@{}}\unicode[STIX]{x1D6FF}{\mathcal{H}}/\unicode[STIX]{x1D6FF}u\\ \unicode[STIX]{x1D6FF}{\mathcal{H}}/\unicode[STIX]{x1D6FF}v\\ \unicode[STIX]{x1D6FF}{\mathcal{H}}/\unicode[STIX]{x1D6FF}\unicode[STIX]{x1D702}\end{array}\right),\end{eqnarray}$$
where the functional
 ${\mathcal{H}}$
and the skew symmetric operator
 $\unicode[STIX]{x1D645}$
are defined as
 $$\begin{eqnarray}\displaystyle & \displaystyle {\mathcal{H}}=\frac{1}{2}\int \left((h_{0}+\unicode[STIX]{x1D702})(u^{2}+v^{2})+g\left(\int \frac{\unicode[STIX]{x1D702}}{\unicode[STIX]{x1D70C}_{0}}\,\text{d}\unicode[STIX]{x1D70C}^{\prime }\right)^{2}\right)\,\text{d}\boldsymbol{r}, & \displaystyle\end{eqnarray}$$
 $$\begin{eqnarray}\displaystyle & \displaystyle \unicode[STIX]{x1D645}=\left(\begin{array}{@{}ccc@{}}0 & q & -\unicode[STIX]{x2202}_{x}\\ -q & 0 & -\unicode[STIX]{x2202}_{y}\\ -\unicode[STIX]{x2202}_{x} & -\unicode[STIX]{x2202}_{y} & 0\end{array}\right), & \displaystyle\end{eqnarray}$$
 $q\equiv (f+v_{x}-u_{y})/(h_{0}+\unicode[STIX]{x1D702})$
. The functional
 ${\mathcal{H}}$
is the Hamiltonian that represents the total energy of the system.
To focus on the wave motion, we assume that potential vorticity is uniform on each isopycnal surface:
 $q=f/h_{0}$
. As a result, the horizontal velocity can be decomposed into
 $$\begin{eqnarray}\displaystyle & \displaystyle u=\frac{\unicode[STIX]{x2202}\unicode[STIX]{x1D719}}{\unicode[STIX]{x2202}x}-\frac{\unicode[STIX]{x2202}}{\unicode[STIX]{x2202}y}\unicode[STIX]{x0394}_{H}^{-1}\frac{f\unicode[STIX]{x1D702}}{h_{0}}, & \displaystyle\end{eqnarray}$$
 $$\begin{eqnarray}\displaystyle & \displaystyle v=\frac{\unicode[STIX]{x2202}\unicode[STIX]{x1D719}}{\unicode[STIX]{x2202}y}+\frac{\unicode[STIX]{x2202}}{\unicode[STIX]{x2202}x}\unicode[STIX]{x0394}_{H}^{-1}\frac{f\unicode[STIX]{x1D702}}{h_{0}}, & \displaystyle\end{eqnarray}$$
 $\unicode[STIX]{x0394}_{H}=\unicode[STIX]{x2202}_{x}^{2}+\unicode[STIX]{x2202}_{y}^{2}$
is the horizontal Laplacian and
 $\unicode[STIX]{x1D719}$
is the velocity potential. After some algebraic manipulation, equation (C 2) is transformed into the canonical equation
 $$\begin{eqnarray}\frac{\unicode[STIX]{x2202}\unicode[STIX]{x1D702}}{\unicode[STIX]{x2202}t}=\frac{\unicode[STIX]{x1D6FF}{\mathcal{H}}}{\unicode[STIX]{x1D6FF}\unicode[STIX]{x1D719}},\quad \frac{\unicode[STIX]{x2202}\unicode[STIX]{x1D719}}{\unicode[STIX]{x2202}t}=-\frac{\unicode[STIX]{x1D6FF}{\mathcal{H}}}{\unicode[STIX]{x1D6FF}\unicode[STIX]{x1D702}},\end{eqnarray}$$
with the associated Hamiltonian
 $$\begin{eqnarray}{\mathcal{H}}=\frac{1}{2}\int \left[(h_{0}+\unicode[STIX]{x1D702})\left|\unicode[STIX]{x1D735}\unicode[STIX]{x1D719}-\unicode[STIX]{x1D735}^{\bot }\unicode[STIX]{x0394}_{H}^{-1}\frac{f\unicode[STIX]{x1D702}}{h_{0}}\right|^{2}+g\left(\int ^{\unicode[STIX]{x1D70C}}\frac{\unicode[STIX]{x1D702}}{\unicode[STIX]{x1D70C}_{0}}\,\text{d}\unicode[STIX]{x1D70C}^{\prime }\right)^{2}\right]\text{d}\boldsymbol{r},\end{eqnarray}$$
where
 $\unicode[STIX]{x1D735}\equiv (\unicode[STIX]{x2202}_{x},\unicode[STIX]{x2202}_{y})$
and
 $\unicode[STIX]{x1D735}^{\bot }\equiv (\unicode[STIX]{x2202}_{y},-\unicode[STIX]{x2202}_{x})$
.
The reference thickness
 $h_{0}$
is related to the local buoyancy frequency
 $N$
as
 $h_{0}=g/N^{2}$
and is assumed to be constant. We then take the Fourier transform
 $$\begin{eqnarray}\left(\begin{array}{@{}c@{}}\unicode[STIX]{x1D719}(\boldsymbol{r})\\ \unicode[STIX]{x1D702}(\boldsymbol{r})\end{array}\right)=\frac{1}{(2\unicode[STIX]{x03C0})^{3/2}}\int \left(\begin{array}{@{}c@{}}\tilde{\unicode[STIX]{x1D719}}(\boldsymbol{k})\\ \tilde{\unicode[STIX]{x1D702}}(\boldsymbol{k})\end{array}\right)\text{e}^{-\text{i}\boldsymbol{k}\boldsymbol{\cdot }\boldsymbol{r}}\,\text{d}\boldsymbol{k},\end{eqnarray}$$
where
 $\boldsymbol{k}=(k_{1},k_{2},k_{3})$
is the three-dimensional wavevector. Writing the horizontal wavenumber as
 $p\equiv \sqrt{k_{1}^{2}+k_{2}^{2}}$
and the vertical wavenumber as
 $q\equiv k_{3}$
, we have the variable transformation
 $$\begin{eqnarray}a(\boldsymbol{k})=\frac{1}{2}\sqrt{\frac{2N^{2}\unicode[STIX]{x1D714}}{gp^{2}}}\tilde{\unicode[STIX]{x1D702}}(\boldsymbol{k})-\frac{\text{i}}{2}\sqrt{\frac{2gp^{2}}{N^{2}\unicode[STIX]{x1D714}}}\tilde{\unicode[STIX]{x1D719}}(\boldsymbol{k}),\end{eqnarray}$$
with the dispersion relation
 $$\begin{eqnarray}\unicode[STIX]{x1D714}(\boldsymbol{k})=\sqrt{f^{2}+\frac{g^{2}p^{2}}{\unicode[STIX]{x1D70C}_{0}^{2}N^{2}q^{2}}},\end{eqnarray}$$
which enables the canonical equation (C 5) to be written in the form of (4.1) and (4.2). Although the coupling coefficients
 $U$
and
 $V$
are somewhat complicated functions of wavevectors, they are obtained in a straightforward manner.
Appendix D. Numerical analysis of eigenvalue equation (4.21)
Here we introduce a constant
 $\unicode[STIX]{x1D716}^{2}|V|^{2}\equiv B$
and the additional functions
 $M_{1,2}^{r,i}(k^{\prime },k_{2}^{\prime })$
and
 $L_{1,2}(k_{1}^{\prime })$
such that (4.21) are transformed to standard linear eigenvalue equations:
 $$\begin{eqnarray}\displaystyle & \displaystyle \unicode[STIX]{x1D706}{\tilde{N}}_{1}(k_{1}^{\prime })=2B\int {\tilde{N}}_{B}(k^{\prime })M_{2}^{r}(k^{\prime },k_{1}^{\prime })\,\text{d}k^{\prime }+4\unicode[STIX]{x03C0}BN_{0}L_{1}(k_{1}^{\prime }), & \displaystyle\end{eqnarray}$$
 $$\begin{eqnarray}\displaystyle & \displaystyle \unicode[STIX]{x1D706}{\tilde{N}}_{2}(k_{2}^{\prime })=2B\int {\tilde{N}}_{B}(k^{\prime })M_{1}^{r}(k^{\prime },k_{2}^{\prime })\,\text{d}k^{\prime }+4\unicode[STIX]{x03C0}BN_{0}L_{2}(k_{2}^{\prime }), & \displaystyle\end{eqnarray}$$
 $$\begin{eqnarray}\displaystyle & \displaystyle \unicode[STIX]{x1D706}M_{1}^{r}(k^{\prime },k_{2}^{\prime })={\tilde{N}}_{1}(-k_{2}^{\prime }+k^{\prime })-((c-c_{1})k^{\prime }+(c_{1}-c_{2})k_{2}^{\prime })M_{1}^{i}(k^{\prime },k_{2}^{\prime }), & \displaystyle\end{eqnarray}$$
 $$\begin{eqnarray}\displaystyle & \displaystyle \unicode[STIX]{x1D706}M_{1}^{i}(k^{\prime },k_{2}^{\prime })=((c-c_{1})k^{\prime }+(c_{1}-c_{2})k_{2}^{\prime })M_{1}^{r}(k^{\prime },k_{2}^{\prime }), & \displaystyle\end{eqnarray}$$
 $$\begin{eqnarray}\displaystyle & \displaystyle \unicode[STIX]{x1D706}M_{2}^{r}(k^{\prime },k_{1}^{\prime })={\tilde{N}}_{2}(-k_{1}^{\prime }+k^{\prime })-((c-c_{2})k^{\prime }+(c_{2}-c_{1})k_{1}^{\prime })M_{2}^{i}(k^{\prime },k_{1}^{\prime }), & \displaystyle\end{eqnarray}$$
 $$\begin{eqnarray}\displaystyle & \displaystyle \unicode[STIX]{x1D706}M_{2}^{i}(k^{\prime },k_{1}^{\prime })=((c-c_{2})k^{\prime }+(c_{2}-c_{1})k_{1}^{\prime })M_{2}^{r}(k^{\prime },k_{1}^{\prime }), & \displaystyle\end{eqnarray}$$
 $$\begin{eqnarray}\displaystyle & \displaystyle \unicode[STIX]{x1D706}L_{1}(k_{1}^{\prime })={\tilde{N}}_{1}(k_{1}^{\prime })-|c-c_{2}|\unicode[STIX]{x1D707}_{k}L_{1}(k_{1}^{\prime }), & \displaystyle\end{eqnarray}$$
 $$\begin{eqnarray}\displaystyle & \displaystyle \unicode[STIX]{x1D706}L_{2}(k_{2}^{\prime })={\tilde{N}}_{2}(k_{2}^{\prime })-|c-c_{1}|\unicode[STIX]{x1D707}_{k}L_{2}(k_{2}^{\prime }). & \displaystyle\end{eqnarray}$$
 $64$
grid points, the interval of which is arranged as
 $\unicode[STIX]{x0394}k=\unicode[STIX]{x1D707}_{k}/6$
. Consequently, the right-hand sides of (D 1) are rewritten as the product of a
 $16\,640\times 16\,640$
sparse matrix and a vector. The largest eigenvalue and the corresponding eigenvector of this matrix are numerically obtained. In the calculation, the parameters
 $B=0.01,~c_{1}=1.0,~c_{2}=-1.0$
and
 $\unicode[STIX]{x1D707}_{k}=0.02$
are assumed to be constant, whereas
 $N_{0}$
and
 $c$
are varied. The results are shown in figure 5.
Appendix E. Approximate solution for (4.17) with
$d=3$

Let us define the two-dimensional manifold
 ${\mathcal{M}}$
in
 $(\boldsymbol{k}_{1},\boldsymbol{k}_{2})$
space that satisfies the resonant conditions (4.15). We choose a point on this manifold as
 $(\boldsymbol{k}_{1}^{c},\boldsymbol{k}_{2}^{c})$
and define a pair of unit vectors
 $(\boldsymbol{e}_{1}^{m},\boldsymbol{e}_{2}^{m})$
which are normal to
 ${\mathcal{M}}$
at
 $(\boldsymbol{k}_{1}^{c},\boldsymbol{k}_{2}^{c})$
. From the conditions (4.15), they can be written as
 $$\begin{eqnarray}\boldsymbol{e}_{1}^{m}=\boldsymbol{e}_{2}^{m}=\frac{\boldsymbol{c}_{1}-\boldsymbol{c}_{2}}{|\boldsymbol{c}_{1}-\boldsymbol{c}_{2}|}\equiv \boldsymbol{e}^{m},\end{eqnarray}$$
where the group velocities at
 $\boldsymbol{k}_{1}^{c}$
and
 $\boldsymbol{k}_{2}^{c}$
are defined as
 $\boldsymbol{c}_{1}\equiv \unicode[STIX]{x1D735}\unicode[STIX]{x1D714}|_{\boldsymbol{k}_{1}^{c}}$
and
 $\boldsymbol{c}_{2}\equiv \unicode[STIX]{x1D735}\unicode[STIX]{x1D714}|_{\boldsymbol{k}_{2}^{c}}$
. Within the disturbance spectrum
 $N$
, only wavevectors in the vicinity of
 ${\mathcal{M}}$
interact intensively with the background waves. Accordingly,
 $N$
may vary slowly along
 ${\mathcal{M}}$
, but damp rapidly along
 $\boldsymbol{e}^{m}$
. Therefore, the disturbance spectrum near
 $\boldsymbol{k}_{1}^{c},~\boldsymbol{k}_{2}^{c}$
can be approximately written as
 $$\begin{eqnarray}N(\boldsymbol{k}_{1}^{c}+\boldsymbol{k}_{1}^{\prime })\sim {\tilde{N}}_{1}(k_{1}^{m}),\quad N(\boldsymbol{k}_{2}^{c}+\boldsymbol{k}_{2}^{\prime })\sim {\tilde{N}}_{2}(k_{2}^{m}),\end{eqnarray}$$
where
 $k_{1}^{m}=\boldsymbol{k}_{1}^{\prime }\boldsymbol{\cdot }\boldsymbol{e}^{m}$
and
 $k_{2}^{m}=\boldsymbol{k}_{2}^{\prime }\boldsymbol{\cdot }\boldsymbol{e}^{m}$
.
We next examine the transfer function
 $\unicode[STIX]{x1D6F7}$
. Given
 $\boldsymbol{k}_{1}$
, a condition
 $\unicode[STIX]{x1D714}(\boldsymbol{k}_{1})+\unicode[STIX]{x1D714}(\boldsymbol{k}-\boldsymbol{k}_{1})-\unicode[STIX]{x1D714}(\boldsymbol{k})=0$
determines a manifold
 ${\mathcal{N}}_{1}$
in the wavevector space of
 $\boldsymbol{k}$
. Similarly, given
 $\boldsymbol{k}_{2}$
, another condition
 $\unicode[STIX]{x1D714}(\boldsymbol{k}-\boldsymbol{k}_{2})+\unicode[STIX]{x1D714}(\boldsymbol{k}_{2})-\unicode[STIX]{x1D714}(\boldsymbol{k})=0$
determines a manifold
 ${\mathcal{N}}_{2}$
in the wavevector space of
 $\boldsymbol{k}$
. Along these manifolds, the transfer function takes the maximum value,
 $\unicode[STIX]{x1D6F7}|_{{\mathcal{N}}}=2/\unicode[STIX]{x1D706}$
. We introduce unit vectors
 $\boldsymbol{e}_{1}^{n}$
and
 $\boldsymbol{e}_{2}^{n}$
which are normal to
 ${\mathcal{N}}_{1}$
and
 ${\mathcal{N}}_{2}$
. In the vicinity of
 $\boldsymbol{k}_{1}=\boldsymbol{k}_{1}^{c},~\boldsymbol{k}=\boldsymbol{k}^{B}$
or
 $\boldsymbol{k}_{2}=\boldsymbol{k}_{2}^{c},~\boldsymbol{k}=\boldsymbol{k}^{B}$
, they can be represented as
 $$\begin{eqnarray}\boldsymbol{e}_{1}^{n}=\frac{\boldsymbol{c}-\boldsymbol{c}_{2}}{|\boldsymbol{c}-\boldsymbol{c}_{2}|},\quad \boldsymbol{e}_{2}^{n}=\frac{\boldsymbol{c}-\boldsymbol{c}_{1}}{|\boldsymbol{c}-\boldsymbol{c}_{1}|},\end{eqnarray}$$
where
 $\boldsymbol{c}\equiv \unicode[STIX]{x1D735}\unicode[STIX]{x1D714}|_{\boldsymbol{k}_{B}}$
is the group velocity of the background wave train.
Substituting
 $\boldsymbol{k}_{\unicode[STIX]{x1D6FC}}=\boldsymbol{k}_{1}^{c}+k_{1}^{m}\boldsymbol{e}^{m}$
or
 $\boldsymbol{k}_{\unicode[STIX]{x1D6FC}}=\boldsymbol{k}_{2}^{c}+k_{2}^{m}\boldsymbol{e}^{m}$
into (4.17) and performing the integration with respect to
 $\boldsymbol{k}_{\unicode[STIX]{x1D6FD}}$
, we may write the equation formally as
 $$\begin{eqnarray}\unicode[STIX]{x1D706}{\tilde{N}}_{1,2}(k_{1,2}^{m})=\unicode[STIX]{x1D716}^{2}\int |V|^{2}\unicode[STIX]{x1D6F7}({\tilde{N}}_{2,1}+{\tilde{N}}_{1,2})N_{B}\,\text{d}\boldsymbol{k}.\end{eqnarray}$$
Now we decompose the integration wavevector as
 $\boldsymbol{k}=\boldsymbol{k}_{B}+k^{n}\boldsymbol{e}_{1,2}^{n}+\boldsymbol{k}^{\prime \prime }$
with
 $\boldsymbol{k}^{\prime \prime }\boldsymbol{\cdot }\boldsymbol{e}_{1,2}^{n}=0$
and specify the arguments of the factors on the right-hand side of (E 4): the coupling coefficient
 $V$
can be approximated by the constant value,
 $|V|^{2}=|V(\boldsymbol{k}_{B},\boldsymbol{k}_{1}^{c},\boldsymbol{k}_{2}^{c})|^{2}$
, the transfer function
 $\unicode[STIX]{x1D6F7}$
is Taylor-expanded in terms of
 $k_{1,2},~k^{n}$
as
 $$\begin{eqnarray}\unicode[STIX]{x1D6F7}=\frac{2\unicode[STIX]{x1D706}}{(|\boldsymbol{c}-\boldsymbol{c}_{2}|k^{n}-|\boldsymbol{c}_{1}-\boldsymbol{c}_{2}|k_{1}^{m})^{2}+\unicode[STIX]{x1D706}^{2}}\end{eqnarray}$$
or
 $$\begin{eqnarray}\unicode[STIX]{x1D6F7}=\frac{2\unicode[STIX]{x1D706}}{(|\boldsymbol{c}-\boldsymbol{c}_{1}|k^{n}+|\boldsymbol{c}_{1}-\boldsymbol{c}_{2}|k_{2}^{m})^{2}+\unicode[STIX]{x1D706}^{2}},\end{eqnarray}$$
the disturbance spectra
 ${\tilde{N}}_{1,2}$
depend on
 $k_{1,2}^{m}$
,
 $k^{n}$
and
 $\boldsymbol{k}^{\prime \prime }$
, and the background spectrum
 $N_{B}$
depends on
 $k^{n}$
and
 $\boldsymbol{k}^{\prime \prime }$
. In the same way as in the one-dimensional case (§ 4.3), let us assume
 $|\boldsymbol{c}|\gg |\boldsymbol{c}_{1}|,|\boldsymbol{c}_{2}|$
leading to
 $\boldsymbol{e}_{1}^{n}\sim \boldsymbol{e}_{2}^{n}\equiv \boldsymbol{e}^{n}$
, and regard
 ${\tilde{N}}_{1,2}$
in the integrand as constant. Integration of (E 4) with respect to
 $\boldsymbol{k}^{\prime \prime }$
can now be performed, yielding the one-dimensional background spectrum,
 $$\begin{eqnarray}{\tilde{N}}_{B}(k^{n})=\frac{1}{(2\unicode[STIX]{x03C0})^{2}}\int _{S}N_{B}(\boldsymbol{k}_{B}+k^{n}\boldsymbol{e}^{n}+\boldsymbol{k}^{\prime \prime })\,\text{d}\boldsymbol{k}^{\prime \prime },\end{eqnarray}$$
where
 $S$
indicates the two-dimensional plane orthogonal to
 $\boldsymbol{e}_{1}^{n}$
. Adopting the phase-modulated sinusoidal function as the background wave that yields
 $$\begin{eqnarray}{\tilde{N}}_{B}(k^{n})=\frac{2N_{0}\unicode[STIX]{x1D707}_{k}}{(k^{n})^{2}+\unicode[STIX]{x1D707}_{k}^{2}},\end{eqnarray}$$
equation (E 4) is calculated to estimate the disturbance spectrum,
 $$\begin{eqnarray}\unicode[STIX]{x1D706}{\tilde{N}}_{1,2}(k_{1,2}^{m})\sim \frac{32\unicode[STIX]{x03C0}^{3}\unicode[STIX]{x1D716}^{2}|V|^{2}N_{0}(|\boldsymbol{c}|\unicode[STIX]{x1D707}_{k}+\unicode[STIX]{x1D706})}{(|\boldsymbol{c}|\unicode[STIX]{x1D707}_{k}+\unicode[STIX]{x1D706})^{2}+|\boldsymbol{c}_{1}-\boldsymbol{c}_{2}|^{2}(k_{1,2}^{m})^{2}},\end{eqnarray}$$
the same form as (4.25). Following the logic in the one-dimensional case, we can conclude that the bandwidth of
 ${\tilde{N}}_{1,2}$
becomes much larger than
 $\unicode[STIX]{x1D6F7}$
or
 $N_{B}$
, which justifies the assumption that
 ${\tilde{N}}_{1,2}$
in the integrands can be regarded as constant.
Finally, we solve (E 4) algebraically with the conditions of
 $k_{1,2}^{m}=0$
,
 $N_{1,2}$
being constant, and
 $|\boldsymbol{c}|\gg |\boldsymbol{c}_{1}|,|\boldsymbol{c}_{2}|$
, to obtain the growth rate
 $\unicode[STIX]{x1D706}$
in the same form as (4.23) with the parameters
 $$\begin{eqnarray}\unicode[STIX]{x1D707}\equiv |\boldsymbol{c}|\unicode[STIX]{x1D707}_{k}=\left|\unicode[STIX]{x1D735}\unicode[STIX]{x1D714}\right|_{\boldsymbol{k}_{B}}\unicode[STIX]{x1D707}_{k},\quad C\equiv \frac{32\unicode[STIX]{x03C0}^{3}\unicode[STIX]{x1D716}^{2}|V|^{2}}{\unicode[STIX]{x1D714}(\boldsymbol{k}_{B})},\quad E_{B}\equiv \unicode[STIX]{x1D714}(\boldsymbol{k}_{B})N_{0}.\end{eqnarray}$$
Again,
 $\unicode[STIX]{x1D707}$
is the spectrum width of the background frequency spectrum.