I. INTRODUCTION
Silicon oxycarbides, SiOCs, are nanostructured amorphous materials made through pyrolysis of Si-containing organic precursors. Reference Bréquel, Parmentier, Walter, Badheka, Trimmel, Masse, Latournerie, Dempsey, Turquat, Desmartin-Chomel, Le Neindre-Prum, Jayasooriya, Hourlier, Kleebe, Sorarù, Enzo and Babonneau1 They belong to the wider polymer-derived ceramic, PDC, family. Reference Colombo, Mera, Riedel and Soraru2 The nanostructure of SiOCs is made up of an amorphous silicon oxycarbide network of mixed SiC4−x O x , 0 ≤ x ≤ 4, tetrahedra and a free carbon phase. Reference Saha, Raj and Williamson3,Reference Widgeon, Sen, Mera, Ionescu, Riedel and Navrotsky4 Such a unique nanostructure conveys to these materials an exceptional mix of properties combining high elastic modulus and excellent chemical durability, Reference Suyal, Krajewski and Mennig5–Reference Soraru, Modena, Guadagnino, Colombo, Egan and Pantano7 with optical, Reference Narisawa, Kawai, Watase, Matsukawa, Dohmaru, Okamura and Iwase8 electrochemical, Reference Sanchez-Jimenez and Raj9 and electrical properties Reference Nguyen, Zanella, Bettotti and Soraru10 which make SiOCs good candidate materials for LED, Reference Karakuscu, Guider, Pavesi and Soraru11 anodes for Li-ion batteries Reference Fukui, Ohsuka, Hino and Kanamura12,Reference Pradeep, Graczyk-Zajac, Wilamowska, Riedel and Soraru13 and pressure and temperature sensors for harsh environments, Reference Riedel, Toma, Janssen, Nuffer, Melz and Hanselka14 respectively. The amount and structure of the free carbon phase of silicon oxycarbides have been shown to influence many different properties such as the stability of the amorphous network and its crystallization kinetics, Reference Turquat, Kleebe, Gregori, Walter and Soraru15 the electrical Reference Cordelair and Greil16,Reference Wang, Ma, Wang and An17 and optical properties, Reference Menapace, Mera, Riedel, Erdem, Eichel, Pauletti and Appleby18 as well as the Li storage capacity when SiOCs are used as anodes for Li-ion batteries. Reference Pradeep, Graczyk-Zajac, Riedel and Soraru19 Accordingly, the free carbon phase present in the SiOC nanostructure has been extensively characterized using different techniques Reference Bréquel, Parmentier, Walter, Badheka, Trimmel, Masse, Latournerie, Dempsey, Turquat, Desmartin-Chomel, Le Neindre-Prum, Jayasooriya, Hourlier, Kleebe, Sorarù, Enzo and Babonneau1 and also modeled by ab initio molecular dynamic simulation. Reference Kroll20
These materials can be doped with extra elements to further extend the range of interesting properties. In particular, B- and N-doping, resulting into Si(B)OC and Si(N)OC systems, have been reported in the literature. Reference Sorarù, Babonneau, Maurina and Vicens21,Reference Schiavon, Ciuffi and Yoshida22 In the B-doped system, boron atoms are present either in the amorphous silicon oxycarbide network as BC3−y O y , 0 ≤ y ≤ 3, units or in the sp 2 C layers of the free C phase as substitutional BC3 units. Reference Gervais, Babonneau, Dallabona and Soraru23,Reference Pena-Alonso, Mariotto, Gervais, Babonneau and Soraru24 As a consequence, B addition has a strong impact on different properties of Si(B)OC such as the photoluminescence, Reference Karakuscu, Guider, Pavesi and Sorarù25 the electrical conductivity Reference Klonczynski, Schneider, Riedel and Theissmann26 and the high temperature stability. Reference Klonczynski, Schneider, Riedel and Theissmann26,Reference Tavakoli, Campostrini, Gervais, Babonneau, Bill, Sorarù and Navrotsky27 On the other side, few studies have focused on the synthesis and characterization of N-doped SiOC. Reference Nguyen, Zanella, Bettotti and Soraru10,Reference Schiavon, Ciuffi and Yoshida22
The objective of this paper is to synthesize N-doped SiOC ceramics using different N-containing precursors and then to characterize their structure and high temperature behavior, in particular, the thermal stability and crystallization behavior. Accordingly, we report here for the first time how the molecular structure of the precursors influences both the nitrogen content and its chemical bonding nature in the final ceramics.
In this work, three different preceramic polymer precursors for Si(N)OC ceramics are studied. The polymer precursors are synthesized via hydrosilylation reaction between a linear polysiloxane containing Si–CH3 and Si–H bonds, namely polyhydridomethylsiloxane, PHMS (HCH3Si–O) n , and vinyl-bearing organic compounds such as 2,4,6-trimethyl-2,4,6-trivinylcyclotrisilazane (TMTVSLZ), triallylamine (TA), and 1,3,5-triallyl-1,3,5-triazine-2,4,6 (1H,3H,5H)-trione (TTT), with a constant molar ratio (2:1) of Si–H : –CH=CH2 groups. The molecular structures of the starting materials are shown in Scheme 1.
Molecular structures of the starting materials.

It should be mentioned that N atoms in the starting materials exist in different chemical sites, for example, in HNSi2 units (TMTVSLZ), in N(C sp 3)3 (TA), and in NC sp 3(C sp 2)2 units (TTT). The structural characterization of the as-synthesized precursors was performed by FTIR, 13C-NMR, and 29Si-NMR. Thermogravimetric analysis (TGA) was carried out to study the thermal stability of the synthesized polymer precursors. All the as-synthesized polymers were pyrolyzed at different temperatures between 800 and 1500 °C leading to the formation of the corresponding Si(N)OC ceramics. The chemical composition of the Si(N)OC ceramics was analyzed by elemental analysis. Furthermore, the structural evolution occurring between 1000 and 1500 °C was investigated by FTIR, XRD, and 29Si-NMR. X-ray photoelectron spectroscopy (XPS) was used to study the local environment on different elements in the ceramics derived from PHMS/TMTVSLZ and from PHMS/TTT at 1000 °C.
II. EXPERIMENTAL
A. Chemicals
Polyhydridomethylsiloxane (PHMS) was supplied from Alfa Aesar, Italy. Platinum(0)-1,3-divinyl-1,1,3,3-tetramethyldisiloxane complex solution in xylene (Pt-based catalyst); 2,4,6-trimethyl-2,4,6-trivinylcyclotrisilazane (TMTVSLZ); triallylamine (TA); and 1,3,5-triallyl-1,3,5-triazine-2,4,6 (1H,3H,5H)-trione (TTT) were purchased from Sigma–Aldrich, Italy. All the starting materials were used as received without further purification.
B. Synthesis of preceramic polymers and ceramics
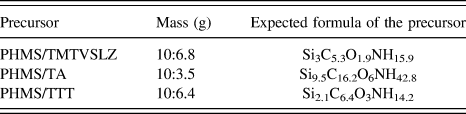
PHMS/TMTVSLZ precursor was prepared from a mixture of PHMS and TMTVSLZ in the presence of a Pt-based catalyst (1 wt% with respect to PHMS). This reaction was carried out at room temperature for 24 h and it was subsequently aged at 80 °C for 7 days to form a hard gel. PHMS/TA precursor was synthesized via the reaction of PHMS and TA at 0 °C for 24 h and subsequently it was aged at 80 °C for 7 days to obtain a hard gel. PHMS/TTT precursor was synthesized from a mixture of PHMS and TTT in cyclohexane at 70 °C under reflux conditions for 24 h. After a complete evaporation of the solvent, the cross-linked gel was aged at 90 °C for 7 days. The crosslinking mechanism of these three reactions is based on the hydrosilylation reaction between the Si-H groups of PHMS and the –CH=CH2 functional groups in the reactants. Reference Kleebe, Gregori, Babonneau, Blum, MacQueen and Masse28,Reference Sorarù, Dalcanale, Campostrini, Gaston, Blum, Carturan and Aravind29 The molar ratio of Si–H : –CH=CH2 was kept unchanged (2:1) in all the syntheses. The average molecular weight of PHMS (1900 g/mol) was used to calculate the molar ratio taking into account the presence, in the polymer structure, of the two (CH3)3SiO terminal units. The manipulation of the reagents is performed under argon flow to prevent excessive interactions with air and moisture. All the reactions were carried out in air. The nominal compositions of the starting precursors are listed in Table I.
Nominal compositions of the starting precursors.

An alumina tubular furnace was used for the pyrolysis of the as-obtained gels. Fragments of the preceramic polymers were placed in an alumina boat and were consequently inserted into the furnace for heat treatment. The Si(N)OC ceramic samples were produced by pyrolysis of the as-obtained gels for 1 h under flowing nitrogen (100 mL/min) at the desired temperature. The pyrolysis temperature was programmed with a heating rate of 10 °C/min and 10 °C/min cooling rate to room temperature. The final ceramics were then milled in an agate mortar to obtain fine powders.
C. Characterization techniques
1. FTIR
FTIR spectra were collected on a Nicolet Avatar 330 Fourier transform infrared spectrometer (Thermo Electron Corporation, Waltham, MA) using KBr technique in transmission mode. An average of 64 scans with 4 cm−1 resolution was recorded for each specimen.
2. MAS NMR
13C and 29Si MAS NMR spectra of the synthesized polymer precursors were collected using an AVANCE 300 Bruker 7 mm probe-head (Bruker Instruments, Karlsruhe, Germany) operating at the frequencies of 75.48 and 59.62 MHz, respectively. All the 29Si single pulse NMR spectra were recorded using a π/2 pulse length of 2.8 µs and a recycle delay of 300 s. For the 13C NMR, single pulse experiments were performed using a π/2 pulse length of 2.2 µs and a recycle delay of 10 s.
The 29Si NMR experiments of the ceramic samples pyrolyzed at 1400 °C were carried out using an AVANCE 400 Bruker 7 mm probe-head (Bruker Instruments, Karlsruhe, Germany) operating at the frequency of 79.49 MHz. The 29Si single pulse NMR spectra were recorded using a π/4 pulse length of 2 µs and a recycle delay of 100 s.
Polymer and ceramic samples were packed in 4 mm zirconia rotors which were spun at a rate of 7 and 8 kHz, respectively, under air flow. Q8M8, adamantine, and ethanol were used as external secondary references for the determination of the 29Si and 13C chemical shifts.
3. TGA
TGA of the polymers was performed using a Netzsch apparatus (Model STA 409, Netzsch-Geratebau GmbH, Germany). The samples were heated to 1500 °C at a rate of 10 °C/min in nitrogen atmosphere with a flux of 100 mL/min.
4. XRD
XRD spectra of the powder samples that were pyrolyzed at different temperatures were recorded using a diffractometer (Model D-Max B, Rigaku, Tokyo, Japan) operated at 40 kV and 30 mA with a Cu Kα radiation. The spectra were collected in the 2θ range of 20–80, with a step of 0.05° every 6 s.
5. Chemical analysis
The carbon content of the powdered ceramic samples was determined by a carbon analyzer (Leco TC-200, Leco Corp). The oxygen and nitrogen content were measured by an analyzer (Leco TC-436, Leco Corp).
6. XPS
XPS spectra were recorded using a Science-ESCA 200 equipped with a hemispherical analyzer and a monochromatic Al Kα x-ray source. The core lines (C1s, N1s) were acquired at a pass energy of 150 eV. A Shirley-type background subtraction was applied. The spectra were fitted using a nonlinear least-squares fitting program. The C1s core line with the main peak at 284.7 eV corresponding to amorphous carbon was used as internal reference to calibrate the spectra.
III. RESULTS AND DISCUSSION
A. Characterization of the preceramic polymer precursors
1. FTIR
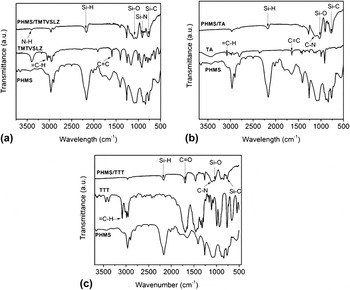
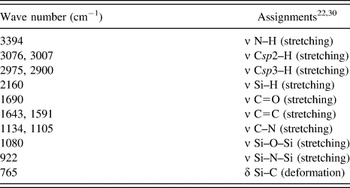
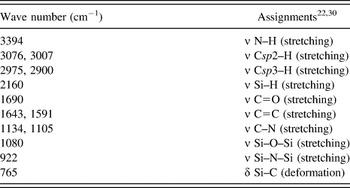
The FTIR spectra of the as-synthesized preceramic polymer precursors and the corresponding precursors (PHMS and N-containing compounds) are shown in Fig. 1 and the main absorption bands of the spectra are listed in Table II. In the case of the PHMS/TMTVSLZ precursor [Fig. 1(a)], the FTIR spectrum shows the presence of Si–O (1090 cm−1), Si–N (922 cm−1), Si–C (770 cm−1), and N–H (3405 cm−1) peaks confirming the combination of the polysiloxane and the silazane units in the starting materials. In the PHMS/TA precursor [Fig. 1(b)], the simultaneous presence of Si–C, Si–O, and C–N (1141 cm−1) peaks shows the incorporation between PHMS and TA. For the PHMS/TTT precursor [Fig. 1(c)], the spectrum shows absorptions of Si–O, C=O (1697 cm−1), and C–N (1109 cm−1) peaks indicating the incorporation of TTT into the polysiloxane matrix. In all the FTIR spectra, the disappearance of –CH=CH2 groups (H–Csp 2 peak at 3053 cm−1and C=C peak at 1596 cm−1) and a considerable decrease in the intensity of Si–H peak at 2168 cm−1 suggest the occurrence of the hydrosilylation reaction.
FTIR spectra of the preceramic polymer precursors: (a) PHMS/TMTVSLZ, (b) PHMS/TA, and (c) PHMS/TTT. The FTIR spectra of the PHMS precursor and the N-containing compounds are also shown.

Main FTIR absorptions of the three as-synthesized polymer precursors.
2. NMR
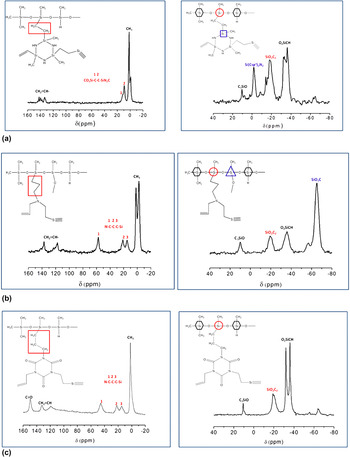
Figure 2 shows the 13C and 29Si MAS-NMR spectra recorded for the preceramic samples. Figure 2(a) shows the spectra recorded for the PHMS/TMTVSLZ sample. The 13C spectrum [on the left side of Fig. 2(a)] shows the peaks at ∼0 ppm, due to the CH3 groups in the starting PHMS and TMTVSLZ, and the peaks at 133.1 and 139.9 ppm, due to residual vinyl groups in the TMTVSLZ. More importantly, carbon atoms belonging to the CH2 groups of the new Si–CH2–CH2–Si bridge formed through the hydrosilylation reactions give rise to the peak at δ = 9 ppm with a shoulder at δ = 9.5 ppm. Reference El Nahhal, Chehimi, Cordier and Dodin31,Reference Seitz, Bill, Eggerb and Aldinger32
13C and 29Si NMR spectra of the preceramic polymer precursors: (a) PHMS/TMTVSLZ, (b) PHMS/TA, and (c) PHMS/TTT.

The 29Si-NMR spectrum on the right side of Fig. 2(a) shows the peaks due to the Si sites in the precursors at the chemical shifts of −35.8 ppm (O2SiCH) and 10.7 ppm (C3SiO). Reference Dibandjo, Diré, Babonneau and Soraru33 The spectrum also contains two new peaks at the chemical shifts of δ = −17.9 ppm and δ = −1.6 ppm which can be assigned to SiO2C2 (Ref. Reference Dibandjo, Diré, Babonneau and Soraru33) and Si(Csp 3)2N2, respectively. Reference Seitz, Bill, Eggerb and Aldinger32,Reference Choong Kwet Yive, Corriu, Leclercq, Mutin and Vioux34 These two new peaks are resulted from the hydrosilylation reaction that was previously revealed by the 13C NMR spectrum.
Figure 2(b) shows the spectra recorded for the PHMS/TA sample. On the left side of Fig. 2(b), the 13C-NMR spectrum shows the peaks at the chemical shifts of −2.4 ppm and 1.9 ppm which are characteristics of the CH3 units in the starting precursors. Reference Dibandjo, Diré, Babonneau and Soraru33 The spectrum also displays the peaks at 117.6 and 137.4 ppm, corresponding to the residual vinyl groups in the TA. Especially, the spectrum shows three methylene carbon signals (δ = 15.2, 21.5, and 57.3 ppm) which suggest the formation of the Si–C–C–C–N bridge via the hydrosilylation reaction. Reference El Nahhal, Chehimi, Cordier and Dodin31,Reference Pohl, Dračínský, Slavětínská and Buděšínský35 The 29Si-NMR spectrum on the right side of Fig. 2(b) shows the Si units in the starting precursor at the chemical shifts of −35.6 ppm (O2SiCH) and 10.1 ppm (C3SiO). The spectrum also indicates two Si signals which belong to SiO2C2 units (δ = −19.2 ppm) and SiO3C units (δ = −64.9 ppm). Reference Dibandjo, Diré, Babonneau and Soraru33 The presence of SiO3C units is resulted from the hydrolysis of Si–H bonds with the moisture from the atmosphere.
Figure 2(c) shows the spectra recorded for the PHMS/TTT sample. On the left side of Fig. 2(c), the 13C-NMR spectrum shows the peak at 149.5 ppm due to the C=O bonds, the peaks at 132.7 and 119.4 ppm due to the vinyl groups and the peak at 2.4 ppm due to CH3 units which are retained from the precursor. Reference Pham, Kim, Lim, Park, Yang and Lee36 Besides, the spectrum displays three peaks at the chemical shifts of δ = 14.9, 21.57, and 45.9 ppm which are indicative of the three new methylene carbon signals formed through the hydrosilylation reaction. The 29Si NMR spectrum on the right side of Fig. 2(c) shows not only the Si peaks in the precursor, −36.2 ppm (O2SiCH) and 10.4 ppm (C3SiO), but also the new SiO2C2 units at the chemical shift of δ = −19.4 ppm. The 29Si NMR results are consistent with the 13C NMR data confirming the occurrence of the hydrosilylation reaction.
It should be pointed out here that the 13C-NMR spectra of all the three as-synthesized precursors show residual vinyl groups because of steric hindrance resulting in an incomplete hydrosilylation reaction.
3. TGA
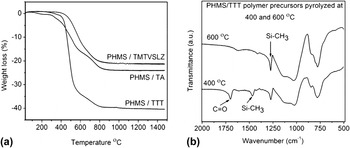
The TG curves shown in Fig. 3(a) clearly indicate that ceramic yield depends on the structure of the preceramic polymer precursors. The PHMS/TMTVSLZ gel exhibits not only the highest ceramic yield (79%) but also the highest onset degradation temperature (400 °C). It can be due to high thermal stability of the Si–C, Si–O, and Si–N bonds in the cross-linked polymer. The PHMS/TA gel shows a slightly less ceramic yield (76%), and the weight loss process starts at about 120 °C, at which the evaporation of some low molecular weight molecules can take place. The PHMS/TTT gel shows the lowest ceramic yield (60%) but the onset temperature for the degradation process is found to be at about 280 °C. The major difference in the mass loss pathway of these polymer precursors occurs between 400 and 600 °C. In detail, about 12% of mass loss was recorded for the first two precursors, PHMS/TMTVSLZ and PHMS/TA, from 400 to 600 °C. In contrast, a significant mass loss of 32% was observed for the PHMS/TTT precursor in this temperature range. A possible explanation for this high mass loss could be the elimination of the heavy CO groups from the TTT precursor. This hypothesis is supported by the FTIR analysis shown in Fig. 3(b) where the C=O peak was vanished by increasing the temperature from 400 to 600 °C while the Si–CH3 moieties belonging to the siloxane chain are still present up to 600 °C.
(a) TGA of the three preceramic polymer precursors in nitrogen, and (b) FTIR of the PHMS/TTT precursor pyrolyzed at 400 and 600 °C.

B. Characterization of the Si(N)OC ceramics
1. Elemental analysis
The chemical analysis on O, C, and N has been performed on the samples pyrolyzed at 800 °C. The results are reported in Table III. Assuming that H is a minor component and therefore its content can be safely disregarded, the Si content is calculated as a difference to 100 wt%. According to the TGA results [Fig. 3(a)], no significant mass loss is observed at temperature above 800 °C. Thus, the chemical composition of the ceramic samples measured at 800 °C does not remarkably vary up to 1400 °C, in agreement with the elemental analysis performed for the same samples pyrolyzed up to 1400 °C. Reference Nguyen, Zanella, Bettotti and Soraru10 The comparison of the experimental N/Si atomic ratio values measured for the ceramic samples with the corresponding values of the starting precursors can be taken as an indication of the ability of the polymer precursor to retain N during pyrolysis. Accordingly, in the case of the PHMS/TMTVSLZ-derived sample, N is retained in large amount, ∼54%, compared to the calculated content in the initial precursor. The reason could be due to the stability of Si–N bonds in the precursor. On the other hand, the Si(N)OC sample derived from the PHMS/TA contains very low N, ∼18%, with respect to the initial amount calculated for the precursor. The low thermal stability of N–Csp 3 bonds in the TA can be a reason for the release of nitrogen. Another possible explanation for the low residual content of N in the PHMS/TA-derived ceramic is related to the oxygen content in the precursor. Essentially, N and O atoms are bonded to Si atoms in the ceramic structure. The number of Si atoms in the ceramics is the same as in the precursors because the loss of Si during pyrolysis can be safely neglected. Therefore, an increase in the O content in the ceramic, shown in Table III, would induce a decrease in the residual amount of N. Interestingly, the PMHS/TTT-derived sample still retains ∼30% of the N content compared to its precursor. The stability of the bonding between N and two Csp 2 in this precursor could be a possible explanation for the better capability of retaining nitrogen in the pyrolyzed sample compared to the PHMS/TA precursor. Reference Tang, Bando, Golberg and Xu37

2. XRD
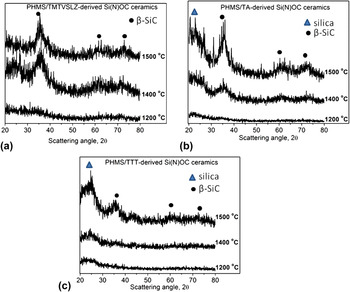
Crystallization tendency of the studied ceramics was investigated by XRD analysis. The XRD patterns of Si(N)OC ceramics pyrolyzed at 1200, 1400, and 1500 °C are shown in Fig. 4. All the ceramic samples pyrolyzed at 1200 °C are x-ray amorphous. At 1400 °C, the PHMS/TTT-derived ceramic is still x-ray amorphous while the PHMS/TMTVSLZ and PHMS/TA-derived samples show broad diffraction peaks indicating the onset of the crystallization process. At 1500 °C, all the ceramic samples show crystallinity evidenced by broad diffraction peaks at 2θ = 35.7°, 60.4°, and 72.6°. These peaks are characteristics of nanocrystalline β-SiC. According to Scherrer equation, an average crystallite size for β-SiC is calculated to be in the range of 3–5 nm.
XRD patterns of the Si(N)OC ceramics derived from (a) PHMS/TMTVSLZ, (b) PHMS/TA, and (c) PHMS/TTT.

The x-ray diffraction study shows the following differences among the three samples: (i) for the PHMS/TA and PHMS/TTT compositions, a broad halo at 2θ = 22° which is clearly visible in the diffraction patterns is assigned to the amorphous silica-based network; (ii) at 1500 °C, the intensity of the diffraction peaks of the PHMS/TMTVSLZ and PHMS/TA-derived ceramics is higher than that of the one derived from PHMS/TTT. This last experimental result indicates that the TTT-derived Si(N)OC amorphous ceramic is more resistant toward β-SiC crystallization than the other two systems; (iii) the crystallization of Si3N4 is not observed for the studied ceramics.
3. FTIR and 29Si-NMR
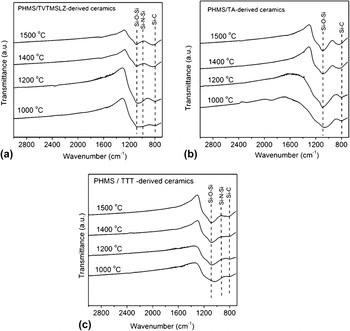
To better understand the phase separation and the SiC crystallization occurring within the ceramics at high temperature, FTIR spectra of all the studied ceramics pyrolyzed at 1000, 1200, 1400, and 1500 °C were recorded and are shown in Fig. 5. The spectrum of the PHMS/TMTVSLZ pyrolyzed at 1000 °C [Fig. 5(a)] shows very broad peaks which could be assigned to the coexistence of Si–O, Si–N, and Si–C bonds. Reference Schiavon, Ciuffi and Yoshida22 At 1200 °C, the peaks due to Si–O and Si–C bonds become more distinct while the intensity of the Si–N absorption peak at approximately 920 cm−1 decreases suggesting that a phase separation process of the amorphous ceramic network starts at this temperature. From 1200 up to 1500 °C, the FTIR spectra do not show any significant modification of the ceramic structure.
FTIR spectra of the ceramics pyrolyzed at 1000, 1200, 1400, and 1500 °C: (a) PHMS/TMTVSLZ, (b) PHMS/TA, and (c) PHMS/TTT.

The FTIR spectra [Fig. 5(b)] of the PHMS/TA-derived ceramics show, similarly to the TMTVSLZ-derived samples, two main components due to Si–O and Si–C bonds. The main difference of this system with the other two is the absence of the Si–N related absorption around 920 cm−1. This finding is in good agreement with the chemical analysis, which indicates that N is present in a very low amount (0.5 wt%) for this composition.
The FTIR spectra of the PHMS/TTT-derived ceramics in Fig. 5(c) show that increasing pyrolysis temperature does not result in a remarkable structural modification. The absorption band due to Si–C peaks appears as a very small and broad peak in all the spectra. It is due to the fact that the PHMS/TTT-derived ceramics remain amorphous up to 1400 °C and show low crystallinity of SiC even at 1500 °C.
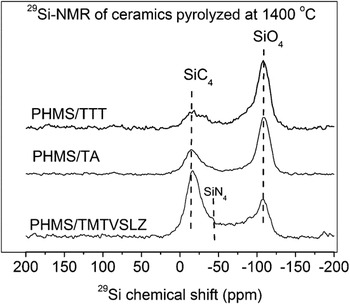
The XRD patterns indicate that the major difference in the structure among the studied ceramics occurs at the pyrolysis temperature of 1400 °C. To have more supportive information for this observation, 29Si MAS-NMR characterization was performed for all the ceramics obtained at 1400 °C (Fig. 6). The NMR spectra show for all the three systems the presence of two main peaks at approximately −15 and −108 ppm, which are assigned to SiC4 and SiO4 units, respectively. This result shows that the phase separation of the amorphous Si(N)OC network into SiC-rich and SiO2-rich domains has already taken place at this temperature in all the three studied systems. The PHMS/TMTVSLZ-derived ceramic shows a quite defined peaks at δ = −16.9 ppm (SiC4) and at −108.4 ppm (SiO4). SiN4 units, which should give rise to a component at −48 ppm, cannot be clearly seen. For the TA- and TTT-derived Si(N)CO systems, the silica peak at −108.4 ppm is also well defined. On the other hand, the SiC4 resonance becomes less intense and broadens for the TA- and TTT-derived systems. Indeed, the intensity ratio between SiC4 and SiO4 peaks is higher than 1 for the PHMS/TMTVSLZ and drops below 1 for the other two samples. This result is in good agreement with the XRD and the FTIR analyses. Particularly, the contribution of the SiO4 units in the ceramic sample derived from the PHMS/TTT precursor is dominant. This is expected because the PHMS/TTT-derived ceramic remains amorphous at 1400 °C and the silicon carbide crystallization is not yet complete. Repeatedly, the 29Si-NMR spectra show a coincidence with the XRD data.
29Si NMR spectra of the ceramic samples pyrolyzed at 1400 °C.

4. XPS
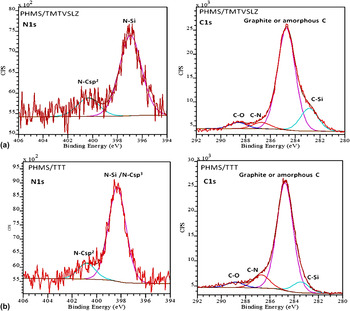
To understand the chemical nature, in particular, the chemical environment surrounding N atoms, XPS measurements were carried out for the two ceramic samples displaying the maximum N content, namely PHMS/TMTVSLZ and PHMS/TTT. The N(1s) and C(1s) XPS spectra recorded for the studied samples are shown in Fig. 7.
N1s and C1s XPS spectra of the ceramic pyrolyzed at 1000 °C from (a) PHMS/TMTVSLZ and (b) PHMS/TTT.

For the N1s core level in the XPS spectrum of the PHMS/TMTVSLZ system, on the left side of Fig. 7(a), the dominant peak at 397 eV is due to N–Si bonds. Reference Yamamoto, Koga and Fujiwara38 Interestingly, besides the major peak the N(1s) XPS spectrum shows another shoulder at higher binding energy (400.5 eV) which can be assigned to N–Csp 2 bonds. Reference Yamamoto, Koga and Fujiwara38,Reference Zhang, Fu, Liu, Liu, Wang and Liu39 It means that N atoms are mainly bonded to silicon atoms but also a smaller amount of nitrogen atoms form bonds with sp 2 carbon atoms of the free carbon phase. Whether these N–C bonds are part of the sp 2 carbon planes of the free carbon phase or form the interface between the free C and the amorphous Si(N)OC network is however, at present, not clear.
The C1s XPS spectrum of the same PHMS/TMTVSLZ sample, on the right side of Fig. 7(a), shows different chemical bonds for the C atoms with a broad range of binding energy between 282 and 290 eV. The main peak at 284.7 eV is assigned to C–C bonds in graphite or amorphous carbon. Reference Yamamoto, Koga and Fujiwara38,Reference Soraru, Andrea and Glisenti40 The presence of the free carbon phase in these two studied samples was previously reported by the means of Raman and elemental analysis. Reference Nguyen, Zanella, Bettotti and Soraru10 In the same spectrum, two shoulders are also present: at 283.5 eV, due to C–Si bonds and at 286.7 eV, due to Csp 2–N bonds, in agreement with the information obtained from the N(1s) XPS spectrum of the same sample. Reference Yamamoto, Koga and Fujiwara38,Reference Zhang, Fu, Liu, Liu, Wang and Liu39 The peak at 289.1 eV is tentatively attributed to CO type bonds. Reference Yamamoto, Koga and Fujiwara38–Reference Soraru, Andrea and Glisenti40
The N1s XPS spectrum recorded for the sample derived from PHMS/TTT (on the left side of Fig. 7(b) reveals two different chemical bonds of N atoms. The main peak at 398.3 eV can be assigned to N–Csp 3 bonds Reference Yamamoto, Koga and Fujiwara38 or mixed N–Csp 3/N–Csp 2 in pyridine-like structure. Reference Zhang, Fu, Liu, Liu, Wang and Liu39 However, it seems unrealistic to have only C–N bonds at such a high temperature (1000 °C). We propose that the higher binding energy of N atoms observed in this case in the N1s XPS spectrum compared to the PHMS/TMTVSLZ sample could be due to an increased proportion of N–C bonds which exist together with the N–Si bonds. Reference Mera, Navrotsky, Sen, Kleebe and Riedel41 Since the starting precursor does not contain N–Si bonds, they must have formed during the polymer-to-ceramic transformation. It is also worth to notice that N atoms exist in different chemical bonding environments in the two precursors, i.e., as HNSi2 in PHMS/TMTVSLZ- and (Csp 3)N(Csp 2)2 bonds in PHMS/TTT. This difference seems to be maintained in the final ceramics: indeed, the Si(N)OC obtained from the PHMS/TTT precursor shows more C–N bonds compared to the PHMS/TMTVSLZ one. The C1s XPS spectrum recorded for the same sample, on the right side of Fig. 7(b), shows the formation of similar chemical bonds of C atoms as in the PHMS/TVTMSLZ sample. The incorporation of N atoms into the free carbon phase in the SiOC matrix could influence physical properties of the resulting Si(N)OC ceramic. For example, the electrical conductivity of the PHMS/TTT-derived ceramics having a higher fraction of C–N bonds is higher than the values obtained for the samples derived from PHMS/TMTVSLZ at the same pyrolysis temperature. Reference Nguyen, Zanella, Bettotti and Soraru10
IV. CONCLUSIONS
Si(N)OC ceramics were successfully synthesized via polymer pyrolysis starting from different nitrogen-containing preceramic polymers. It was found that the structure of the polymer precursors influences the thermal stability, with respect to thermal degradation, crystallization tendency of the ceramics and structural rearrangement at high temperature. Interestingly, we found out that the nitrogen content and the chemical nature of the N atoms in the Si(N)OC ceramic samples can be controlled by the architecture of the as-synthesized precursors. In particular, we found that:
-
(1) The ability to retain N after pyrolysis depends on the type of bonds that N forms in the polymer precursor and follows the sequence N–Si > N–Csp 2 > N–Csp 3.
-
(2) Irrespectively from the type of polymer precursor, N–C bonds are present in the final ceramics, however, if in the preceramic polymer N is bonded to silicon the Si–N bonds are retained to a large extent in the pyrolysis product while if N, in the preceramic polymer, bonds with sp 2 carbon atoms forming N–Csp 2 bonds then a higher amount of C–N bonds are present in the Si(N)OC ceramic material.
ACKNOWLEDGMENTS
The present work was financially supported by European Community ITN7 through MC-ITN FUNEA-Project 26487. The authors would like to thank Dr. Emanuela Callone of the University of Trento, Italy and Wenjie Li of the Technical University of Darmstadt, Germany for kind assistance in NMR and elemental analysis measurements, respectively.