I. INTRODUCTION
Interest in actinide and lanthanide chemistry reflects the growing demand for nuclear energy and nuclear fuel reprocessing.Reference Fedosseev, Grigoriev, Budantseva, Guillaumont, Le Naour, Simoni, Den Auwer and Moisy1,Reference Weber, Ewing, Catlow, Diaz de la Rubia, Hobbs, Kinoshita, Matzke, Motta, Nastasi, Salje, Vance and Zinkle2 Understanding the thermodynamics, structure, and reaction mechanisms between rare earth (RE) elements and actinides is required to predict the behavior of uranium oxides as a nuclear fuel sources.Reference Cocalia, Gutowski and Rogers3–Reference Middleburgh, Parfitt, Grimes, Dorado, Bertolus, Blair, Hallstadius and Backman6 In addition, studies on different actinide separation schemes are vital to reprocessing efforts of nuclear waste in the US and other countries.Reference Weber, Ewing, Catlow, Diaz de la Rubia, Hobbs, Kinoshita, Matzke, Motta, Nastasi, Salje, Vance and Zinkle2,Reference Sickafus, Grimes, Valdez, Cleave, Tang, Ishimaru, Corish, Stanek and Uberuaga7 For the safe disposal of nuclear waste, knowledge of the basic system chemistry is also needed to predict radio nuclei escape from multibarrier repository systems and subsequent contamination of the environment.Reference Denecke8
Both the structure and electronic properties of the cations have been shown to play a very important role in the behavior of nuclear fuel. Theoretical chemistry and x-ray absorption near edge spectroscopy (XANES) have been used for the characterization of actinide–ligand bonds especially their frontier orbitals.Reference Fillaux, Den Auwer, Guillaumont, Shuh and Tyliszczak9,Reference Fillaux, Berthet, Conradson, Guilbaud, Guillaumont, Hennig, Moisy, Roques, Simoni, Shuh, Tyliszczak, Castro-Rodriguez and Den Auwer10 The valence state for uranium, specifically, the formal 2p-6d transition was probed by XANES multiedge experiments by several authors because of its convenient energy −17.2 keV.Reference Fillaux, Berthet, Conradson, Guilbaud, Guillaumont, Hennig, Moisy, Roques, Simoni, Shuh, Tyliszczak, Castro-Rodriguez and Den Auwer10 These studies focused on the change in the ionic radius of the cations.Reference Raymond, Wellman, Sgarlata and Hill11,Reference Xue, Verma and Shreeve12 Furthermore, several RE elements are high-yield fission products in UO2 nuclear fuel and they readily dissolve in the fluorite crystal structure  $\left( {Fm\bar 3m} \right)$. The cations are largely immobile, compared to oxygen in the crystal lattice of an (A, B)O2±x mixed oxide. A completely disordered (U, RE)O2±x may however transit to include some short-range ordering depending on exact thermodynamics.
Previously, it was found that solid solutions are easily formed between UO2 and REs oxides.Reference Ohmichi, Fukushima, Maeda and Watanabe13 The lattice parameter change of the U1−yREyO2.00−x solid solutions with stoichiometry led to the discussion of the role of oxygen vacancies in these materials.Reference Ohmichi, Fukushima, Maeda and Watanabe13 The heat capacity and thermodynamic properties of the initial oxides can be found in Ref. Reference Goldstein, Neilson, Walsh and White14 for Nd2O3, and in Refs. Reference Vălu, Staicu, Beneš, Konings and Lajarge15–Reference Guéneau, Dupin, Sundman, Martial, Dumas, Gossé, Chatain, De Bruycker, Manara and Konings19 for the UO2 and UO2-based oxides.Reference Matveeva, Grigoriev, Dvoryanchikova, Matveev, Safiulina, Sinegribova, Passechnik, Godovikov, Tatarinov, Mironov and Tananaev20–Reference Hou, Xu, Xing, Bai, Duan, Sun, Wei, Shi, Zhang and Xing23 The coordination model for the defect structure in hyperstoichiometric UO2+x was described in the Refs. Reference Sickafus, Grimes, Valdez, Cleave, Tang, Ishimaru, Corish, Stanek and Uberuaga7 and Reference Allen, Tempest and Tyler24. Recently, a new approach to model nuclear oxides in the environment was suggested assuming the existence of the miscibility gap at low temperature (<750 K) in the U–Nd–O phase diagram.Reference Desgranges, Pontillon, Matheron, Marcet, Simon, Guimbretiere and Porcher25 Desgranges et al.Reference Desgranges, Pontillon, Matheron, Marcet, Simon, Guimbretiere and Porcher25 argue that the formation of the miscibility gap may result in a competition between oxygen vacancy and U5+ cation formation to maintain the electroneutrality in (U, Nd)O2±x.
This model motivates our further experimental investigation of cation disorder in U1−yRyO2.00−x solid solutions. In this work, x-ray diffuse and diffraction methods are used to reveal information on the defect structure of aliovalent cation species in (U, Nd)O2±x. The goal of this work is to generate data to verify the chemical thermodynamic models of nuclear fuel used in the coupled meso- and continuum-scale fuel performance models under normal operating and accident conditions.
II. EXPERIMENTAL PROCEDURES
A. Samples preparation
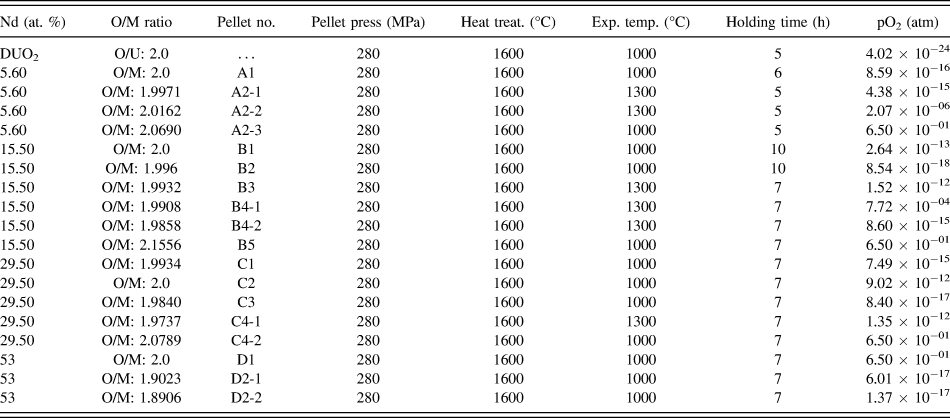
Four groups of samples with the following Nd concentrations were studied: Group A-5.6 at.%; group B-15.5 at.%; group C-29.5 at.%; and group D-53 at.% (Table I). A more detailed description of sample preparation can be found elsewhere,Reference Lee, Knigt, Voit and Barabash26 and we briefly describe the preparation conditions here. Each sample was pressed into a pellet at 280 MPa for 5 min. After pressing, the pellets were heated at 450 °C for 5 h to evaporate any residual moisture and then sintered in 4% H2–96% Ar mixture gas for 5 h at 1600 °C to form consolidated pellets.
Oxidation conditions for U1−yNdyO2−x.

The pellets were oxidized or reduced in the thermogravimetric analyzer (NETZSCH STA409 Simultaneous thermal analysis, Selb, Germany) to produce different O/M ratio by using different hydrogen gas mixtures at the experimental temperatures summarized in the Table I. Next, the pellets were ground using a mortar and pestle for the x-ray diffraction (XRD) test. The particle size of the ground powder was less than 50 µm [confirmed by transmission electron microscopy (TEM)]. Each sample described in Table I was sealed well after fabrication and kept being sealed until XRD test, to limit exposure to air. XRD measurements were performed at room temperature. Furthermore, the samples do not oxidize during the XRD measurements as UO2 is reasonably stable in the atmosphere at room temperature, and the measurements are rapid.
A co-conversion process was used to synthesize (U, Nd)O2±x reference materials for the thermochemical measurements. The metal elements were dissolved in a solution of dilute nitric acid and ammonium nitrate. The inorganic salt solution was fed into a heated rotary kiln where it decomposes and forms an ammonium nitrate–metal nitrate double salt: (NH4)zMOz(NO3)4·zH2O (M denotes the metals U and Nd).
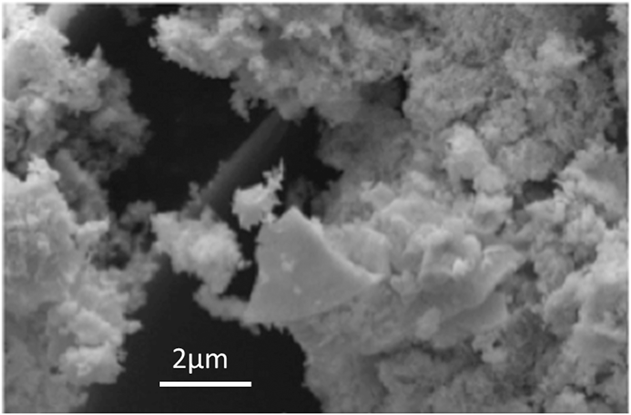
Decomposition occurs in three distinct steps: (i) dehydration of the ammonium nitrate–metal nitrate–hydrate double salt forms a tetranitrate, (ii) decomposition of the anhydrous tetranitrate, without melting, at 170–270 °C forms a trinitrate salt, (iii) decomposition of the trinitrate, without melting, at 270–300 °C yields an intimate mixture of amorphous UO3 and Nd2O3. Subsequent heating to >500 °C under a controlled partial pressure of oxygen causes reduction to (U, Nd)O2±x and crystallization of nanosized grains (see Fig. 1). Thermal treatment of the (U, Nd)O2±x powder at high temperatures produces a single fluorite phase solid solution. Samples for XRD analysis were prepared in a furnace under varied conditions of time, temperature, and oxygen potential to achieve the desired oxygen to metal ratios.
Fully reduced U84.5Nd15.5O2 powder.
Parameters of sample preparation (holding time and temperature for different U:Nd:O ratio) are summarized in Table I. A second group of four samples with O/M = 2 were prepared under the same conditions described above for synchrotron measurements with equal holding time for all samples.
B. Kinetics of oxygen adjustment
Oxygen adjustment may also cause some oxygen atoms to form a new layer at the surface of the crystal and diffuse into the material. Therefore, the oxygen adjustment kinetics in the U1−yNdyO2−x alloys is controlled by the diffusion processes of the oxygen and vacancies in the material. The holding time during adjustment should allow the oxygen and vacancies to penetrate through half of the sample, assuming that diffusion occurs from both surfaces of the pellet. The time, τ, for one dimensional diffusion can be roughly estimated from the equation:  $\left\langle {{x^2}} \right\rangle$ = 2Dτ, where D is the diffusion coefficient at the adjustment temperature,
 $\left\langle {{x^2}} \right\rangle$ is the mean square displacement of the oxygen anions or vacancies, and x is the mean depth from the surface of the pellet to the middle of the sample. Moreover to provide the equilibrium homogeneous oxygen distribution across the sample, the holding time should be further increased. Therefore, the holding time should be corrected for oxygen anions and vacancies to not only reach the midst of the sample but also to become homogeneous across the sample and for Nd/U cations to adjust to the change in oxygen vacancy concentration change. Experimentally, this time was determined by controlling the sample weight and giving enough time for weight value to saturate.
C. Diffraction measurements
Firstly, all samples were characterized by laboratory XRD measurements in reflection geometry using Rigaku diffractometer (Cu Kα x-rays). The second set of samples with O/M ratios equal to 2 was further studied with high-resolution XRD (HRXRD) and pair distribution function (PDF) analysis. HRXRD and PDF measurements were performed at the National Synchrotron Light Source, using beamline X17A. All synchrotron measurements were performed in transmission geometry with an amorphous silicon-based flat panel detector (Perken-Elmer) mounted orthogonal to the beam path and centered on the beam. The sample-to-detector distances and tilts of the detector relative to the beam were refined using a Nickel powder standard. The wave length of the incident x-rays was 0.1859 Å (66.66 keV). The sample-to-detector distance was calculated to be ∼208 mm (PDF) and 411 mm (XRD). Multiple patterns were collected on 16 different regions of each sample. The count time was adjusted to ensure maximum signal and minimize over-saturation of the detector (0.1 s for all samples) and each individual pattern consisted of 100 individual exposures. The two-dimensional images were then averaged together and radially integrated, to obtain the one-dimensional diffraction patterns. The scattering component from the kapton/air component was subtracted prior to the XRD analysis. The diffraction patterns collected with the PDF set-up were background corrected, normalized, and converted to atomic PDFs, G(r), over a Q-range of 1–25 Å−1. The XRD patterns were refined with the TOPAS (Bruker) software package. Two separate analysis procedures were performed on the synchrotron data sets. The first was a simple peak profile fitting procedure, where the full width at half maximum (FWHM) for nonoverlapping peaks was determined.
The second was a traditional two phase Rietveld refinement. For both analyses, the peak profiles were modeled by a modified Thompson–Cox–Hastings pseudo-Voigt profile function. For the Rietveld refinements, the instrument contribution to the broadening of the measured profiles was quantified by fitting a Ni NIST powder standard, with known crystalline-domain size and negligible strain contribution. The Gaussian and Lorentzian-based broadening parameters were subsequently fixed during the analysis of the samples under investigation. The patterns were refined assuming a two phase mixture of bulk UO2 with Nd atoms substitutionally located on the U sites and a nanophase of Nd:UO2. The lattice parameters, weight fraction, and domain size of the nanophase clusters were allowed to refine during the Rietveld refinements with the temperature factors nominally fixed to their bulk values taken from the literature.Reference Albinati, Cooper, Rouse, Thomas and Willis27 The O, U, and Nd site occupancies in the bulk UO2 matrix were allowed to vary during the fitting with the sum of the U and Nd atoms restrained to equal unity (U + Nd = 1). The occupancies of the U and Nd atoms in the nanophase were set to the respective stoichiometric values, with their sum equal to unity (U + Nd = 1). Allowing the occupancies of the U, Nd, and O atoms in the nanophase to refine resulted in poor fits and nonphysical parameters.
III. RESULTS AND DISCUSSION
A. Analysis of the FWHM
A typical XRD diffraction pattern collected from a group A sample is shown in Fig. 2. Enlarged peak profiles for several orders of (h00) type reflections are shown in Fig. 3 for samples A1, C1, and C3. The shape of the profiles of individual peaks (Fig. 4) reveals that a diffuse-scattering component is observed for all studied alloys. It is evident from the large changes in FWHM and the complicated shape of the intensity maxima (which sometimes split into several subpeaks), that in the A and C samples, the cation disorder is high before the oxygen adjustment. The overall FWHM for all studied samples is shown in Fig. 4 as a function of the Miller indices of the reflection:
 $$\sqrt {h_i^2} = \sqrt {{h^2} + {k^2} + {l^2}} \quad .$$
A typical diffraction pattern from sample (U + 5.6% Nd)O2.
Peak profiles for several orders of (h00) type reflections for group A and C. Dashed lines for (600) profiles mark the positions of the subpeaks and peak displacement.
FWHM for A, B, C, and D groups of sample for first 8 (hkl) peaks. Positions of the different (hkl) peaks are marked with dashed vertical lines. Left bottom frame indicates the (hkl) of the lines for convenience.
The analysis of the FWHM as a function of Miller indices (hkl) indicates that the FWHM does not monotonically increase with (hkl) as is expected for a single phase material without defects (Fig. 4). Instead highly anisotropic behavior is found which is consistent with regions (or clusters) with relatively high short-range order surrounded by a disordered region. In the first set of A, B, C, D samples with varying initial holding time, the smallest FWHM is observed for sample with higher initial holding time (group D), and the largest for A samples with the smallest holding time (Fig. 4). An increase of the FWHM correlates with structural heterogeneity and Nd cation disorder in the material. The reason for the higher structural disorder in samples from group A probably relates to insufficient holding time during the initial oxidation conditions (compare Table I) causing a heterogeneous distribution of Nd cations across the sample. Cation disorder does not vary significantly for sample group B which was subjected to longer initial holding time. This demonstrates that increasing the holding time improves the homogeneity of the Nd cations across the sample.
Samples prepared with equal initial holding times studied with synchrotron HRXRD show a systematic increase in the FWHM with the increasing Nd content (Fig. 5). This indicates that structural disorder increases with increasing Nd concentration in the alloy.
(a) HRXRD patterns for the UNdO A, B, C, and D samples for O/M = 2; (b) FWHM calculated from the synchrotron measurements at oxygen concentration equal to 2.0 for A, B, C and D samples prepared at equal initial holding time for all samples.
Figures 4 and 5 both show that there is an anisotropic broadening in the FWHM in the different hkl families, with more broadening along particular hkl directions, consistent with previous literature.Reference Mittemeijer and Welzel28–Reference Hutchings30 This behavior is typical for small clusters of ordered regions in a disordered matrix. The possibility of the coherent clusters formation agrees with earlier models.Reference Weber, Ewing, Catlow, Diaz de la Rubia, Hobbs, Kinoshita, Matzke, Motta, Nastasi, Salje, Vance and Zinkle2,Reference Middleburgh, Grimes, Desai, Blair, Hallstadius, Backman and Van Uffelen5,Reference Sickafus, Grimes, Valdez, Cleave, Tang, Ishimaru, Corish, Stanek and Uberuaga7,Reference Allen, Tempest and Tyler24,Reference Hutchings30
B. Size mismatch
Relative differences between the interatomic d-spacings of UO2 and U1−yNdyO2−x consistently increase with Nd concentration from sample group A to D (Fig. 6). The lattice parameter of the U1−yNdyO2−x alloys consistently decreases with increasing Nd concentration at M/O = 2 (Fig. 7). The atomic radius of a U atom is smaller than a Nd atom.Reference Hund and Peetz31 In the crystal lattice of each dioxide, and in the U1−yNdyO2−x alloy, the atoms can occupy two different sublattices: (*) U/Nd sublattice or (**) oxygen sublattice [Fig. 8(a)]. Larger Nd or U atoms occupy the corners and face centers in the cubic unit cell, while oxygen atoms are arranged in the centers of 8 cublets. The unit cell can thus be split into 8 subcells with an oxygen atom in the center. These two sublattices are not equivalent and they provide a coordination 4:8 in the U1−yNdyO2−x structure. This way at the U/Nd sublattice each atom is surrounded by 8 oxygen atoms, while at the oxygen sublattice each lattice site is in the center of a tetrahedron formed by U/Nd atoms. Moreover, the U1−yNdyO2−x compound is an ionic crystal with U/Nd ions bearing the “+”, and oxygen ions bearing the “–” charge.
Relative difference between the lattice parameter of U1−yNdyO2−x and UO2 for A, B, C, and D groups of samples.
Dependence of lattice parameter on Nd concentration for oxygen concentration equal 2.0.
(a) Random distribution of Nd atoms at the U sublattice. Larger Nd atoms (red) locally expand the lattice and “push” the near-neighbor oxygen atoms (green) forming the first neighbor shell and U atoms (blue) forming the second shell surrounding Nd atoms. Nd atoms create large distortions in the lattice, which are described with Kanzaki forces indicated by red arrows. (b) Fully ordered arrangement of Nd and U atoms at the U/Nd sublattice. (c) Early stages of phase separation result in the formation of the cluster or coherent precursor of the second phase in the UO2 matrix. A quarter of the layer is used in the out of plane direction and the unit cell is marked at all frames for convenience.
When Nd atoms are added to the UO2 to form U1−yNdyO2 alloys, the Nd atoms can substitute some of the U atoms at the U/Nd sublattice. The Nd has a 3+ charge state and will be sitting on a U 4+ state. Therefore, charge balancing defects are required in the form of U5+ smaller cations or oxygen vacancies. While oxygen ions are typically larger than the U5+ ions, the lattice relaxation around the oxygen vacancy causes it to be smaller than the substituted oxygen ion (see Sec. III. C). As such, both U5+ ions and oxygen vacancies can potentially cause a contraction in the lattice parameter.
Nd 3+ ions have a larger size than U4+ and U5+ ions (ΔV > 0). An Nd ion has a radius of 0.983 Ǻ, while U5+ and U4+ ions have Shannon radii of 0.76 and 0.89 Ǻ (respectively). Adding an U5+ and an Nd3+ radii together leads to an overall average change in radius of −0.02 per Nd3+ ion. This is almost 2.5x larger than the observed contraction in the lattice parameter (Fig. 7). This is an indication that the change in charge, from U4+ to U5+, is not the sole cause of the contraction in the lattice parameter, and that there should be an interplay with another mechanism resulting in the observed contraction of the lattice parameter. Due to the size mismatch between the Nd and U ions, the larger Nd atoms push the neighboring ions out of their regular positions, forming the so-called “Kanzaki forces”.Reference Krivoglaz32–Reference Stoller, Walker, Specht, Nicholson, Barabash, Zschack and Ice36 This will essentially create static displacements,Reference Barabash and Krivoglaz37–Reference Ice, Barabash and Liu39 lattice distortions, and increase the energy of the crystal [Fig. 8 (a)]. The completely random distribution of Nd atoms on the U/Nd sublattice is shown in Fig. 8(a). Depending on the parameters of the elastic interactions, the atomic arrangements in the solid solution can differ ranging from a fully ordered distribution of Nd and U atoms at the U/Nd sublattice [Fig. 8(b)], to early stages of phase separation with the formation of the coherent Nd-rich clusters [Fig. 8(c)] creating much larger distortions at the cluster/matrix interface. This supports the recently reported existence of the miscibility gap in the U–Nd–O phase equilibrium diagram and co-existence of the two phases.Reference Desgranges, Pontillon, Matheron, Marcet, Simon, Guimbretiere and Porcher25 The static distortions around the clusters, as well as vacancies, can also cause attenuation of the Bragg reflections and relate to the so-called “static Debye–Waller factor” (DWF). The attenuation of the peaks with different (hkl) values due to static DWF should increase with Miller indices of the reflection, h i, as  $\sqrt {h_i^2}$ of the reflection. The intensity, I, lost from the attenuated Bragg peaks appears as diffuse Huang scattering I H ∼ 1/q2 in the vicinity of each Bragg peak. Here, q = Q − G, where Q is the momentum transfer, and G is the nearest to Q reciprocal lattice vector. This decrease in scattering intensity is clearly visible in Fig. 5(a), with the addition of a diffuse-scattering component that increases with increasing Nd concentration. Different stoichiometries of the cubic Nd–U–O can be also formed with the addition of Nd atoms, such as NdU3O9.51; Nd1.4U2.6O9.04; Nd1.99U2.01O8.35; Nd2.4U1.6O7.87; Nd2.81U1.19O7.39; Nd3UO7.17 with the corresponding lattice parameters 5.412; 5.416; 5.423; 5.426; 5.447; 5.448 Ǻ,40 although both XRD and HRXRD results given here do not identify such individual phases.
C. Vacancies
Vacancies are always present in certain concentrations in crystals at thermal equilibrium.Reference Stark41 For example, the equilibrium concentration of individual vacancies with temperature, T, follows the equationReference Krivoglaz42:
 $${c_{\rm{v}}} = {\rm{Exp}}{{\Delta {S_{\rm{v}}}} \over {{k_{\rm{B}}}}}{\rm{Exp}}\left( { - {{\Delta {H_{\rm{v}}}} \over {{k_{\rm{B}}}T}}} \right)\quad ,$$
where ∆S v, ∆H v, are the entropy and enthalpy of vacancy formation, and k B is Boltzman constant.
Vacancy formation increases the configurational entropy as vacancies can occupy any lattice site. Therefore, they are thermodynamically favorable despite an increase in the energy of the system.
The larger substitutional Nd atoms should typically expand the lattice leading to a larger lattice parameter. The experimental data shown here, however, display the opposite trend. As mentioned in the previous section, the formation of vacancies is one of the possible causes of the lattice contraction. The distortion fields surrounding the Nd atoms can be partially relaxed and elastic energy related to these distortions can be partially decreased if a vacancy will approach the larger Nd atom (Fig. 9) because the distortion fields from the larger Nd atom and from the vacancy partially compensate each other. Therefore, the probability of vacancy formation near the Nd atoms is much larger than near the U atoms. It may happen that a gain in the resulting elastic energy is even larger if two or more vacancies form near the Nd atom [Fig. 9(a)]. One possible explanation for this opposite trend is the non-negligible role of vacancies in the U1−yNdyO2−x substitutional solid solution. This possibility was also suggested by Ohmichi et al.Reference Ohmichi, Fukushima, Maeda and Watanabe13 The formation of oxygen vacancies in U1−yNdyO2−x may cause U and Nd cations to change their charge state. Sickafus et al.Reference Sickafus, Grimes, Valdez, Cleave, Tang, Ishimaru, Corish, Stanek and Uberuaga7 have previously shown that to obtain an oxygen–deficient fluorite structure, the 4+ cations should be replaced by aliovalent cations with (3+, 2+, and 1+) charges. To keep the electroneutrality of the material, this should be accompanied by the formation of oxygen vacancies. For the U1−yNdyO2−x, samples discussed here the formation of pyrochlore type (U2Nd2O7) complexes in the solid solutionReference Ohmichi, Fukushima, Maeda and Watanabe13,Reference Shannon43 may take place. Uncompensated local deviation from electroneutrality gives rise to charge density waves, which were observed in UO2 and similar materials.Reference Yun and Kim44–Reference Rice and Mele46 Charge density waves influence the anharmonicity, thermal conductivity, and phonon lifetime, which are of great importance for the performance of these materials.Reference Pang, Buyers, Chernatynskiy, Lumsden, Larson and Phillpot47
(a) Formation of vacancy or bi-vacancy near the Nd atom creates an “extra” space and allows the lattice to accommodate the larger substitutional Nd atom with much lower distortions. (b) Formation of the new layer of the material during oxygen adjustment.
D. Oxygen adjustment
The oxygen concentration adjustment also modifies the lattice parameters within each group of samples (Figs. 6 and 10). Lattice parameters and d-spacings also consistently decrease with oxygen concentration at all Nd concentrations, which agrees with previous observations by Ohmichi et al.Reference Ohmichi, Fukushima, Maeda and Watanabe13
Dependence of lattice parameter on oxygen and Nd concentration. Red—5.6%; Brown—15.5%; Green—29.5%; Blue—53%. Dashed lines are guides for eye.
For samples with oxygen concentrations equal to 2.0, (O/M = 2) (i.e., stoichiometric U1−yNdyO2) the lattice parameter dependence on the Nd concentration deviates from linearity for concentration of Nd approaching 50%. This is shown in Fig. 7 and demonstrates that the alloys do not exactly follow Vegard's law for highly concentrated solutions. The dependence of lattice parameter on both Nd and oxygen concentration for all groups of alloys is shown in Fig. 10. The lattice parameters and d-spacings consistently decrease with oxygen concentration at all Nd concentrations. For all sample groups, the contraction lattice parameter decreases with the increasing oxygen concentration. This behavior is again highly correlated to the formation of vacancies during oxygen adjustment. During oxygen adjustment, the alloy must remain neutral; otherwise, the electrostatic interaction energy will be too high. This implies that the numbers of vacancies formed at the oxygen sublattice and U/Nd sublattice [Figs. 11(b) and 11(c)], replacing positively and negatively charged ions should approximately correspond to a coordination ratio 8:4 = 2 and should be twice larger for oxygen sublattice. Moreover, the charge of the U4+ ions can further change to U5+. Allen et al.Reference Allen, Tempest and Tyler24 suggested that during the formation of hyperstoichiometric UO2+x the extra oxygen atoms may locate in the interstitial lattice sites forming dumbells along  $\left\langle {110} \right\rangle$ and
 $\left\langle {111} \right\rangle$ directions and accompanied by the formation of two vacancies. According to Ohmichi et al.Reference Ohmichi, Fukushima, Maeda and Watanabe13 “a U4+ ions substitute U5+ ions in holding the eight-coordination for cations”. Middleburgh et al.Reference Middleburgh, Grimes, Desai, Blair, Hallstadius, Backman and Van Uffelen5 stated that oxygen/vacancy clusters should form in stoichiometric and hypostoichiometric alloys while U5+ based cluster may dominate in hyperstoichiometric alloys until all extra interstitial oxygen atoms are exhausted. Park and OlanderReference Park and Olander48 suggested a defect model for UO2 that incorporates defect clusters (such as Willis defectsReference Willis49 and vacancy dimmers). Geng et al.Reference Geng, Chen, Kaneta, Iwasawa, Ohnuma and Kinoshita50 performed a comprehensive investigation of clustering in nonstoichiometric UO2±x. They specifically modeled the 2:2:2 WillisReference Willis49 clusters and showed a “unified way to understand the structure of Willis type clusters in UO2±x”.Reference Chakraborty, Tonks and Pastore51 HutchingsReference Hutchings30 came up with a model of the clusters based on the Frenkel pair with the vacancies located along the diagonal of the cluster. He considered the formation of Frenkel pairs at high temperatures and discussed the possibility of clusters formed by a combination of vacancies, interstitials, and relaxed ions in the ratio of 3:1:2 or 9:1:8.Reference Hutchings30 Ions surrounding the vacancy are pulled closer to the center of the vacancy, locally decreasing the crystal volume (∆V < 0) due to relaxation of the lattice caused by static displacements of the ions [Figs. 11(b) and 11(c)] and resulting in the negative average deformation of the lattice
 $\overline {{u_{ij}}}$ causing a shift of the XRD peaks. Vacancy formation-induced lattice relaxation affects both average unit cell size (measured by XRD), and the total volume of the crystal V. The total volume of the crystal will change by Nc v∆V v, where c v is the vacancy concentration; N is the total number of lattice sites in the corresponding sublattice; ∆V v is the volume relaxation due to a single vacancy and is different for the U/Nd and for the oxygen sublattices. If the number of lattice sites does not change during oxygen adjustment, the vacancy concentration introduced by this adjustment can be estimated as
 $- {{\delta {\rm{v}}} \mathord{\left/ {\vphantom {{\delta {\rm{v}}} {\rm{v}}}} \right. \kern-\nulldelimiterspace} {\rm{v}}} = c_{\rm{v}}$ and, for example, it is equal ∼0.18% for groups A, B, C when oxygen concentration increases from 2.0 to 2.08. For the D group samples, the vacancy concentration decreases by ∼0.15% when the oxygen concentration is adjusted from 2.0 to 1.9. This number does not include the equilibrium number of vacancies, which are always present in the thermodynamically stable concentration.Reference Stark41,Reference Krivoglaz42 Furthermore, vacancies can cluster and form bubbles, which can further impact the behavior of the fuel.Reference Chen, Chen, Sencer and Shao52 Molecular dynamics simulationsReference Zhang, Millett, Tonks, Bai and Biner18,Reference Chen, Chen, Sencer and Shao52,Reference Rest and Gehl53 show that the formation of such bubbles near grain boundaries can play an important role during the fission gas release in light water reactors.Reference White and Tucker54
Structure of the U1−yNdyO2.00−x unit cell: (a) UNdO2 unit cell; (b) vacancy at the U/Nd sublattice; (c) vacancy at the oxygen sublattice. Vacancy is shown with red dashed circle.
E. Nd–UO2 energetics from atomistic simulations
We have used atomistic modeling to further understand the effect of Nd addition and oxygen vacancies on the lattice parameter. The calculations were performed using the large-scale atomic/molecular massively parallel simulator code.Reference Plimpton55 The interatomic pair potentials were taken from Pirzada et al.Reference Pirzada, Grimes, Minervini, Maguire and Sickafus56 and Hanken et al.Reference Hanken, Stanek, Gronbech-Jensen and Asta57 We used a fluorite-structure 2 × 2 × 2 supercell containing 96 atoms for these calculations. The long-range electrostatic interactions were evaluated using Ewald summation. Periodic boundary conditions were applied in all directions, and the lattice parameter obtained for pure UO2 was 5.46 Å.
The increase in volume with the addition of Nd is expected due to the larger atomic size of Nd compared to U. The calculations show that there is a binding energy of 0.58 eV between the Nd atoms and the oxygen vacancy indicating their preference to sit next to each other.
Keeping in view the volume dependence shown in Fig. 10, the addition of Nd3+ to UO2 and oxygen off-stoichiometry can be elucidated from simulations. Nd3+ addition can be mediated by two possible defect reactions, i.e., (i) by oxygen vacancy formation mechanism and (ii) via U5+ charge compensation mechanism. In both mechanisms, point defects aggregate to form charge-neutral clusters, i.e.,  ${\left( {V_{\rm{O}}^{ \cdot \cdot }:2{\rm{Nd}}_{\rm{U}}^t} \right)^X}$ and
 $2{\left( {{\rm{U}}_{\rm{U}}^ \cdot :{\rm{Nd}}_{\rm{U}}^t} \right)^X}$, respectively. The two reactions leading to the clusters are represented via Kröger–Vink notation shown in the following equations.
 $${\rm{N}}{{\rm{d}}_2}{{\rm{O}}_3} + {\rm{O}}_{\rm{O}}^X + 2{\rm{U}}_{\rm{U}}^X \to {\left( {V_{\rm{O}}^{ \cdot \cdot }:2{\rm{Nd}}_{\rm{U}}^t} \right)^X} + 2{\rm{U}}{{\rm{O}}_2}\quad ,$$
 $${\rm{Nd}}_2 {\rm{O}}_3 + {\rm{O}}_{t}^ \″ + 2{\rm{U}}_{\rm{U}}^ \cdot \to \left( {U_{\rm{U}}^ \cdot :{\rm{Nd}}_{\rm{U}}^t } \right) + 2{\rm{UO}}_2 \quad .$$
Figure 12 shows the volume change due to point defects calculated via atomistic simulations. We find that an individual oxygen vacancy (1 Ovac in Fig. 13) leads to volume contraction, whereas an Nd atom leads to an apparent volume expansion (1 Nd). The oxygen volume contraction is consistent with previous ab intio calculations.Reference Aidhy, Liu, Zhang and Weber58 The volume expansion from the addition of individual Nd atoms is due to the larger atomic radius. When point defects are clustered together, the volume change via the two mechanisms have opposite effects, i.e.,  $2\left( {{\rm{U}}_{\rm{U}}^ \cdot :{\rm{Nd}}_{\rm{U}}^t} \right)$ cluster via vacancy mechanism leading to a volume expansion;
 $2\left( {{\rm{U}}_{\rm{U}}^ \cdot :{\rm{Nd}}_{\rm{U}}^t} \right)$ cluster via a U5+ charge compensation mechanism leading to a volume contraction. This result is consistent with previous studiesReference Middleburgh, Grimes, Desai, Blair, Hallstadius, Backman and Van Uffelen5,Reference Middleburgh, Parfitt, Grimes, Dorado, Bertolus, Blair, Hallstadius and Backman6 and illustrates that the U5+ charge compensation mechanism may also be responsible for the volume contraction observed in Fig. 7.
Volume change with respect to pure UO2 due to (1) individual oxygen vacancy, (2) individual Nd atom at uranium site, (3) charge neutral cluster containing 2 Nd3+ + 1 oxygen vacancy, and (4) charge neutral cluster containing 1 Nd3+ and 1 U5+. The volume contraction observed experimentally is due to the formation of  $\left( {{\rm{U}}_{\rm{U}}^ \cdot :{\rm{Nd}}_{\rm{U}}^t} \right)$ cluster.
Measured HRXRD (solid blue line) and Rietveld refined (red marker) for samples with oxygen concentration equal to 2.0.
Figure 12 also shows that increasing oxygen concentration in the hyperstoichiometric region further decreases lattice volume. This volume decrease due to addition of oxygen atoms has been previously studied by Andersson et al.Reference Andersson, Baldinozzi, Desgranges, Conradson and Conradson59 Using ab initio calculations, they showed that this volume decrease is due to formation of different phases, i.e., U4O9, U3O7, U3O8, and reaches the minimum volume at U2O5 phase. Thus, the experimental results in Fig. 10 on the hyperstoichiometric systems are also in agreement with simulations.
F. Rietveld refinement of high energy XRD and PDF analysis for O/M = 2
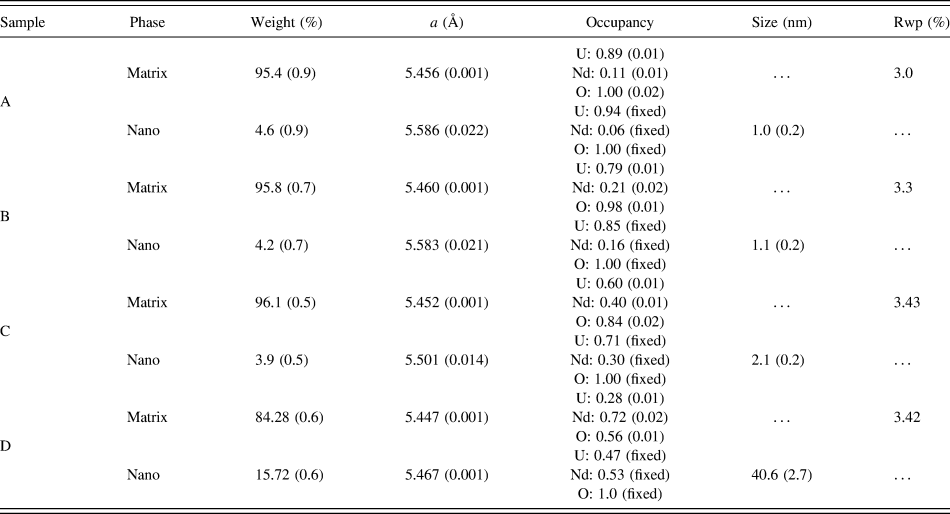
The comparison of the HRXRD patterns collected for the four O/M = 2 samples is shown in Figs. 5 and 13. The HRXRD patterns show several changes with increasing Nd content. These include an increase in the background and decrease in amplitude of the UO2 peaks with increasing Two Theta. No other characteristic peaks from secondary phases can be identified in the observed patterns, although the peaks for the 29.5 and 53.0 % Nd samples shown considerable line broadening and change in peak heights as shown from the profile fitting results in Fig. 13. Like the laboratory results, the synchrotron measurements for the high Nd concentration samples indicate that increasing Nd concentration promotes an increase in the vacancy concentration and potentially the formation of small clusters with increasing Nd concentration. The two component Rietveld refinements are shown in Fig. 13 and the quantitative results are given in Table II. Several trends in the site occupancy, consistent with discussion above can be seen in these results. These include the occupancy of the O atoms steadily decreasing while the refined Nd fraction increases with increasing Nd concentration, indicating that Nd does indeed promote the formation of O vacancies.
Synchrotron XRD Rietveld refinement results for the samples prepared with oxygen concentrations equal to 2.0.
The small refined fractions of the nanophase in the A–C samples also indicate that clustering is only very minor in these samples. Sample D, however, shows the largest nanocomponent with UNdO clusters of ∼41 nm in size. We note that the Nd and U occupancies retuned from the Rietveld analysis are potentially correlated, and the ambiguity in the comparison between the nominal refined and fabrication values may thus be due to the limited resolution of the experimental set-up. HRXRD analysis may be of interest in the future to ascertain the U and Nd occupancies.
Figure 14(a) shows the reduced total scattering structure functions F(Q) for the four samples measured. Dampening of the high-Q component with Nd concentration is observable, (most noticeable in the 29.5 and 53.0 % Nd sample). The large increase in the diffuse-scattering component is indicative that higher Nd concentrations lead to an increase in disorder [compare the amplitude of red and blue lines at Fig. 14(a)]. The resulting PDFs for the four samples are shown in Fig. 14(b). Qualitatively, the structure among all samples appears very similar. Information about bond length and bond angle changes can be further extracted from PDF analysis.Reference Proffen and Billinge60,Reference Perdew and Wang61 Moreover, the peak width analysis relates to the correlated atomic displacements.Reference Proffen, Billinge, Egami and Louca62 Upon detailed inspection, there appears to be a slight shifting (and/or asymmetry) of the peaks to lower radial distance with higher Nd concentrations. This apparent bond length contraction is consistent with the lattice contraction observed above. The peak widths also broaden with increasing Nd concentration, again revealing a higher disorder in the concentrated solid solutions described with pair and higher order correlations similar to the Ref. Reference Nicholson, Barabash, Ice, Sparks, Lee Robertson and Wolverton63. Both the peak broadening and shifting of the PDFs could potentially be attributable to the multiple environments quantified from the diffraction analysis above. The combination of the matrix (with contacted unit cell) and the nanophase (that increases with Nd concentration) will both result in U–O and Nd–O bond distances dissimilar to the original undoped local structure.
(a) Reduced structure functions for the UNdO samples; (b) atomic PDF's for the UNdO samples with oxygen concentration equal to 2.0 series. The atomic pairs labeled for reference.
IV. CONCLUSIONS
The most important findings and conclusions of this study can be summarized as follows:
(1) The lattice parameters and d-spacings consistently decrease with Nd concentration.
(2) The lattice parameters and d-spacings consistently decrease with oxygen concentration at all Nd concentrations.
(3) The lattice parameter-dependence with Nd concentration for high-concentrations of Nd deviates from the Vegard's law even at oxygen concentration equal 2.0 corresponding to stoichiometric (U1−yNdy)O2 compositions.
(4) An increase in the initial holding time improves the homogeneity of Nd cations distribution across the pellet.
(5) At high Nd concentrations, the formation of a nanocrystalline (U1−yNdy)O2 component is observed.
(6) The positive binding energy between Nd and oxygen vacancy as well as the formation of U5+ charge compensation lead to a contraction in the lattice parameter, as observed experimentally. Therefore, both a U5+ charge compensation mechanism together with vacancy formation is responsible for the observed volume contraction.
ACKNOWLEDGMENTS
Research is sponsored by the Department of Energy Office of Nuclear Energy, Fuel Cycle Research and Development Program. The calculations (DSA) were supported by the U.S. Department of Energy, Office of Science, Basic Energy Sciences, Materials Sciences and Engineering Division. The National Synchrotron Light Source at Brookhaven National Laboratory is supported under U.S.D.O.E. Grant No. DE-AC02-98CH10886.