Introduction
Generation of heat by ohmic losses limits performance and lifetime of light-emitting diodes (LEDs). Due to the high bandgap voltages GaN-based devices are subject of especially severe ohmic heating. Increased temperature reduces quantum efficiency and enhances diffusion of impurities (e.g. dopands, contact metals) as well as migration of dislocations [Reference Sugiura1].
UV-emitting InGaN-MQW LEDs, grown by low pressure MOVPE on sapphire substrates, are investigated regarding their junction temperature at different injection currents. Temperature distributions are determined by E2 phonon scattering (Raman), spatially resolved μ-EL, and finite element simulations. Influences of substrate thickness (sapphire) and material (sapphire/SiC) on device temperatures are studied.
Experimental
Our UV-LEDs show narrow single peak emission at about 410 nm. A buffer layer of 2 μm undoped GaN is followed by 1 μ m Si-doped GaN. The active region consists of a 4 × InGaN/GaN (1.5 nm/5.5 nm) quantum well structure followed by a Mg-doped Al0.08Ga0.92N electron barrier and 300 nm p-GaN cladding layer. In the Mg-doped GaN we have free carrier concentrations of p=2-3 × 1017 cm−3 in the Si-doped GaN of n=5 × 1018 cm−3. A circular mesa is structured by chemically assisted ion beam etching. Contacts consist of an evaporated Ni/Au metallization with an inner circular area as p-contact and a surrounding n-contact. These devices have series resistances of approximately 30 Ω. For measurements they are diced into pieces with a size of some 800 μm × 1800 μ m and mounted on teflon or metal heat sinks.
Operation of these LEDs on a temperature controlled heat sink displays impressively the problems aligned with temperature creation: Output power decreases exponentially with increased heat sink temperature (Figure. 1), since the internal quantum efficiency is depending almost exponentially on temperature according to equation (1) approximated for higher temperatures.

Temperature dependence of output power showing the almost exponential decrease of light output with increased temperature.

with ηi ,τi , n, p, N i, Ei being the internal quantum efficiency, the lifetime, hole and electron concentration, concentrations and energies of radiative and non-radiative recombination mechanisms. The indices t and r account for trap and radiative related transitions.
The temperature of a LED can be derived from the emission spectrum with a fit using several fitting parameters [Reference Zolina, Kudryashov, Turkin and Yunovich2], it is also possible to exploit only the short wavelength slope near the maximum of the EL spectrum for temperature determination according to reference [Reference Yunovich, Kudryashov, Turkin, Kovalev and Manyakhin3].
Full fits on μ-EL spectra are applied to get a spatially resolved picture of the temperature distribution. The backside emission of a LED was therefore spectrally and spatially mapped through the sapphire substrate. Figure 2 shows the integral EL intensity and wavelength distribution of a LED driven with a current density of 91 A/cm2. The elevated current density beneath the p-contact is reflected by an increased temperature. A heat drain effect by the bondwire can be seen in a reduced redshift. Details are published in [Reference Fischer, Christen, Zacharias, Schwegler, Kirchner and Kamp4].
Temperature distribution derived at different points from μ-EL (current density j=320 A/cm2), the redshift beneath the p-contact is due to increased temperature resulting from higher current density, the reduced redshift beneath the bond wire is due to heat drain effect. For an extended discussion of measuring method and results cf. [Reference Fischer, Christen, Zacharias, Schwegler, Kirchner and Kamp4]

Temperature determination with Raman measurements makes use of the phonon shift. From the relative shift of the GaN E2-phonon frequency of a LED under operational current with respect to the frequency at zero current, the temperature of the device can be computed. A detailed description of this measurement method is given in reference [Reference Link, Bitzer, Limmer, Sauer, Kirchner, Schwegler, Kamp, Ebling and Benz5]. A spot diameter of 0.7 µm permits high spatial resolution.
Results of Raman measurements are depicted in Figure 3 in comparison with data obtained from high energy slope fits of EL spectra. In good agreement, both methods reveal temperatures of about 415 K already at moderate currents of 30 mA.
Temperature of LEDs under operation, LEDs mounted on teflon heat sink. Comparison of temperatures derived from EL and Raman measurements. In good agreement, both methods yield temperatures as high as 415 K even at moderate currents of 30 mA.

Simulation
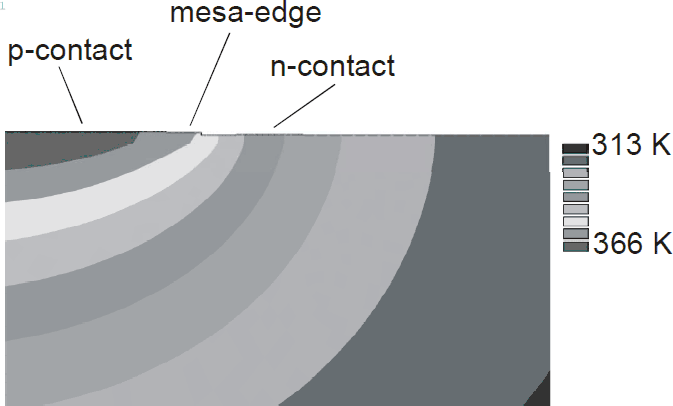
The finite element calculations for temperature distributions in LEDs are done using ANSYS, a well established commercial simulation program which is widely used for simulations of mechanical and electrical problems. Its capabilities include a combined thermal-electrical solver employing all linear effects and non-linear thermal transport properties. The simulations include the material parameters of GaN, InGaN, AlGaN, Al2O3, SiC and Ni/Au as contact materials. Temperature dependence of thermal conductivity, carrier concentration (particularly thermally depending Mg acceptor ionization), carrier mobility, and contribution to thermal conductivity from free carriers have been incorporated into the model. To account for our particular problem the geometry and electrical IV-characteristics of the LEDs are included. There are no fitting parameters within the simulation. Besides the mentioned material and device parameters the only input is the backside temperature serving as a boundary condition. This temperature has been measured with a thermal probe. The solver than returns a 3-dimensional distribution (with radial symmetry) of electrical and thermal profiles present in the LEDs under various injection conditions as well as in dependence of the boundary conditions, i.e. thermal contact and properties of the base to which the LEDs are mounted. Figure 4 shows a cross section of such a simulated temperature distribution. Surface temperatures drawn of simulations were compared to Raman data (Figure 5). A refined simulation is improved by implementing heat drain by bond wires. A good match of both methods could be obtained.
Cross section of temperature distribution in a LED under operational current of 63 mA mounted on metal heat sink obtained with finite element calculation. The elevated temperature beneath the p-contact is clearly visible.

Comparison of spatially resolved temperature profiles obtained from Raman measurements and finite element calculations. Operation conditions as in Figure 4. The data show good agreement of both methods. The impact of a bond-wire on device temperature is demonstrated.

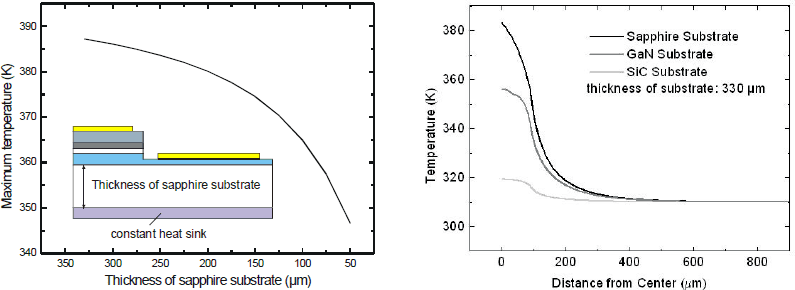
Considering the good agreement between simulation and experiment, we used ANSYS to calculate the influence of substrate thickness and material on temperatures in LEDs. Results are compiled in Figure 6. The simulations show strong impacts both of substrate thickness and material. Especially the improved heat transport through SiC substrates is clearly visible.
Device simulations with varied substrate thickness or material show the impact of the thermal conductivity of the substrate. Advantages of SiC are demonstrated.

Conclusions
Using Raman and EL measurements together with finite element calculations we obtained a coherent picture on temperature distribution in InGaN-MQW LEDs. The different approaches reveal good agreement both in absolute temperature and in spatial distribution. The operating current causes significant heating limiting the output power and lifetime of devices. Even for moderate currents our devices show strong heating. Most heat is generated beneath the p-contact. Temperature drain effects of bond wires can be detected and simulated. The good agreement of simulation and experiment allows the employment of simulation as a versatile tool for further improvement of devices.
Acknowledgements
The authors would like to thank P. Fischer, J. Christen, and M. Zacharias (Univ. Magdeburg) for the μ-EL measurements. Also we are grateful to A.E. Yunovich for the valuable discussions and assistance on fits of EL spectra. Financial support by German Ministry of Science and Education (BMBF) under Contract No. 01 BS 802 is gratefully acknowledged.