Introduction
Gryllus bimaculatus has a global distribution, spanning Africa, Asia and southern Europe (Ragge, Reference Ragge1972; Harrison & Bogdanowicz, Reference Harrison and Bogdanowicz1995). It is an eruptive insect with short-lived local peaks in numbers and much lower densities in between. Moreover, G. bimaculatus outbreaks are unpredictable in time and space, due to specific habitat requirements for egg and larval development. Oviposition sites need warmth and moisture (personal observation) and immatures cannot survive cold conditions (van Wyk & Ferguson, Reference van Wyk and Ferguson1995; Ferreira, Reference Ferreira2006). Ecological and climatic conditions, therefore, strongly modulate the population numbers of crickets. For instance, changes in weather systems probably led to mass migrations of G. bimaculatus from the West African coast towards the Atlantic ocean in 1969 (Ragge, Reference Ragge1972).
Intraspecific phylogeographical patterns have been studied within the context of hybridization between three closely related North American Gryllus species (G. firmus, G. pennsylvanicus and G. ovisopis). Broughton & Harrison (Reference Broughton and Harrison2003) found little geographical structure and no correlation between genetic distance and geographical proximity for the Ef1α, Cam and Cyt-c nuclear introns in G. firmus and G. pennsylvanicus. However, they argue that ancestral polymorphisms have persisted through the divergence of G. firmus, G. pennsylvanicus and G. ovisopis and that this rather than gene flow explains the observed deep coalescence of the nuclear loci. On the other hand, the COI-COII mtDNA gene revealed substantial intraspecific genetic structure in G. firmus and G. pennsylvanicus with both species having a north-south split (Willet et al., Reference Willett, Ford and Harrison1997). These authors suggested that, although contemporary gene flow accounted for intraspecific patterns of allele frequency variation, the distinctness of mtDNA haplotypes between northern and southern clades argued against the gene flow hypothesis. Phylogeographical analyses can give fundamental insights to understanding geographical variation in morphological as well as behavioural traits across taxa. For instance, after clinal variation had been observed in the advertisement call of the túngara frog, Physalaemus pustulosus, genetic analyses by Ryan et al. (Reference Ryan, Rand and Weigt1996) suggested that call similarities between populations located close to each other were due to gene flow or through a common ancestor. Ferreira & Ferguson (Reference Ferreira and Ferguson2002, unpublished data) found significant geographical variation in the calling song, as well as morphological traits, of G. bimaculatus. In order to glean a better understanding of the underlying mechanisms contributing to this geographical variation, it is necessary to quantify the degree of gene flow, as well as possible historical geographical differentiation, for several populations of G. bimaculatus.
In this study, we aim to determine geographical variation in cytochrome b (cyt b) mtDNA sequences in G. bimaculatus from South Africa, Spain and Italy, to use several techniques to estimate gene flow and migration rates between different geographical areas in South Africa and Europe and, lastly, to infer historical biogeographical processes for explaining the observed genetic variation.
Materials and methods
Sampling localities and genomic DNA extraction
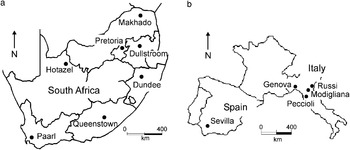
Male crickets were sampled from 2000 to 2003 at seven localities in South Africa (fig. 1a; Dullstroom: 25° 5′S, 30° 00′E; Dundee: 28° 15′S, 30° 23′E; Hotazel: 27° 14′S, 22° 57′E; Makhado: 23° 05′S, 29° 59′E; Paarl: 33° 14′S, 18° 56′E; Pretoria: 25° 41′S, 28° 13′E; Queenstown: 31° 52′S, 26° 52′E) and two regions in Europe (fig. 1b; Italy, Spain Cota Donãna). The Italian sample comprised four males from Genova (44° 24′N, 8°54 ′E), two from Modigliana (44° 8′N, 11° 46′E) and one each from Peccioli (43° 32′N, 10°43 ′E) and Russi (44° 22′N, 12° 1′E). Due to few animals from each locality in Italy, they were treated as a single Italian sample. The Spanish sample comprised 20 males from Sevilla (37° 24′N, 6° 59′W). In total, 133 individuals from South Africa and 28 individuals from Europe were sequenced. Crickets were stored at −70°C until DNA was extracted from tarsi using 5% Chelex 100® (Walsh et al., Reference Walsh, Metzger and Higuchi1991) and stored at −20°C.
Map of sampling locations of Gryllus bimaculatus in (a) South Africa and (b) Europe.

PCR amplification and sequencing
Species-specific forward 197F: 5′GTTGGACGTGGAATATATTA3′ and reverse 925R: 5′GCACCGATTCAAGTTAATAA3′ primers were designed to amplify a 728 bp fragment of the cyt b gene. Polymerase chain reaction (PCR) was performed using a GeneAmp system 2400 thermal cycler (Perkin Elmer Applied Biosystems) using a total reaction volume of 50 μl. Concentrations and volumes of the reagents for each amplification reaction were as follows: 1 μl of DNA template, 2.5 μl of each primer (10 pmol μl−1), 4 μl of dNTPs (2.5 mM), 5 μl of 10×buffer, 1 μl of Taq DNA polymerase (1 U μl−1; Biotools) and 34 μl of ddH20. Thermal cycling parameters were as follows: 20 s preheat at 96°C, one cycle of initial denaturation at 95°C for 20 s, annealing at 50°C for 25 s, extension at 72°C for 60 s and 39 cycles of denaturation at 95°C for 15 s, annealing at 49.5°C for 15 s, extension at 72°C for 50 s and one cycle of final extension at 72°C for 60 s and held at 5°C. Negative controls containing no DNA template were included in each set of amplification reactions. After checking PCR products on a 1.5% agarose gel, stained with ethidium bromide, they were purified using the High Pure PCR Product Purification kit (Roche Diagnostics Corporation) following the manufacturer's specifications.
All PCR products were sequenced in both directions. Purified DNA was cycle sequenced using a GeneAmp thermal cycler utilising 10 μl reactions, each of which comprised 2 μl of the Big Dye Terminator cycle Sequencing Ready Reaction kit (fourfold diluted; Perkin Elmer), 1 μl of 5×sequencing buffer, 1 μl of primer (3.2 pmol μl−1), 2–6 μl of DNA template and the remainder comprising ddH2O. The amount of DNA template and ddH2O used were determined by the PCR product yield. Conditions for thermal cycling were: 25 cycles of denaturation at 96°C for 10 s, annealing at 54°C for 5 s and extension at 60°C for 4 min and held at 4°C. Sequencing was performed on ABI Prism 377 and 3100 DNA Sequencers (Perkin Elmer). Sequence chromatograms were visualized using Chromas v1.43 (McCarthy, Reference McCarthy1996) and aligned and edited in Dapsa v4.9 (Harley, Reference Harley2000).
Testing for mitochondrial pseudogenes
Nuclear mtDNA pseudogenes have been found in several orthopteran species, namely Schistocerca gregaria (Zhang & Hewitt, Reference Zhang and Hewitt1996), and in ten species from the families Acrididae, Podisminae, Calliptaminae, Cyrtacanthacridinae and Gomphocerinae (Bensasson et al., Reference Bensasson, Zhang and Hewitt2000). Consequently, all cyt b sequences in this study were checked for characteristics consistent with mtDNA pseudogenes (Arctander, Reference Arctander1995), and each chromatogram was checked for double peaks at each nucleotide. Pure mtDNA of five individuals (two from Pretoria, one from a laboratory-reared colony, two from Sevilla) was extracted using a Cesium Chloride gradient (CsCl: Lansman et al., Reference Lansman, Shade, Shapira and Avise1981). For each individual, the cyt b gene was amplified and sequenced from purified mtDNA as described in the previous paragraph. These were aligned and compared to the genomic DNA extractions (Chelex extraction of Sevilla animals; Roche kit extraction of laboratory-reared and Pretoria animals, following manufacturer's specifications).
In order to verify that the mtDNA was free of nuclear DNA, the extracted pure mtDNA of each male was amplified using nuclear ribosomal primers (18sF and 5.8sR), yielding a 962 bp region of the ITS gene (Ji et al., Reference Ji, Zhang and He2003). It was assumed that a CsCl extraction of mtDNA contained no nuclear DNA if there was no PCR product using the ribosomal primers. Application of these primers to amplify genomic extractions (Roche kit) from these crickets yielded clear PCR products. PCR was performed using a GeneAmp thermal cycler with a total reaction volume of 50 μl. Concentrations and volumes of the reagents for each amplification reaction were: 1 μl of DNA template, 2.5 μl of each primer (10 pmol μl−1), 4 μl of dNTPs (2.5 mM), 5 μl of 10×buffer, 1 μl of Taq DNA polymerase (1 U μl−1; Biotools) and 34 μl of ddH20. Thermal cycling parameters were as follows: 4 min preheat at 94°C, 35 cycles of denaturation at 95°C for 20 s, annealing at 50°C for 40 s, extension at 72°C for 90 s and one cycle of final extension at 72°C for 20 s and held at 4°C. One positive control (genomic DNA template using ITS primers) and one negative control (no DNA template using ITS primers) were included with each set of amplification reactions. PCR products were checked on a 1.5% agarose gel, stained with ethidium bromide.
Genetic differentiation and gene flow
Analyses were performed in two ways, the first comprising both the South African and Mediterranean populations (African-Mediterranean data set) and the second comprising only South African populations (South African data set). Modeltest v3.06 (Posada & Crandall, Reference Posada and Crandall1998) was used to determine the appropriate substitution model given the observed data. Haplotype diversity (h) and nucleotide diversity (π) were calculated for each population using Arlequin v2.000 (Schneider et al., Reference Schneider, Roessli and Excoffier2000).
A χ2 contingency test was performed to determine significant geographical associations using 100,000 randomized permutations (Roff & Bentzen, Reference Roff and Bentzen1989). In addition to this, a Mantel test (Mantel, Reference Mantel1967) was performed to test for an association between the genetic distances obtained in Arlequin and the geographical distances between populations. Ten thousand randomized permutations were performed using Mantel v2.0 (Liedloff, Reference Liedloff1999).
An analysis of molecular variance (AMOVA: Excoffier et al., Reference Excoffier, Smouse and Quattro1992), using Arlequin, was performed to evaluate the degree of within-population and among-population genetic differentiation for both data sets using pairwise F ST statistics, allowing estimation of the number of migrants between populations per generation. In addition, Migrate v1.7.6.1 (Beerli, Reference Beerli2004) was used to calculate Bayesian estimates for migration rates among populations under a symmetrical migration model. The analysis on the African-Mediterranean data set was inconclusive, and the analysis was, therefore, performed only on the South African data set. One hundred short chains with 500 sampled genealogies each and three long chains with 5000 sampled genealogies each were run. One of every 20 reconstructed genealogies was sampled; therefore, the total number of reconstructed genealogies was 104 for each short chain and 105 for each long chain. Heating was set to adaptive, with temperature settings of 1.0, 1.2, 1.5 and 3.0.
TCS v1.13 (Clement et al., Reference Clement, Posada and Crandall2000) was used to estimate a single mutation haplotype network (probability >0.95) from DNA sequences for both data sets as described by Templeton et al. (Reference Templeton, Crandall and Sing1992). Identical sequences were collapsed to single haplotypes and haplotype frequencies were calculated for estimating haplotype outgroup probabilities, which correlate with haplotype age (Donnelly & Tavaré, Reference Donnelly and Tavarè1986; Castelloe & Templeton, Reference Castelloe and Templeton1994). The haplotype network was converted into a nested series of clades using the rules in Templeton & Sing (Reference Templeton and Sing1993), after which a nested clade analysis was performed, using Geodis v2.0 (Posada et al., Reference Posada, Crandall and Templeton2000) and the inference key of Templeton (Reference Templeton2004). Again, the analysis performed on the African-European data set was inconclusive due to the large non-sampled area between South Africa and Europe. The Mediterranean data were, therefore excluded from this analysis. One thousand random permutations were performed to obtain statistical inferences at the 5% level.
Results
Nuclear pseudogenes
Firstly, all cyt b sequences translated successfully into proteins and no stop codons were encountered. Secondly, although isolated incidences of double peaks were encountered in some of the sequences, they did not occur consistently at the same positions of both forward and reverse sequences, and it is suspected that these peaks were artifacts of the sequencing reaction itself. E.g. Isolate Q6 (Genbank accession number EF093650) only had double peaks in the forward sequence (positions 48, 135, 158), while Isolate Q2 (Genbank accession number EF093646) had double peaks in both forward (positions 8, 111, 128, 188, 326) and reverse (position 275, 305, 507, 563) sequences. Thirdly, when the sequences obtained through CsCl extractions were compared with those from genomic DNA extractions, not a single inconsistency was found between the two sources of DNA. Fourthly, a large degree of sequence variation was not observed, comparable to those found in the nuclear copies of mitochondrial genes in orthoptera (Zhang & Hewitt, Reference Zhang and Hewitt1996). The ITS primers yielded a good PCR product when using genomic DNA extractions. On the other hand, the CsCl extractions did not allow amplification of the ITS gene in any of the five individuals tested, suggesting that the purified mtDNA extraction was free of nuclear DNA. This indicates that the cyt b DNA sequenced was of mitochondrial origin and did not constitute nuclear pseudogenes.
MtDNA haplotype variation
It was decided to use only 575 bp of the targeted 728 bp region of the cyt b gene in the analyses. This region could not be successfully sequenced for all individuals. However, for the large majority of individuals that could be successfully sequenced, these flanking regions did not reveal any additional haplotypes. All sequences were deposited in GenBank (Accession Nos EF093592-EF093752). The 161 crickets from South Africa and Europe yielded 31 haplotypes (table 1) defined by 35 polymorphic nucleotide sites. Genbank accession numbers for the haplotypes are as follows: h1: EF093629, h2: EF093640, h3: EF093602, h4: EF093643, h5: EF093620, h6: EF093632, h7: EF093645, h8: EF093608, h9: EF093592, h10: EF093638, h11: EF093607, h12: EF093618, h13: EF093621, h14: EF093622, h15: EF093672, h16: EF093702, h17: EF093678, h18: EF093687, h19: EF093689, h20: EF093704, h21: EF093692, h22: EF093695, h23: EF093650, h24: EF093652, h25: EF093616, h26: EF093605, h27: EF093681, h28: EF093634, h29: EF093737, h30: EF093748, h31: EF093710. Six haplotypes were found at two or more localities (h1, h2, h4, h6, h7 and h28; table 1). The most common haplotype (h2, n=71) was found in all the South African and European populations. The second most common haplotype (h1, n=49) was found only in South Africa. Only two haplotypes were found in Europe (h2 and h31; table 1), the latter from a single cricket from Spain while h2 was also common in South Africa. Modeltest suggested that the most appropriate approach for estimating within-population genetic diversity for both data sets was the Tamura-Nei (TrN) model (Tamura & Nei, Reference Tamura and Nei1993). The estimated transition/transversion ratio was 11.048 for the combined African-Mediterranean data set and 10.501 for the South African data set.
Number of Gryllus bimaculatus sequenced (n) for cyt b and number of individuals representing each haplotype for each locality, as well as haplotype diversity (h) and nucleotide diversity (π) for each locality. Haplotypes unique to a population are indicated in bold. Fourteen of 31 haplotypes (h5, h8, h11–14, h18–25) are population-specific to southern or western populations in South Africa, while seven (h10, h15–17, h27, h29–30) are population-specific to northern populations in South Africa. Hapotypes 6 and 7 were only found in the northern region. Haplotype 2, the most common one, was found at all localities, including Sevilla and Italy.

Rows below are greyed to improve readability along rows.
Within-population genetic differentiation
Haplotype diversity (h) and nucleotide diversity (π) differed largely among populations, with the lowest haplotype and nucleotide diversity values observed in the Mediterranean populations. Nucleotide diversity in the total data set was 6.09%. For South Africa, the Hotazel population had the highest nucleotide diversity and Queenstown the lowest, indicating a large degree of within-population differentiation in the Hotazel population and a small degree of within-population differentiation in the Queenstown population (table 1). The low nucleotide diversity in the Queenstown population is also reflected in its haplotype diversity. Six of the seven South African populations had haplotype diversities larger than 0.69, indicative of a high degree of overall within-population genetic diversity. The low nucleotide diversity of the Mediterranean populations was also reflected in the haplotype diversities and indicated a small degree of within-population genetic differentiation. The relative effective population sizes (table 2) reflected the degree of within-population differentiation (based on nucleotide diversity; table 1) in the South African populations. While the Queenstown population had the smallest effective population size and the lowest nucleotide diversity, the Dullstroom population had the largest effective population size, and its nucleotide diversity was similar to three other well-established populations. The number of individuals sampled from the Mediterranean (n=28) represents a smaller sample size than we obtained in South Africa. However, except for one individual from Spain with a unique haplotype, all Mediterranean crickets shared the same cyt b haplotype (table 1) that was also the most common in southern Africa.
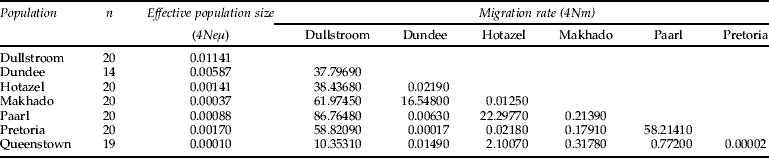
Estimated migration rates per generation between southern African populations of Gryllus bimaculatus derived from a MCMC maximum likelihood estimation (Beerli, Reference Beerli2004).
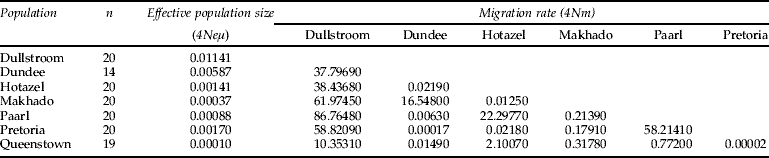
Migration was assumed to be symmetrical; n, the number of individuals sequenced at each locality.
Between-population genetic differentiation
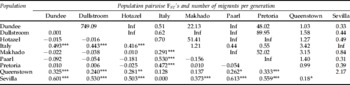
There was significant between-population genetic differentiation among the sampled populations. For the African-Mediterranean data set, AMOVA indicated that 80.51% of the genetic variation occurred within populations and 19.49% among populations, revealing significant between-population genetic differentiation (F ST=0.195, P<0.001). For the South African data set, AMOVA also revealed significant between-population genetic differentiation (F ST=0.049, P<0.05) and indicated that 5% of the genetic variation occurred among populations and 95% of the variation occurred within populations. As expected, the estimated number of migrants per generation was higher between the South African populations than between the South African and Mediterranean populations (table 3). The results of the Roff-Bentzen test supported the AMOVA. There was significant geographical differentiation in the African-Mediterranean data set (observed χ2=271.53, P≪0.05, n=161) as well as within the South African data set (observed χ2=190.19, P<0.05, n=133). This reflects the small number of haplotypes in the Mediterranean compared with South Africa. Two common haplotypes were restricted to the northern populations (Dullstroom, Makhado, Pretoria). Seven haplotypes were restricted to the Hotazel population and five haplotypes to the Paarl population. This represents a significant north-south degree of differentiation (table 1), reflected in the above statistics. Two possible migration routes were suggested within South Africa, based on the migration estimates of migrate (maximum log likelihood=3.585; table 2). Firstly, large degrees of gene flow occurred among the populations in the northeastern region of South Africa (Dullstroom, Dundee, Makhado, Pretoria). Secondly, migration took place among the Hotazel, Paarl and Queenstown populations situated in the southwestern region of South Africa.
Population pairwise F ST statistics (Tamura-Nei distance parameter) for the South African and Mediterranean populations of Gryllus bimaculatus, derived from AMOVA (lower diagonal area of the table). Asterisks indicate significant F ST statistics (P<0.05 *, P<0.01 ** and P<0.001 ***), while negative values indicate a larger degree of within-population variation than between-population genetic differences.

The upper diagonal area of the table shows the estimated number of migrants per generation (2Nm). ‘Inf’ indicates an infinite number of migrants per generation among populations.
Isolation by distance
No significant isolation-by-distance effect was observed among the South African populations (Mantel test: g=0.306, r=0.096, P>0.05, n=133), suggesting that, although there was significant between-population genetic differentiation, simple isolation by geographic distance was not the major determinant of these genetic differences. A significant isolation-by-distance effect was observed for the African-Mediterranean data set (Mantel test: g=3.607, r=0.776, P<0.05, n=161), suggesting that, on a broader scale, isolation by geographic distance was a determinant of between-continent genetic differentiation. However, this latter result is possibly an artifact due to the large unsampled distance between the Mediterranean and southern Africa.
Haplotype network analysis
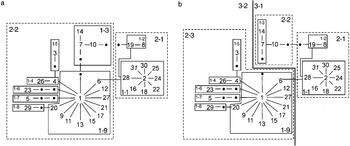
The haplotypes from crickets in Spain and Italy nested totally within the haplotype network of the South African crickets (fig. 2). Except for a single individual from Spain containing a unique haplotype, all Mediterranean crickets had a haplotype that is common in South Africa (table 1). However, since inclusion of the Mediterranean data did not result in robust conclusions due to a large unsampled area between South Africa and Europe, only the results for the South African data set is discussed here. The haplotype network included a loop. Consequently, two alternative cladograms were constructed that comprised two two-step clades (two-step cladogram; fig. 2a) and two three-step clades (three-step cladogram; fig. 2b), respectively, depending on where the loop was broken. The oldest interior clade (1-9) and the younger tip clades comprised haplotypes from all the South African populations. However, with the exception of clade 1-8, the geographical representation of the tip clades were restricted to certain regions of the country (clades 1-4 and 1-5 represented the northeastern region), suggesting restricted gene flow between areas of the country.
Haplotype network and associated nested design for cyt b haplotypes from seven South African populations of Gryllus bimaculatus based on the statistical parsimony of Templeton & Sing (Reference Templeton and Sing1993). Haplotypes from Italy and Spain were excluded form the NCA due to large non-sampled areas between South Africa and Europe. For descriptive purposes, the unique haplotype (h31) from the Spanish population is indicated in italics in clade 1-1. Separate analyses performed to accommodate an internal loop in the haplotype network resulted in a (a) two-step cladogram and a (b) three-step cladogram. Hypothetical haplotypes are indicated by a black dot and are separated by increments of single mutational steps. One-step, two-step and three-step clades are indicated respectively by thin line, dotted line and thick line boxes labeled by hyphened numbers. Haplotype ID numbers in table 1 are used in this figure.

The two-step cladogram (fig. 2a) comprised nine one-step clades and two two-step clades. Clade 2-1 mostly comprised haplotypes from the southern region of South Africa (Hotazel, Paarl, Queenstown), while clade 2-2 mostly comprised haplotypes from the northeastern region (Dullstroom, Dundee, Makhado, Pretoria).
The three-step cladogram (fig. 2b) differed from the two-step cladogram by having three two-step clades and two three-step clades. Most of the populations from the southern region of South Africa were nested within clade 3-1 and the populations from the northeastern region nested within clade 3-2.
The nested clade analysis showed significant differences for within-clade (Dc) and nested clade (Dn) distances (table 1) at the top level for both cladograms (two-step clade, fig. 2a; χ2=16.23, P<0.01; three-step clade, fig. 2b: χ2=12.21, P<0.05). Within both these clades, restricted gene flow with isolation by distance was the most likely explanation for the pattern.
Discussion
Purified mtDNA sequences of five individual crickets matched those of their genomic mtDNA extractions, indicating that the results in this study reflected variation at the mitochondrial cyt b gene of G. bimaculatus and that no nuclear products were amplified as has been found in a number of Orthoptera species (Zhang & Hewitt, Reference Zhang and Hewitt1996; Bensasson et al., Reference Bensasson, Zhang and Hewitt2000).
Genetic variation in Mediterranean crickets
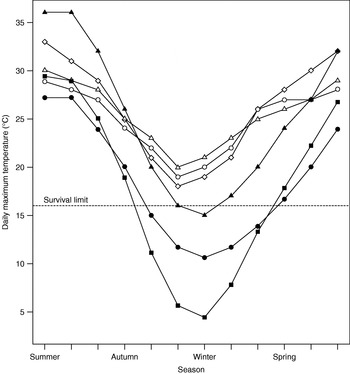
A combined genetic analysis of the Mediterranean and South African populations is complicated by a large non-sampled area between these two areas. For this reason, several of the analyses were performed only for the South African populations. For the Mediterranean crickets, the sample size of 28 individuals is not very large, and the reduced haplotype variation could be an artifact of sample size. However, the Roff-Bentzen test indicates that, using our collective dataset of haplotypes as a source, the probability of drawing a random sample of sequences with haplotype composition similar to that observed in the Mediterranean is negligible. In addition, all South African populations with similar sample size as that of Sevilla had at least four haplotypes (table 1). The low haplotype number in the Mediterranean is unlikely to be due to inbred maternal lines affecting the mitochondrial haplotype diversity since molecular evidence indicates extensive multiple mating by male crickets (Bretman et al., Reference Bretman, Wedell and Tregenza2004). The overall characteristics of very low genetic diversity (table 1) yet with high between-population genetic similarity and high estimated rates of gene flow between Mediterranean populations (table 3) can be explained by irruptive outbreaks punctuated by strong within-population bottlenecks. High between-population exchange resulting in founder effects are likely to contribute to these small degrees of genetic diversity among localities but only after existing populations have largely been reduced in size. Winter temperatures in Mediterranean Europe are relatively cold with daily maxima below 15°C for localities close to where crickets were collected for this study. Van Wyk & Ferguson (Reference van Wyk and Ferguson1995) showed that the communicatory behaviour of G. bimaculatus ceases below an ambient temperature of 16°C and that the activity patterns of crickets during the southern African winter is shifted towards diurnal periods with higher temperatures. In addition, Ferreira (Reference Ferreira2006) showed a 0% survival rate for cricket larvae reared in captivity at 15°C and a 13% survival at 20°C. Low winter temperatures in Europe, therefore, probably constitute a strong limiting factor that causes only a small portion of the population to survive through the colder winter months, consequently reducing genetic variation through bottle-neck effects. Compared to Mediterranean Europe, favourable environmental conditions in southern Africa (fig. 3: Schulze, Reference Schulze1994) is likely to reduce bottle-neck effects during winter, bringing about larger effective population sizes and a larger amount of within-population genetic variation.
Mean monthly daily maximum temperatures for six localities at, or close to, the sites where crickets were collected for this study. The horizontal line indicates the critical temperature below which cricket larvae do not survive and below which adult crickets do not show normal behaviour (see text). Data for Africa (months 1–12, Jan–Dec) and Europe (months 7–12, 1–6) were aligned in terms of season. Temperature data (means 1961–1990) were obtained from the World Meteorological Organisation as disseminated via the South African Weather Service (www.weathersa.co.za) and BBC Weather (www.bbc.co.uk/weather) (▪, Bologna; •, Genova; ▴, Sevilla; ○, Pretoria; ▵, Ladysmith; ◊, Kimberley).

Gene flow between Africa and the Mediterranean
The migration estimate between South Africa and Mediterranean Europe based on the AMOVA suggests reduced but measurable gene flow between the South African and Mediterranean populations (table 3). Transport routes connecting Africa and Europe through air and sea may increase the chances of inter-continental gene flow in G. bimaculatus, thereby maintaining the European genetic diversity in this species and providing founder populations. Although it is rare for these insects to fly long distances, swarms of G. bimaculatus were reported to land on ships passing the West Coast of Africa on route from the Canary Islands to southern Africa, the furthest ship being 933 km from land (Ragge, Reference Ragge1972). However, since these between-continent gene flow estimates are based on F ST, only they should be taken as tentative (Whitlock & McCauley, Reference Whitlock and McCauley1999). In addition, more extensive sampling is required for a better understanding of cricket movements in Europe. Except for the Queenstown population, all the South African populations differed significantly from the Mediterranean populations (table 3).
Gene flow within southern Africa
The significant between-population genetic differentiation in South Africa was reflected by the large number of haplotypes only observed at single localities (26 of 31 haplotypes). This is similar to the results of Willett et al. (Reference Willett, Ford and Harrison1997) who found that, for the COI-COII mtDNA gene in G. firmus and G. pennsylvanicus, all except one of the mtDNA haplotypes were restricted to single localities. The AMOVA, Bayesian MCMC estimates as well as the NCA revealed similar overall genetic divisions within South Africa (tables 2 and 3). Gene flow occurred within the northern region and within the southern region (tables 2 and 3). These two regions largely correspond to different climatic zones; northeastern South Africa is categorised as a summer rainfall area with a high annual rainfall, while southern and western South Africa are categorised by rain throughout the year and drier conditions except along the coast (Preston-Whyte & Tyson, Reference Preston-Whyte and Tyson1988; Schulze, Reference Schulze1994). This does not imply that these north-south differences are systematic. On the contrary, there are some unexpected exceptions indicated in tables 2 and 3. The large semi-arid to arid Karoo in central South Africa (Schulze, Reference Schulze1994) probably impedes natural gene flow between the northern and southern areas, due to isolated populations occurring around farm houses. Consequently, a lower level of migration occurred along the north-south gradient between the northern and southern regions, reflected by the top-level clades in fig. 2. One of the major inland road transport routes in South Africa follows a southwest to northeast direction (Business Monitor International, 2008) and incidentally could be a source of the intraspecific gene flow within South Africa. This could explain the unexpected high migration estimate between Pretoria and Paarl (tables 2 and 3). The historical explanation for genetic differentiation among South African populations of crickets (restricted gene flow superimposed on isolation by distance) appears to fit our observation well. However, this conclusion should be taken as tentative, taking into account recently-revealed weaknesses of nested clade analysis (Panchal & Beaumont, Reference Panchal and Beaumont2007; Templeton, Reference Templeton2008).
Usefulness of genetic information for interpreting between-population behavioural differences
Ferreira & Ferguson (Reference Ferreira and Ferguson2002) demonstrated significant differences between the calling song of G. bimaculatus from a number of South African populations, also reflected in significant between-population differences of the sound-producing structures on the wings of males from these populations. The same applies to crickets from Queenstown that differed significantly from other South African populations in most song traits, as well as in morphology (Ferreira, Reference Ferreira2006). For instance, the calling song frequency at Queenstown was 6 kHz, almost 1 kHz higher than in other southern African populations. This population was also genetically most distant from other southern African populations (table 2). Since the crickets come from localities ranging widely in rainfall, water availability and temperature, the question that arises is whether these differences are environmentally-induced or genetic in nature. The results from the molecular work reported here suggest that these behavioural and morphological differences possibly have a genetic basis and that a closer investigation of the quantitative genetic characteristics of the songs of G. bimaculatus is justified.
Our results also provide insight into the interactions between European and African populations of crickets. Since our results strongly suggest longer-range dispersal as an important cause of genetic differentiation between populations, this dispersion is also likely to occur between Africa (both Mediterranean and further south) and Europe. The surprising conclusion from our work is that an insect with a wide international distribution across several continents shows clear geographical differences in genetic variation. The Mediterranean populations have surprisingly little genetic variation at the mitochondrial cyt b locus, probably reflecting very small effective population sizes. Genetic variation in Europe is probably strongly affected by gene flow of genetic variants from environmentally stable parts of their geographic range, e.g. Africa. In this sense the Mediterranean area possibly comprises marginal habitat for the Mediterranean cricket.
This study also highlights the disjointed and nonsystematic pattern of gene flow that exists even in insects that are cosmopolitan in geographic range, also observed in other cricket species. These disjointed gene flow patterns are likely part of the explanation for morphological and behavioural differences found in different populations of these insects.
Acknowledgements
We would like to thank the farmers from Dullstroom, Dundee, Makhado, Paarl and Queenstown for allowing us to collect crickets on their properties. A.D. Slagor-Bastos, W. Delport, G.P. Malherbe and J. Roy are thanked for their laboratory and statistical assistance. L. Verburgt as well as X. Cerda and other staff of the CSIC Estación Biológica de Doñana, Spain are thanked for enabling us to collect material in Spain. The Deutche Forchungsgemeinschaft (DFG) funded the collection of material from Europe. The National Research Foundation (NRF South Africa) and University of Pretoria supported this work.