1 Introduction
In several natural contexts low-frequency fluctuations display properties which are typical of an Alfvénic state: velocity and magnetic field perturbations are highly correlated (positively or negatively), while density and magnetic field intensity are affected by much less intense fluctuations. This situation is typically found in solar wind turbulence, mainly in low-latitude fast-speed streams, or in the high-latitude wind (e.g. Belcher & Davis Reference Belcher and Davis1971; Bruno & Carbone Reference Bruno and Carbone2013). Recently, measures performed by the Parker Solar Probe spacecraft at small heliocentric distances have shown fluctuations in the solar wind emanating from an equatorial coronal hole with strong Alfvénic correlation, even in cases of very large amplitudes (the so-called switchbacks) (Bale et al. Reference Bale, Badman, Bonnell, Bowen, Burgess, Case, Cattell, Chandran, Chaston and Chen2019). Another example is that of velocity fluctuations propagating along the magnetic field at the Alfvén speed detected in the solar corona (Tomczyk et al. Reference Tomczyk, McIntosh, Keil, Judge, Schad, Seeley and Edmondson2007; Tomczyk & McIntosh Reference Tomczyk and McIntosh2009), which have been interpreted as Alfvén waves.
In the framework of the magnetohydrodynamic (MHD) turbulence, such perturbations interact nonlinearly producing a cascade which moves fluctuating energy at increasingly smaller scales. In the presence of a background magnetic field  $\boldsymbol{B}_{0}$, nonlinear interactions preferentially take place in the directions transverse to
 $\boldsymbol{B}_{0}$ (Shebalin, Matthaeus & Montgomery Reference Shebalin, Matthaeus and Montgomery1983; Carbone & Veltri Reference Carbone and Veltri1990; Oughton, Priest & Matthaeus Reference Oughton, Priest and Matthaeus1994). Therefore, an anisotropy develops in the spectral space, with perpendicular wavevectors dominating over parallel ones at small scales. Indeed, solar wind observations have shown the presence of a significant population of quasi-perpendicular wavevectors (Matthaeus, Goldstein & King Reference Matthaeus, Goldstein and King1986; Matthaeus, Goldstein & Roberts Reference Matthaeus, Goldstein and Roberts1990; Carbone, Malara & Veltri Reference Carbone, Malara and Veltri1995; Milano et al. Reference Milano, Matthaeus, Dmitruk and Montgomery2001; Dasso et al. Reference Dasso, Milano, Matthaeus and Smith2005; Matthaeus et al. Reference Matthaeus, Servidio, Dmitruk, Carbone, Oughton, Wan and Osman2012; Oughton et al. Reference Oughton, Matthaeus, Wan and Osman2015). A further element, which can play a role in the turbulent dynamics, is given by the interaction of fluctuations with inhomogeneities associated with large-scale structures, such as pressure-balanced structures or velocity shears. A detailed discussion about the role played by both magnetic and velocity shears in the evolution of slab fluctuations in the incompressible case is found in Ghosh et al. (Reference Ghosh, Matthaeus, Roberts and Goldstein1998a). The spectral evolution when both quasi-two-dimensional and slab fluctuations are present is discussed in Ghosh et al. (Reference Ghosh, Matthaeus, Roberts and Goldstein1998b). These phenomena happen in the solar wind around the heliospheric current sheet (Malara, Primavera & Veltri Reference Malara, Primavera and Veltri1996a) or at the interface between fast- and slow-speed streams (Roberts et al. Reference Roberts, Ghosh, Goldstein and Matthaeus1991, Reference Roberts, Goldstein, Matthaeus and Ghosh1992). Finally, fluctuations in the turbulent spectrum at scales of the order or lower than ion scales (ion inertial length and/or ion Larmor radius) are affected by dispersive and kinetic phenomena. In a collisionless plasma, these kinetic processes generate out-of-equilibrium features in the particle distribution function: ion temperature anisotropy has been routinely observed in the solar wind (e.g. Hellinger et al. Reference Hellinger, Trávníček, Kasper and Lazarus2006); the proton distribution function in the solar wind and in the Earth’s magnetosphere can include a beam directed parallel to the local magnetic field (Goodrich & Lazarus Reference Goodrich and Lazarus1976; Marsch et al. Reference Marsch, Mühlhäuser, Schwenn, Rosenbauer, Pilipp and Neubauer1982; Marsch Reference Marsch2006; Sorriso-Valvo et al. Reference Sorriso-Valvo, Catapano, Retinó, Le Contel, Perrone and Roberts2019), with a drift speed of the order of the local Alfvén velocity (Goldstein et al. Reference Goldstein, Neugebauer, Zhang and Gary2000; Tu, Marsch & Qin Reference Tu, Marsch and Qin2004). Physical processes which can lead to the formation of this beam have also been considered (Araneda, Marsch & Viñas Reference Araneda, Marsch and Viñas2008; Valentini et al. Reference Valentini, Veltri, Califano and Mangeney2008; Matteini et al. Reference Matteini, Landi, Velli and Hellinger2010; Valentini, Perrone & Veltri Reference Valentini, Perrone and Veltri2011a; Valentini et al. Reference Valentini, Califano, Perrone, Pegoraro and Veltri2011b; Nariyuki et al. Reference Nariyuki, Umeda, Suzuki and Hada2014a). More recently, a further level of velocity–space complexity, namely the presence of an enstrophy cascade towards smaller velocity–space scales, has been pointed out either in magnetosheath observations (Servidio et al. Reference Servidio, Chasapis, Matthaeus, Perroned, Valentini and Parashar2017) or in numerical simulations (Cerri, Kunz & Califano Reference Cerri, Kunz and Califano2018; Pezzi et al. Reference Pezzi, Servidio, Perrone, Valentini, Sorriso-Valvo, Greco, Matthaeus and Veltri2018), which are also useful to investigate the nature of cross-scale correlations between the inertial-range turbulent energy cascade and the small-scale kinetic processes in collisionless plasmas (Sorriso-Valvo et al. Reference Sorriso-Valvo, Perrone, Pezzi, Valentini, Servidio, Zouganelis and Veltri2018).
A full description which takes into account the above features, namely, Alfvénic correlations, spectral anisotropy, the role of background inhomogeneities and kinetic effects at ion scales, is a complex task. However, some insight can be gained by means of simplified approaches. In particular, in this paper we will focus on a specific aspect: the interaction between an Alfvénic perturbation and a bulk velocity inhomogeneity transverse to the background magnetic field, which produces small scales of the order of the ion inertial length/Larmor radius in the transverse direction. This effect somehow mimics the anisotropic small-scale generation taking place in a turbulence, where large scales evolve on characteristic times which are larger than that of smaller scales.
Such a problem has been already analysed in detail within the MHD description, where two distinct mechanisms are at work: phase mixing, in which differences in phase speed produce a progressive de-phasing that bends wavefronts and increases the transverse component of the wavevector; and resonant absorption, in which the wave energy progressively concentrates in thin layers where a resonance condition is satisfied. These processes have been studied both by normal mode approaches (Kappraff & Tataronis Reference Kappraff and Tataronis1977; Mok & Einaudi Reference Mok and Einaudi1985; Steinolfson Reference Steinolfson1985; Davila Reference Davila1987; Hollweg Reference Hollweg1987; Califano, Chiuderi & Einaudi Reference Califano, Chiuderi and Einaudi1990, Reference Califano, Chiuderi and Einaudi1992) and by considering the evolution of an initial disturbance (Lee & Roberts Reference Lee and Roberts1986; Malara et al. Reference Malara, Veltri, Chiuderi and Einaudi1992; Malara, Primavera & Veltri Reference Malara, Primavera and Veltri1996b). Localized pulses (Kaghashvili Reference Kaghashvili1999; Tsiklauri, Nakariakov & Rowlands Reference Tsiklauri, Nakariakov and Rowlands2002; Tsiklauri & Nakariakov Reference Tsiklauri and Nakariakov2003) have also been considered. The propagation of MHD waves in inhomogeneous magnetic fields containing null points has also been studied (Landi, Velli & Einaudi Reference Landi, Velli and Einaudi2005; McLaughlin et al. Reference McLaughlin, Hood and De Moortel2011; Pucci, Onofri & Malara Reference Pucci, Onofri and Malara2014), finding a fast formation of small scales perpendicular to the ambient magnetic field. In three-dimensional (3-D) inhomogeneous equilibria this process has been considered in the small wavelength limit (Similon & Sudan Reference Similon and Sudan1989; Petkaki, Malara & Veltri Reference Petkaki, Malara and Veltri1998; Malara, Petkaki & Veltri Reference Malara, Petkaki and Veltri2000), also within the problem of coronal heating (Malara, De Franceschis & Veltri Reference Malara, De Franceschis and Veltri2003, Reference Malara, De Franceschis and Veltri2005, Reference Malara, De Franceschis and Veltri2007).
When the wavelength of the perturbation has decreased until reaching values comparable with the ion inertial length and/or Larmor radius, both dispersive and kinetic effects, which are neglected in the MHD approach, become important. In particular, an Alfvén wave with a wavevector which is (i) quasi-perpendicular to the background magnetic field, and (ii) of the order of the inverse of the ion Larmor radius, is generally indicated as a ‘kinetic Alfvén wave’ (KAW). KAWs have received considerable attention because observations have shown that the polarization of fluctuations at kinetic scale in the solar wind is consistent with the presence of KAW-like fluctuations (Chen et al. Reference Chen, Boldyrev, Xia and Perez2013). Since the MHD cascade favours nearly perpendicular wavevectors, the expectation within a wave perspective would be that fluctuations having a character resembling KAWs were naturally present at scales of the order of the ion Larmor radius. An extensive analysis of the KAW physics can be found in Hollweg (Reference Hollweg1999) (see also references therein for a more complete view on the subject). Many solar wind observational analyses (Bale et al. Reference Bale, Kellogg, Mozer, Horbury and Reme2005; Sahraoui et al. Reference Sahraoui, Goldstein, Robert and Khotyaintsev2009; Podesta & TenBarge Reference Podesta and TenBarge2012; Salem et al. Reference Salem, Howes, Sundkvist, Bale, Chaston, Chen and Mozer2012; Chen et al. Reference Chen, Boldyrev, Xia and Perez2013; Kiyani et al. Reference Kiyani, Chapman, Sahraoui, Hnat, Fauvarque and Khotyaintsev2013), theoretical works (Howes et al. Reference Howes, Dorland, Cowley, Hammett, Quataert, Schekochihin and Tatsuno2008a; Schekochihin et al. Reference Schekochihin, Cowley, Dorland, Hammett, Quataert and Tatsuno2009; Sahraoui et al. Reference Sahraoui, Belmont and Goldstein2012) as well as numerical simulations (Gary & Nishimura Reference Gary and Nishimura2004; Howes et al. Reference Howes, Cowley, Dorland, Hammett, Quataert and Schekochihin2008b; Tenbarge & Howes Reference TenBarge and Howes2012) have suggested that fluctuations near the end of the MHD inertial cascade range may consist primarily of KAWs and that such fluctuations can play an important role in the dissipation of turbulent energy. Formation of KAW-like small-amplitude fluctuations has also been observed in numerical simulations of collisions between two counter-propagating Alfvénic wavepackets (Pezzi et al. Reference Pezzi, Parashar, Servidio, Valentini, Vásconez, Yang, Malara, Matthaeus and Veltri2017a,Reference Pezzi, Parashar, Servidio, Valentini, Vásconez, Yang, Malara, Matthaeus and Veltrib,Reference Pezzi, Malara, Servidio, Valentini, Parashar, Matthaeus and Veltric), a process which mimics nonlinear interactions among localized eddies in turbulence. Moreover, Landau damping and wave–particle resonant interactions can take place in KAWs (Vásconez et al. Reference Vásconez, Valentini, Camporeale and Veltri2014). Due to a non-vanishing electric field parallel component associated with KAWs, these waves have also been considered in the problem of particle acceleration (Voitenko & Goossens Reference Voitenko and Goossens2004; Décamp & Malara Reference Décamp and Malara2006). Particle acceleration in phase mixing of Alfvén waves in a dispersive regime has been studied both in 2-D (Tsiklauri, Sakai & Saito Reference Tsiklauri, Sakai and Saito2005; Tsiklauri Reference Tsiklauri2011) and in 3-D (Tsiklauri Reference Tsiklauri2012) configurations. Finally, instabilities generating KAWs in a plasma with transverse density modulations have been considered by Wu & Chen (Reference Wu and Chen2013). Similar ideas involving dissipative mechanisms related to interaction of Alfvén waves or KAWs and phase mixing have been examined in the context of the magnetospheric plasma sheet (Lysak & Song Reference Lysak and Song2011) and in coronal loops (Ofman & Aschwanden Reference Ofman and Aschwanden2002). It has been shown that ion-scale shear Alfvén waves can be excited by ion beams in the solar wind (Hellinger & Trávníček Reference Hellinger and Trávníček2011, Reference Hellinger and Trávníček2013), and these can contribute to the formation of KAWs (Nariyuki, Hada & Tsubouchi Reference Nariyuki, Hada and Tsubouchi2014b). The possible role played by KAW-like fluctuations in heating electrons in coronal turbulence has been considered (Malara et al. Reference Malara, Nigro, Valentini and Sorriso-Valvo2019).
Recently, the phase mixing of Alfvénic perturbations propagating in a pressure-balanced magnetic field transverse inhomogeneity has been numerically studied, by comparing the results of Hall-MHD and kinetic simulations (Vásconez et al. Reference Vásconez, Pucci, Valentini, Servidio, Matthaeus and Malara2015; Pucci et al. Reference Pucci, Vásconez, Pezzi, Servisio, Valentini, Matthaeus and Malara2016; Valentini et al. Reference Valentini, Vásconez, Pezzi, Servidio, Malara and Pucci2017). In these simulations the perturbation wavelength decreases, due to the interaction with the inhomogeneous background, until it reaches values of the order of the ion inertial length; the properties of the initial perturbation gradually change, eventually leading to an efficient generation of KAWs inside the inhomogeneity region. Moreover, it has been observed that such KAWs sensibly modify the initially Maxwellian ion distribution function (Vásconez et al. Reference Vásconez, Pucci, Valentini, Servidio, Matthaeus and Malara2015; Valentini et al. Reference Valentini, Vásconez, Pezzi, Servidio, Malara and Pucci2017), producing temperature anisotropy, as well as localized ion beams which move along the magnetic field with a speed close to the local Alfvén velocity.
In the present paper we study a similar problem, namely, the evolution of a large-scale Alfvénic perturbation propagating in a collisionless plasma with a sheared velocity field and a uniform magnetic field parallel to the velocity. Shearing flows in plasmas with a quasi-parallel magnetic field can be found, for instance, in the interaction region between fast and slow streams of the solar wind (Bruno & Carbone Reference Bruno and Carbone2013), or in astrophysical jets (Hamlin & Newman Reference Hamlin and Newman2013). We consider an unperturbed configuration where the width of the velocity shear is of the order of few ion inertial lengths and we use a hybrid Vlasov–Maxwell approach to describe the system evolution. Our numerical simulations show that, also in the present case, phase mixing acting on the Alfvénic perturbation increases the perpendicular wavenumber, until KAWs develop inside the velocity shear regions. For sufficiently large amplitudes, such waves modify the ion distribution function, locally generating a particle beam propagating along the magnetic field at the Alfvén velocity.
The plan of the paper is the following: in § 2 we present the equations describing our model, including the form of the stationary solution and of the perturbation; in § 3 we describe the results of the simulations; and in § 4 we give the conclusions.
2 The model
We consider a collisionless, fully ionized, magnetized plasma composed of protons and electrons. We want to describe phenomena taking place at spatial scales larger than or of the order of the proton inertial length  $d_{p}=c_{A}/\unicode[STIX]{x1D6FA}_{p}$ and/or of the proton Larmor radius
 $\unicode[STIX]{x1D70C}_{p}=v_{\text{th},p}/\unicode[STIX]{x1D6FA}_{p}$. In previous definitions,
 $c_{A}=B/(4\unicode[STIX]{x03C0}m_{p}n)^{1/2}$ and
 $v_{\text{th},p}=(\unicode[STIX]{x1D705}_{B}T_{p}/m_{p})^{1/2}$ are respectively the Alfvén and the proton thermal speeds, related through the proton
 $\unicode[STIX]{x1D6FD}_{p}=2v_{\text{th},p}^{2}/c_{A}^{2}$; while
 $\unicode[STIX]{x1D6FA}_{p}=eB/m_{p}c$ is the proton cyclotron frequency. Moreover,
 $B$ is the magnetic field;
 $n$ is the density (assumed to be equal for protons and electrons);
 $T_{p}$,
 $m_{p}$ and
 $e$ are the proton temperature, mass and charge, respectively;
 $\unicode[STIX]{x1D705}_{B}$ is the Boltzmann constant and
 $c$ is the speed of light.
2.1 Equations of the model
We employ the Hybrid Vlasov–Maxwell (HVM) model, where protons are kinetically described by the Vlasov equation, while electrons are treated as a massless fluid. As usual in the HVM approach, we assume that the electron fluid is isothermal:  $T_{e}=\text{const}$. The equations describing the HVM model, in dimensionless units, are the following:
 $$\begin{eqnarray}\displaystyle & \displaystyle {\displaystyle \frac{\unicode[STIX]{x2202}f}{\unicode[STIX]{x2202}t}}+\boldsymbol{v}\boldsymbol{\cdot }\unicode[STIX]{x1D735}f+(\boldsymbol{E}+\boldsymbol{v}\times \boldsymbol{B})\boldsymbol{\cdot }{\displaystyle \frac{\unicode[STIX]{x2202}f}{\unicode[STIX]{x2202}\boldsymbol{v}}}=0, & \displaystyle\end{eqnarray}$$
 $$\begin{eqnarray}\displaystyle & \displaystyle \boldsymbol{E}=-\boldsymbol{u}\times \boldsymbol{B}+{\displaystyle \frac{1}{n}}(\,\boldsymbol{j}\times \boldsymbol{B})-{\displaystyle \frac{1}{n}}\unicode[STIX]{x1D735}p_{e}, & \displaystyle\end{eqnarray}$$
 $$\begin{eqnarray}\displaystyle & \displaystyle {\displaystyle \frac{\unicode[STIX]{x2202}\boldsymbol{B}}{\unicode[STIX]{x2202}t}}=-\unicode[STIX]{x1D735}\times \boldsymbol{E};\quad \boldsymbol{j}=\unicode[STIX]{x1D735}\times \boldsymbol{B};\quad p_{e}=nT_{e}, & \displaystyle\end{eqnarray}$$
where,  $f=f(\boldsymbol{x},\boldsymbol{v},t)$ is the proton distribution function (DF),
 $n=n(\boldsymbol{x},t)$ and
 $\boldsymbol{u}=\boldsymbol{u}(\boldsymbol{x},t)$ are the density and proton bulk velocity, respectively,
 $$\begin{eqnarray}n(\boldsymbol{x},t)=\int f(\boldsymbol{x},\boldsymbol{v},t)\,\text{d}^{3}\boldsymbol{v};\quad \boldsymbol{u}(\boldsymbol{x},t)={\displaystyle \frac{1}{n(\boldsymbol{x},t)}}\int \boldsymbol{v}f(\boldsymbol{x},\boldsymbol{v},t)\,\text{d}^{3}\boldsymbol{v}.\end{eqnarray}$$
In the above equations the magnetic field  $\boldsymbol{B}$ is normalized to a typical value
 $\tilde{B}$; the density
 $n$ is normalized to a typical value
 ${\tilde{n}}$; velocities
 $\boldsymbol{v}$ and
 $\boldsymbol{u}$ are normalized to the typical Alfvén speed
 $\tilde{c}_{A}=\tilde{B}(4\unicode[STIX]{x03C0}m_{p}{\tilde{n}})^{-1/2}$; the electric field
 $\boldsymbol{E}$ is normalized to
 $\tilde{E}=(\tilde{c}_{A}/c)\tilde{B}$; the time
 $t$ is normalized to the typical proton gyration time
 $\tilde{\unicode[STIX]{x1D6FA}}_{p}^{-1}$, with
 $\tilde{\unicode[STIX]{x1D6FA}}_{p}=e\tilde{B}/(m_{p}c)$; space variables are normalized to the typical proton inertial length
 $\tilde{d}_{p}=\tilde{c}_{A}/\tilde{\unicode[STIX]{x1D6FA}}_{p}$; the current density
 $\boldsymbol{j}$ is normalized to the value
 $\tilde{j}=c\tilde{B}/(4\unicode[STIX]{x03C0}\tilde{d}_{p})$; and the electron temperature
 $T_{e}$ is normalized to the typical temperature
 $\tilde{T}=\tilde{B}^{2}/(4\unicode[STIX]{x03C0}\unicode[STIX]{x1D705}_{B}{\tilde{n}})$. In what follows, all the results will be expressed in terms of the above-defined dimensionless variables.
The system of equations (2.1)–(2.4) is solved by means of the HVM numerical algorithm (Valentini et al. Reference Valentini, Trávníček, Califano, Hellinger and Mangeney2007). The spatial domain is two-dimensional and is defined by  $D_{\boldsymbol{x}}=\{(x,y)\}=[0,L]\times [0,L]$,
 $L=16\unicode[STIX]{x03C0}$ being the domain size, while the 3-D domain in the velocity space is defined by
 $D_{\boldsymbol{v}}=\{(v_{x},v_{y},v_{z}),-7v_{\text{th},p}\leqslant v_{i}\leqslant 7v_{\text{th},p},i=x,y,z\}$, where
 $v_{\text{th},p}$ is a typical dimensionless proton thermal speed, defined in the next section. Periodic boundary conditions are imposed on the boundaries of the spatial domain
 $D_{\boldsymbol{x}}$ for all quantities, while the DF is imposed to vanish at the boundaries of the velocity–space domain
 $D_{\boldsymbol{v}}$. More details on the numerical method can be found in Valentini et al. (Reference Valentini, Trávníček, Califano, Hellinger and Mangeney2007).
2.2 Stationary configuration
The stationary configuration corresponds to a magnetized plasma with a shearing flow, where the magnetic field  $\boldsymbol{B}_{0}$ is uniform and directed parallel to the sheared bulk velocity
 $\boldsymbol{u}_{0}$. Building such kind of configuration is straightforward in the case of MHD, but it is more complex within a kinetic approach. Explicit solutions have been found by Roytershteyn & Daughton (Reference Roytershteyn and Daughton2008) in the fully kinetic case, and by Malara, Pezzi & Valentini (Reference Malara, Pezzi and Valentini2018) within the HVM approach. Here, we will use the solution of the HVM case, which is briefly described in the following; more details can be found in Malara et al. (Reference Malara, Pezzi and Valentini2018).
We consider a Cartesian reference frame, where the uniform magnetic field is directed along the  $y$ axis:
 $\boldsymbol{B}_{0}=B_{0}\boldsymbol{e}_{y}$ (
 $B_{0}=1$ in code units), while the bulk velocity is directed along
 $y$ as well, but varies in the
 $x$ direction:
 $\boldsymbol{u}_{0}=u_{0}(x)\boldsymbol{e}_{y}$,
 $\boldsymbol{e}_{x}$ and
 $\boldsymbol{e}_{y}$ being the unit vectors in the
 $x$ and
 $y$ directions, respectively. The electric field is vanishing:
 $\boldsymbol{E}_{0}=0$, therefore protons move along helical trajectories, with the helix axis parallel to the
 $y$ direction. In this configuration, the motion invariants are: the particle kinetic energy
 $\mathscr{E}$, the parallel velocity component
 $v_{y}$ and the
 $x$-position of the particle guiding centre
 $x_{c}=x-v_{z}/\unicode[STIX]{x1D6FA}_{p}$, (
 $\unicode[STIX]{x1D6FA}_{p}=1$ in code units). We build a proton DF
 $f_{0}$ in terms of the above constants of motion, which is similar to a Maxwellian, shifted in the
 $v_{y}$ direction by a quantity
 $U(x_{c})$, where
 $U(\cdot )$ is an arbitrary function which contributes to determine the profile
 $u_{0}(x)$ of the bulk velocity. The explicit form of the DF is given by the following combination of the motion constants:
 $$\begin{eqnarray}f_{0}(x,v_{x},v_{y}.v_{z})=\frac{n_{0}}{(2\unicode[STIX]{x03C0})^{3/2}v_{\text{th}0,p}^{3}}\exp \left[-\frac{1}{2v_{\text{th}0,p}^{2}}\left\{v_{x}^{2}+\left[v_{y}-U\left(x-\frac{v_{z}}{\unicode[STIX]{x1D6FA}_{p}}\right)\right]^{2}+v_{z}^{2}\right\}\right],\end{eqnarray}$$
where the meaning of the constants  $n_{0}$ and
 $v_{\text{th}0,p}$ is specified below. Since
 $f_{0}$ is expressed only in terms of single-particle motion constants, it is an exact stationary solution of the Vlasov equation (2.1), provided that both
 $\boldsymbol{B}$ and
 $\boldsymbol{E}$ remain stationary. Calculating the moments of the DF, we find that the associated density is uniform:
 $n\equiv \int f_{0}\,\text{d}^{3}\boldsymbol{v}=n_{0}=\text{const}.$, and the bulk velocity is directed along
 $y$:
 $u_{0x}=u_{0z}=0$. As a consequence, since
 $T_{e}=\text{const.}$, we have
 $\unicode[STIX]{x1D735}p_{e}=0$ (third equation (2.3)). Moreover, with
 $\boldsymbol{u}_{0}$ parallel to
 $\boldsymbol{B}$, and
 $\boldsymbol{B}$ uniform, the generalized Ohm’s law (2.2) implies that
 $\boldsymbol{E}=0$. In turn, this gives a vanishing time derivative of
 $\boldsymbol{B}$ (Faraday’s law (2.3)). In summary, both the electric and magnetic fields are stationary and the considered configuration represents a stationary solution for the entire set of HVM equations.
In the particular case where the function  $U(\cdot )$ is constant, the expression (2.5) reduces to a shifted Maxwellian; therefore, the constant
 $v_{\text{th}0,p}$ can be interpreted as the thermal velocity of protons in regions far from the velocity shear, where the distribution function (2.5) approaches a shifted Maxwellian. The only non-vanishing bulk velocity component
 $u_{0y}$ depends on the function
 $U(\cdot )$ through the expression (Malara et al. Reference Malara, Pezzi and Valentini2018)
 $$\begin{eqnarray}u_{0y}(x)=\frac{1}{(2\unicode[STIX]{x03C0})^{1/2}v_{\text{th}0,p}}\int _{-\infty }^{\infty }U\left(x-\frac{v}{\unicode[STIX]{x1D6FA}_{p}}\right)\exp \left(-\frac{v^{2}}{2v_{\text{th}0,p}^{2}}\right)\text{d}v.\end{eqnarray}$$
Therefore, the bulk velocity profile  $u_{0y}(x)$ does not coincide with
 $U(x)$, except in the case
 $U(x)=U_{0}=\text{const}.$, when
 $u_{0y}(x)=U_{0}$. In general, denoting with
 $\unicode[STIX]{x1D6E5}$ the scale of variation of the function
 $U(\cdot )$, it can be shown that
 $u_{0y}(x)\simeq U(x)$, if
 $\unicode[STIX]{x1D6E5}\gg R_{p}$, where
 $R_{p}$ is the dimensionless proton Larmor radius. Considering the opposite limit
 $\unicode[STIX]{x1D6E5}<R_{p}$, it can also be shown that, in the considered configuration, the actual width of a velocity shear cannot be smaller than the proton Larmor radius (Malara et al. Reference Malara, Pezzi and Valentini2018).
In our case, we used the following form for the function  $U(x)$:
 $$\begin{eqnarray}U(x)=U_{0}\left[\tanh \left(\frac{x-L/4}{\unicode[STIX]{x1D6E5}}\right)-\tanh \left(\frac{x-3L/4}{\unicode[STIX]{x1D6E5}}\right)-1\right],\end{eqnarray}$$
which gives a profile for  $u_{0y}(x)$ with two shears localized at
 $x=L/4$ and
 $x=3L/4$. The bulk velocity is
 $u_{0y}\simeq U_{0}$ in the centre
 $x=L/2$ of the spatial domain, while it is
 $u_{0y}\simeq -U_{0}$ on the two sides
 $x=0$ and
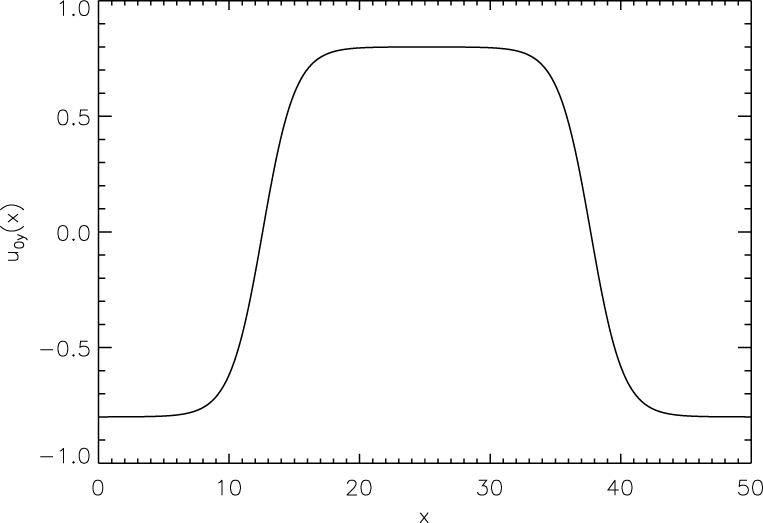
 $x=L$. In particular, we used the following values for the above parameters:
 $U_{0}=0.8$,
 $\unicode[STIX]{x1D6E5}=2.5$. The corresponding profile for the bulk velocity
 $u_{0y}(x)$ is shown in figure 1. The value of
 $U_{0}$ has been chosen relatively large to reduce the phase-mixing time, and, consequently, the computation time. On the other hand, a large jump
 $\unicode[STIX]{x1D6E5}u_{y}$ in the bulk velocity across the shear layers can lead to the development of the Kelvin–Helmholtz (KH) instability which would superpose on the wave dynamics. In order to prevent the KH instability developing in our simulations, we have chosen
 $U_{0}$ sufficiently low to fulfil the condition
 $\unicode[STIX]{x1D6E5}u_{y}<2c_{A}$. This choice stabilizes the system against the KH instability, at least in the MHD case. In particular, we have chosen
 $\unicode[STIX]{x1D6E5}u_{y}\simeq 1.6c_{A}$ (
 $c_{A}=1$ in code units).
Profile of the stationary-state bulk velocity  $u_{0y}$ as a function of
 $x$.

We notice that in the two shear regions the DF (2.5) departs from a shifted Maxwellian. In particular, the proton temperature is anisotropic:  $T_{||}\geqslant T_{\bot }$, where
 $T_{||}$ and
 $T_{\bot }$ are the parallel and perpendicular temperature with respect to the magnetic field direction, respectively, and agyrotropy features are also present (Malara et al. Reference Malara, Pezzi and Valentini2018). Far from the velocity shears the proton temperature becomes isotropic and reaches the value
 $T_{0p}$, corresponding to the asymptotic thermal speed
 $v_{\text{th}0,p}$.
2.3 Alfvénic perturbation
At the initial time  $t=0$ a perturbation is superposed on the above stationary configuration, with properties similar to a linearly polarized large-scale Alfvén wave. Within MHD theory, an Alfvén wave is polarized in the direction perpendicular both to the background magnetic field
 $\boldsymbol{B}_{0}$ and to the wavevector
 $\boldsymbol{k}$. In our case,
 $\boldsymbol{B}_{0}$ is in the
 $y$ direction, while
 $\boldsymbol{k}$ varies in time due to phase mixing, but remains in the
 $x-y$ plane. Therefore, we selected a perturbation polarized along the
 $z$ direction. We considered a proton DF in the form:
 $f=f_{0}+f_{1}$, where the perturbed DF has the form of a Maxwellian shifted in the
 $v_{z}$ direction
 $$\begin{eqnarray}f_{1}(y,v_{x},v_{y},v_{z})=\frac{n_{1}}{(2\unicode[STIX]{x03C0})^{3/2}v_{\text{th}0,p}^{3}}\exp \left\{-\frac{v_{x}^{2}+v_{y}^{2}+\left[v_{z}-U_{z}(y)\right]^{2}}{2v_{\text{th}0,p}^{2}}\right\},\end{eqnarray}$$
where  $U_{z}(y)=\cos (k_{0}y)$, with
 $k_{0}=2\unicode[STIX]{x03C0}/L$ corresponding to a wavelength
 $\unicode[STIX]{x1D706}_{y}$ equal to the domain size
 $L$, and
 $n_{1}$ constant. We notice that
 $\unicode[STIX]{x1D706}_{y}\gg d_{p}=1$. Therefore, the initial perturbation can be considered to be in an MHD regime. The total density is uniform and is given by
 $$\begin{eqnarray}n=\int f_{0}(x,\boldsymbol{v})\,\text{d}^{3}\boldsymbol{v}+\int f_{1}(y,\boldsymbol{v})\,\text{d}^{3}\boldsymbol{v}=n_{0}+n_{1}=\text{const}.\end{eqnarray}$$
This is coherent with the fact that an Alfvén wave does not involve density perturbations. The bulk velocity is given by a weighted average between the stationary-state bulk velocity  $\boldsymbol{u}_{0}$ and the bulk velocity associated with the perturbation
 $$\begin{eqnarray}\boldsymbol{u}(x,y)=\frac{1}{n}\int \boldsymbol{v}f(\boldsymbol{x},\boldsymbol{v})\,\text{d}^{3}\boldsymbol{v}=\frac{n_{0}u_{0y}(x)\boldsymbol{e}_{y}+n_{1}U_{z}(y)\boldsymbol{e}_{z}}{n_{0}+n_{1}}.\end{eqnarray}$$
We have fixed the value  $n_{0}=1$, while the parameter
 $n_{1}$ has been used to determine the amplitude
 $A_{1}=n_{1}/(n_{0}+n_{1})$ of the initial Alfvénic perturbation.
Values of parameters used in the runs.

In the MHD regime, velocity  $\boldsymbol{u}_{1}$ and magnetic field
 $\boldsymbol{B}_{1}$ fluctuations are related by the expression
 $\boldsymbol{B}_{1}=\mp (B_{0}/c_{A})\boldsymbol{u}_{1}$, where
 $c_{A}=1$ is the normalized Alfvén velocity associated with the equilibrium structure and the upper (lower) sign corresponds to waves propagating in the direction of
 $\boldsymbol{B}_{0}$ (opposite to
 $\boldsymbol{B}_{0}$). Therefore, we have chosen the magnetic field initial perturbation as
 $$\begin{eqnarray}\boldsymbol{B}_{1}(y)=-\frac{n_{1}}{n_{0}+n_{1}}U_{z}(y)\boldsymbol{e}_{z}=-A_{1}U_{z}(y)\boldsymbol{e}_{z}.\end{eqnarray}$$
Finally, the initial electric field  $\boldsymbol{E}$ is determined by the generalized Ohm’s law (2.2).
3 Numerical results
We have performed numerical simulations using the HVM numerical code with the initial conditions specified in the previous section. Two simulations have been run, with two different amplitudes of the initial Alfvén wave: a low-amplitude case $A_{1}=9.9\times 10^{-3}$ (corresponding to
 $n_{1}=0.01$, Run 1) and a moderate-amplitude case
 $A_{1}=9.1\times 10^{-2}$ (corresponding to
 $n_{1}=0.1$, Run 2). In both runs the electron temperature is equal to the proton temperature of the stationary state far from the shear layers:
 $T_{e}=T_{0p}$. The proton
 $\unicode[STIX]{x1D6FD}_{p}$ is
 $\unicode[STIX]{x1D6FD}_{p}=2v_{\text{th},p}^{2}/c_{A}^{2}=2$ (i.e.
 $v_{\text{th},p}=c_{A}=1$ in code units) and the typical thermal speed is the one evaluated far from the shear regions
 $v_{\text{th},p}=v_{\text{th}0,p}$. In this configuration the ion inertial length and Larmor radius are equal. We used a grid in the physical space of
 $N_{x}\times N_{y}$ points, with
 $N_{x}=512$ and
 $N_{y}=128$, while the grid in the velocity space has
 $71^{3}$ points. The maximum simulation time is indicated by
 $t_{\text{max}}$ for both runs. Other parameters have been specified in the previous section and are listed in table 1.
3.1 Run 1: small-amplitude perturbation
We start by describing the results obtained in the small-amplitude run (Run 1,  $A_{1}\simeq 0.01$). Due to the low value of the wave amplitude, nonlinear effects are negligible and the dynamics is completely dominated by the interaction of the wave with the inhomogeneity determined by the background velocity shear. Therefore, the purpose of this run is to clearly single out inhomogeneity linear effects, such as phase mixing. In the following, the fluctuating part of any quantity
 $F(\boldsymbol{x},t)$ is defined as
 $\unicode[STIX]{x1D6FF}F=F-\langle F\rangle _{D_{\boldsymbol{x}}}$, where angular parentheses indicate an average over the spatial domain
 $D_{\boldsymbol{x}}$.
Two-dimensional plots in the  $x-y$ plane of fluctuating magnetic field components
 $\unicode[STIX]{x1D6FF}B_{z}$ (a–c) and
 $\unicode[STIX]{x1D6FF}B_{y}$ (d–f) at three different times:
 $t=20$ (a,d);
 $t=60$ (b,e); and
 $t=80$ (c,f). All plots refer to the low-amplitude run (Run 1).

In figure 2 the fluctuating magnetic field component  $\unicode[STIX]{x1D6FF}B_{z}$ is plotted for three different times during the simulation (a–c). At the initial time (not shown), only the
 $\unicode[STIX]{x1D6FF}B_{z}$ component, corresponding to the initial Alfvénic perturbation, is non-vanishing. The effects of phase mixing on the time evolution of
 $\unicode[STIX]{x1D6FF}B_{z}$, due to space variations of the bulk velocity
 $u_{y}$, are clearly visible. The wave propagation velocity
 $\boldsymbol{v}_{W}$ in the simulation reference frame is the sum of the Alfvén velocity plus the bulk velocity
 $\boldsymbol{v}_{W}(x)=[c_{A}+u_{y}(x)]\boldsymbol{e}_{y}$. Accordingly,
 $v_{W}$ is larger in the centre of the spatial domain than on the two sides. As a consequence, initially plane wavefronts are progressively bent in the two velocity shear regions, where the wavevector perpendicular component
 $k_{x}$ locally increases, while the wavelength decreases. Dispersive effects become effective for wavevectors of the order of
 $k_{\text{disp}}\simeq d_{p}^{-1}=1$, corresponding to a wavelength
 $\unicode[STIX]{x1D706}_{\text{disp}}\simeq 2\unicode[STIX]{x03C0}$. At later times in the simulation (
 $t\gtrsim 60$), the wavelength of the perturbation in the shear regions has decreased to
 $\unicode[STIX]{x1D706}\sim \unicode[STIX]{x1D706}_{\text{disp}}$. After that time, dispersive effects becomes relevant, at least within the velocity shear regions. In these regions, we observe that the magnetic fluctuation parallel component
 $\unicode[STIX]{x1D6FF}B_{y}$ (shown in figure 2d–f) increases in time, until reaching values of the same order of
 $\unicode[STIX]{x1D6FF}B_{z}$ for times
 $t\geqslant 60$. In the MHD case, where dispersive effects are neglected, the same phase-mixing problem would give a null
 $\unicode[STIX]{x1D6FF}B_{y}$ for all times, implying that the generation of
 $\unicode[STIX]{x1D6FF}B_{y}$ is only caused by non-MHD dispersive effects. In fact,
 $\unicode[STIX]{x1D6FF}B_{y}$ grows only in the two shear regions, where the wavelength is small enough to make dispersive effects relevant. In summary, in the velocity shear regions perturbations change their properties: the initial linear Alfvénic polarization is modified by the growth of a parallel component
 $\unicode[STIX]{x1D6FF}B_{y}$, the wavevector becomes nearly perpendicular (
 $k_{||}\ll k_{\bot }$) and of the order of the inverse proton Larmor radius. These evidences suggest that the initial Alfvénic perturbation has been locally converted into a KAW.
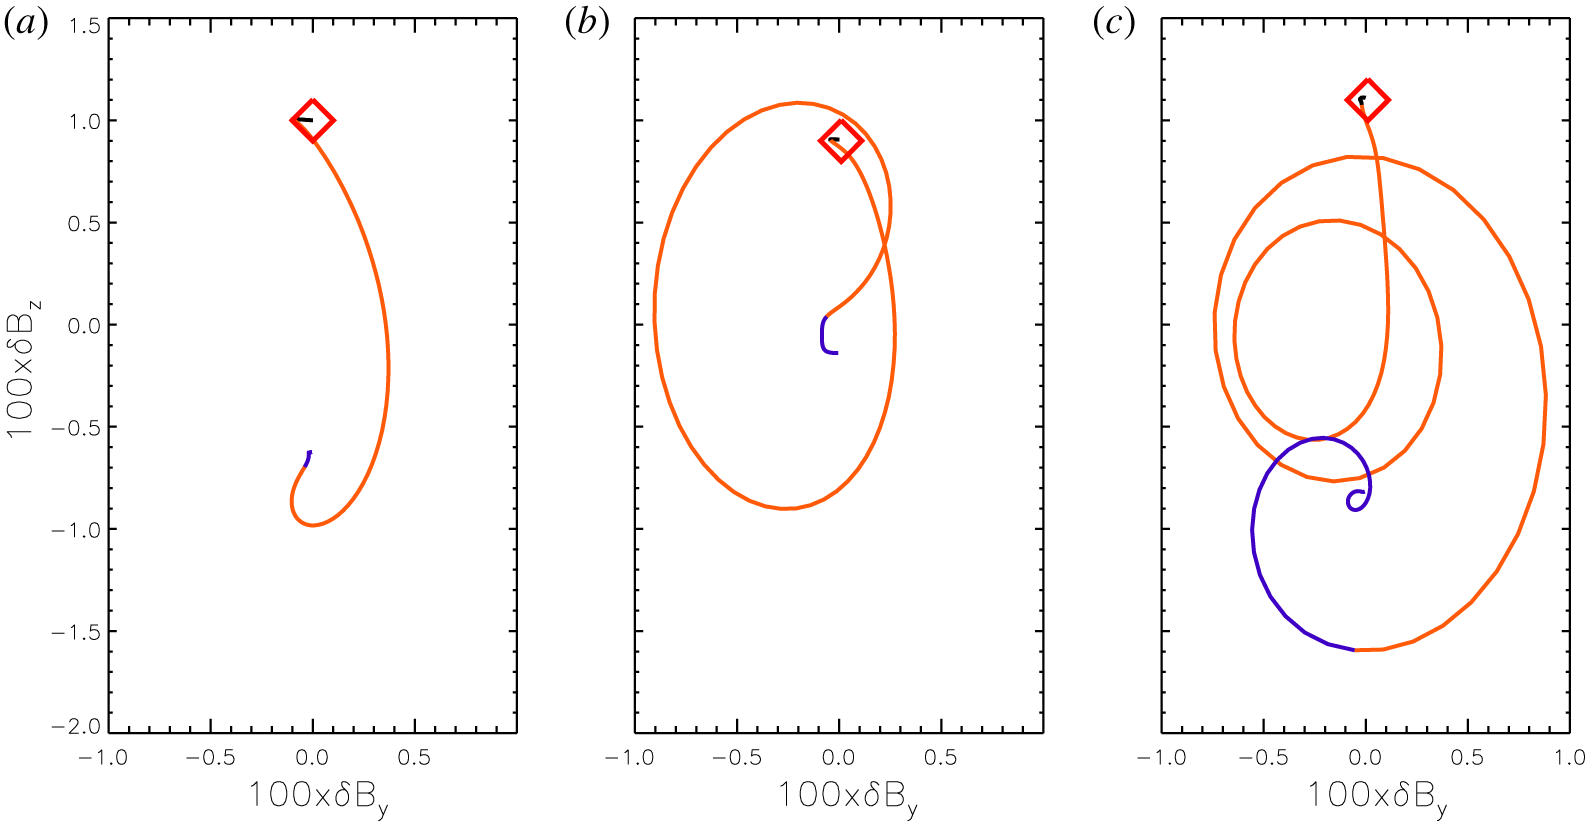
Hodograms in the  $\unicode[STIX]{x1D6FF}B_{y}{-}\unicode[STIX]{x1D6FF}B_{z}$ plane, relative to Run 1, at time
 $t=t_{1}=20$ along the line
 $L/2\leqslant x\leqslant L$,
 $y=y_{1}=10$ (a); at time
 $t=t_{2}=40$ along the line
 $L/2\leqslant x\leqslant L$,
 $y=y_{2}=45$ (b); and at time
 $t_{3}=80$ along the line
 $L/2\leqslant x\leqslant L$,
 $y=y_{3}=15$ (c). Black, orange and blue sections are relative to the intervals
 $L/2\leqslant x<31$,
 $31\leqslant x<44.5$ and
 $44.5\leqslant x\leqslant L$, respectively. The red diamonds indicate the point at
 $x=L/2$.

In order to have a clear identification of the perturbations generated in the velocity shear regions, we have first considered the group velocity  $\boldsymbol{v}_{g}$ of the waves. Vásconez et al. (Reference Vásconez, Pucci, Valentini, Servidio, Matthaeus and Malara2015) have shown that in the dispersive MHD all wave modes have a non-vanishing component of
 $v_{g\bot }$ in the direction perpendicular to
 $\boldsymbol{B}_{0}$. In particular, for fast magnetosonic waves it is
 $v_{g\bot }\gtrsim c_{A}$, while for slow magnetosonic and Alfvén waves it is
 $v_{g\bot }\ll c_{A}$ (Vásconez et al. Reference Vásconez, Pucci, Valentini, Servidio, Matthaeus and Malara2015). In our simulation, we noticed that fluctuations generated in the shear regions propagate also perpendicularly to
 $\boldsymbol{B}_{0}$, in the direction from the centre to the lateral parts of the spatial domain. However, we verified that the transverse propagation speed is one order of magnitude lower than the Alfvén speed. We conclude that such fluctuations cannot belong to the fast magnetosonic branch.
To further discriminate among slow and Alfvénic fluctuations, we have examined how the orientation of  $\unicode[STIX]{x1D6FF}\boldsymbol{B}$ varies along segments parallel to the
 $x$ axis. In the velocity shear regions these segments are quasi-parallel to the wavevector direction. An example is given in figure 3, where three hodograms are plotted:
 $\unicode[STIX]{x1D6FF}B_{z}$ versus
 $\unicode[STIX]{x1D6FF}B_{y}$. These are calculated at three different times: panel (a) refers to the segment defined by
 $L/2\leqslant x\leqslant L$,
 $y=y_{1}=10$ at time
 $t_{1}=20$, panel (b) to the segment
 $L/2\leqslant x\leqslant L$,
 $y=y_{2}=45$ at time
 $t_{1}=40$ and panel (c) to the segment
 $L/2\leqslant x\leqslant L$,
 $y=y_{3}=15$ at time
 $t_{3}=80$. The values
 $y_{1}$,
 $y_{2}$ and
 $y_{3}$ have been chosen such that
 $\unicode[STIX]{x1D6FF}B_{z}(x=L/2,y_{1,2,3},t_{1,2,3})\simeq \max \{\unicode[STIX]{x1D6FF}B_{z}(x=L/2,y,t_{1,2,3}),\,0\leqslant y\leqslant L\}$. Different sections of the segments are indicated by different colours: black corresponds to the central homogeneous region (
 $L/2\leqslant x<31$); orange corresponds to the shear region (
 $31\leqslant x<44.5$); blue corresponds to the lateral homogeneous region (
 $44.5\leqslant x\leqslant L$). The diamond indicates the values of
 $\unicode[STIX]{x1D6FF}B_{y}$ and
 $\unicode[STIX]{x1D6FF}B_{z}$ at the position
 $x=L/2$.
Figure 3 can be used to determine the polarization of the magnetic perturbation in the  $\unicode[STIX]{x1D6FF}B_{y}{-}\unicode[STIX]{x1D6FF}B_{z}$ plane, which is nearly perpendicular to the wavevector in the shear region. Figure 3(a) refers to an early stage of time evolution. At that time, in the shear region (orange section of the curve) the wave polarization is still essentially linear,
 $z$-aligned, as the initial Alfvén wave. In fact, since the perturbation wavelength in the shear region is still larger than
 $d_{p}$ (see figure 2a,d), dispersive effects are not large enough to sensibly modify the initial polarization. In the same hodogram we also notice very small variations of the perturbation in the two homogeneous regions (black and blue sections of the curve); this is due to the fact that the hodogram is drawn along a segment that, in the homogeneous regions, is quasi-parallel to wavefronts.
This latter feature is present also at the time  $t=40$ (figure 3b), but now the polarization in the shear region (orange section) has turned into clockwise elliptical. This polarization change is due to dispersive effects: they are now more relevant in consequence of the wavelength decrease induced by phase mixing. The same polarization is also found in the shear region at
 $t=80$ (panel c); the orange section of the curve has a large number of turns with respect to
 $t=40$ because phase mixing has further decreased the perturbation wavelength. Hodograms calculated along other parallel segments, which are not shown here, display a same behaviour. Considering wave modes within the dispersive MHD (Vásconez et al. Reference Vásconez, Pucci, Valentini, Servidio, Matthaeus and Malara2015), Alfvén and fast magnetosonic waves are both clockwise-elliptically polarized, while slow magnetosonic waves are counter-clockwise polarized. We can therefore exclude that fluctuations generated in the shear regions during system evolution belong to the slow magnetosonic branch.
On the base of the above considerations about polarization and group velocity, the perturbations generated in the velocity shear regions belong to the Alfvén branch, i.e. they are KAWs. Therefore, the phase-mixing mechanism acting in the shear regions gradually triggers a modification from the initial Alfvén wave to KAW fluctuations. Such a transformation takes place gradually in time as the wavevector locally increases and turns, since KAWs belong to the same branch as long-wavelength Alfvén waves. Finally, we notice that a small-amplitude clockwise-elliptically polarized fluctuation is also present in the lateral homogeneous region at time  $t=80$ (figure 3c, blue section); due to the non-vanishing
 $v_{g\bot }$, KAWs do not remain confined in the shear regions but tend to move to the side homogeneous regions.
3.2 Run 2: moderate-amplitude perturbation
When increasing the initial perturbation amplitude, the effects of fluctuating fields on the proton DF become more relevant. In order to study such kinetic effects, and at the same time able to identify the characteristics of the propagation of KAWs during the system evolution, in Run 2 we have chosen a moderately larger amplitude of the initial perturbation  $n_{1}=0.1$, corresponding to
 $A_{1}=0.091$. A larger amplitude would produce significant deformations of the initial equilibrium configuration, making it hard to clearly identify the nature of the transverse fluctuations produced by phase mixing.
The time evolution of magnetic and velocity fields in Run 2 is qualitatively similar to that observed in Run 1 (see figure 2). In particular, the initial Alfvén wave undergoes phase mixing in the two velocity shear regions, locally generating small-scale perturbations with a quasi-perpendicular wavevector. Such perturbations are elliptically polarized in the sense of the Alfvén dispersive branch and slowly expand in the transverse direction, moving outside of the shear regions. Therefore, also in this moderate-amplitude case we can conclude that the initial Alfvén wave is converted into a KAW-like fluctuation by the interaction with the background inhomogeneity due to the velocity shear.
The main differences between the small- and moderate-amplitude cases consist in the modifications of the proton distribution function induced by fluctuations, which are more relevant for Run 2. In order to give a quantitative measure for such a phenomenon, we define the quantity  $\unicode[STIX]{x1D702}$
 $$\begin{eqnarray}\unicode[STIX]{x1D702}(\boldsymbol{x},t)=\frac{1}{n(\boldsymbol{x},t)}\sqrt{\int _{D_{\boldsymbol{v}}}[f(\boldsymbol{x},\boldsymbol{ v},t)-f_{0}(\boldsymbol{x},\boldsymbol{ v})]^{2}\,\text{d}^{3}\boldsymbol{ v}},\end{eqnarray}$$
which represents the  $L^{2}$ norm of the departure (in velocity space) between the proton DF
 $f$, at a position
 $\boldsymbol{x}$ and time
 $t$, and the unperturbed DF
 $f_{0}$ at the same position, normalized to the density. Since
 $\unicode[STIX]{x1D702}$ is a positive–definite quantity, it is useful to consider also its maximum value calculated over the spatial domain, at a given time
 $t$:
 $\unicode[STIX]{x1D702}_{\text{max}}(t)=\max _{D_{\boldsymbol{x}}}\{\unicode[STIX]{x1D702}(\boldsymbol{x},t)\}$. The corresponding position is indicated by
 $\boldsymbol{x}_{M}(t)$:
 $\unicode[STIX]{x1D702}(\boldsymbol{x}_{M}(t),t)=\unicode[STIX]{x1D702}_{\text{max}}(t)$.
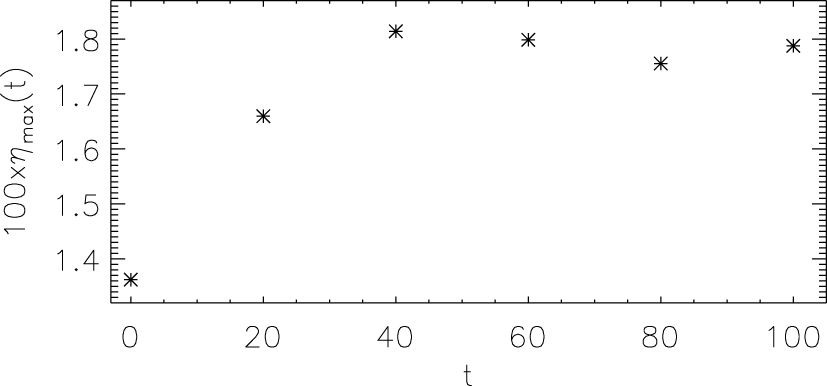
The quantity  $\unicode[STIX]{x1D702}_{\text{max}}$ is plotted as a function of time
 $t$, for the moderate-amplitude run (Run 2).

In figure 4 the quantity  $\unicode[STIX]{x1D702}_{\text{max}}(t)$ is plotted as a function of time, for Run 2. At the initial time it is
 $\unicode[STIX]{x1D702}\neq 0$, due to the DF initial perturbation
 $f_{1}$ which is superposed on the stationary DF
 $f_{0}$. We can see that the departure of the DF
 $f$ from
 $f_{0}$ slightly increases in time, indicating a progressive modification of the DF due to the effects of the perturbation. The growth of
 $\unicode[STIX]{x1D702}_{\text{max}}(t)$ saturates at the time
 $t\simeq 40$, remaining roughly constant after that time. The saturation value is
 $\unicode[STIX]{x1D702}_{\text{max},\text{sat}}\simeq 1.8\times 10^{-2}$, which is
 $\simeq 1.3\,\unicode[STIX]{x1D702}_{\text{max}}(t=0)$. The relatively low increase of
 $\unicode[STIX]{x1D702}_{\text{max}}$ is partially due to the moderate amplitude of the perturbation and partially to the large value of
 $\unicode[STIX]{x1D6FD}_{p}$. In fact, larger values of
 $\unicode[STIX]{x1D6FD}_{p}$ corresponds to larger thermal energy in the proton population, when compared to the energy associated with the perturbation. We expect to find an increase of
 $\unicode[STIX]{x1D702}_{\text{max}}$ more relevant than in the present case, when larger perturbation amplitudes and/or lower
 $\unicode[STIX]{x1D6FD}_{p}$ are considered.
Two-dimensional plots of the quantity  $\unicode[STIX]{x1D702}(\boldsymbol{x},t)$ in the
 $x-y$ plane, at time
 $t=40$ (a) and
 $t=100$ (b), for the moderate-amplitude run (Run 2). Asterisks indicate the positions where
 $\unicode[STIX]{x1D702}$ is maximum at the given time.

In figure 5, 2-D plots of  $\unicode[STIX]{x1D702}(\boldsymbol{x},t)$ in the
 $x-y$ plane are shown at times
 $t=40$ and
 $t=100$. Asterisks indicate the location
 $\boldsymbol{x}_{M}$ where
 $\unicode[STIX]{x1D702}$ attains the maximum value
 $\unicode[STIX]{x1D702}_{\text{max}}$ for the given time. From this figure we see that the largest departures from the background DF
 $f_{0}$ are mainly localized within the velocity shear regions, where the smallest wavelengths form in the perturbation. The spatial structure of
 $\unicode[STIX]{x1D702}(\boldsymbol{x},t)$ appears to be influenced by phase mixing, indicating that the DF is also spatially modulated on a small transverse scale. Therefore, departures from the unperturbed proton DF are strictly related to the generation of small scales, of the order of
 $d_{p}$.
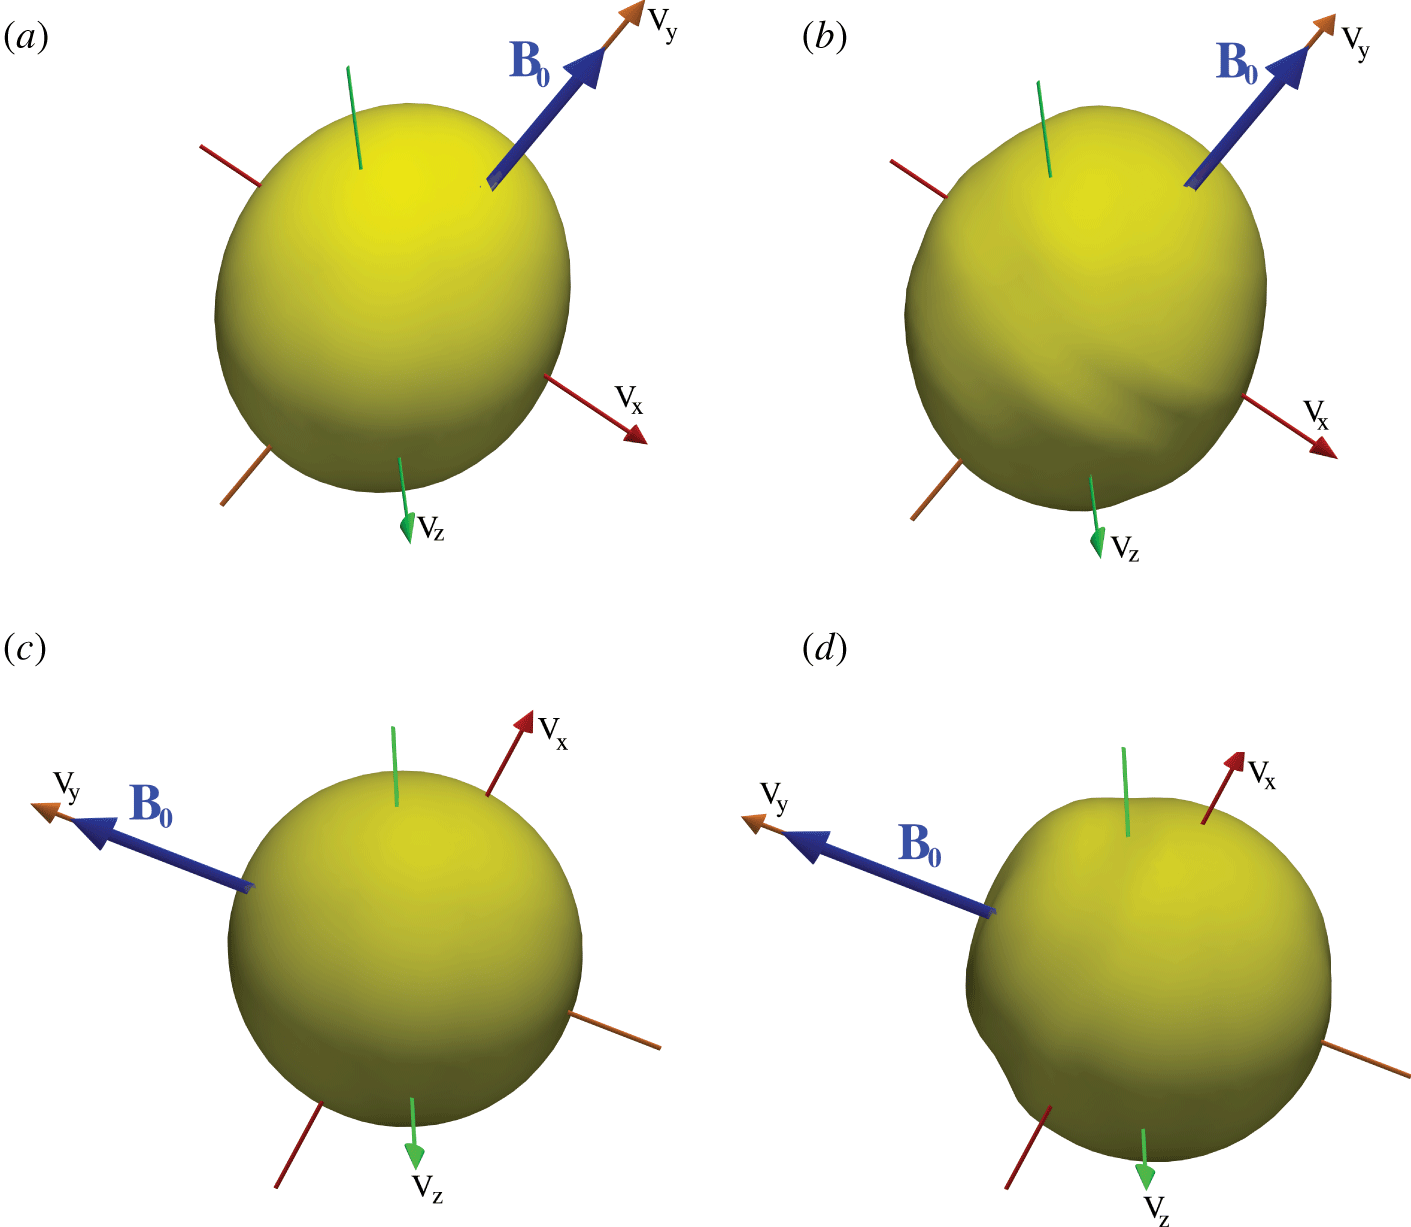
Isosurfaces of the 3-D proton velocity DF  $f(\boldsymbol{x}_{M}(t),\boldsymbol{v},t)$ (b,d), and of the stationary DF
 $f_{0}(\boldsymbol{x}_{M}(t),\boldsymbol{v})$ (a,c), at time
 $t=40$ (a,b) and
 $t=100$ (c,d), calculated in the spatial position
 $\boldsymbol{x}_{M}(t)$ where
 $\unicode[STIX]{x1D702}=\unicode[STIX]{x1D702}_{\text{max}}$ at the given time. Isosurfaces are relative to the values
 $f=f_{0}=0.008$. Plots refer to the moderate-amplitude run (Run 2).

Three-dimensional iso-surface plots of the proton DF  $f(\boldsymbol{x}_{M}(t),\boldsymbol{v},t)$ in velocity space are shown in figure 6 for
 $t=40$ and
 $t=100$, at the position
 $\boldsymbol{x}_{M}(t)$. For comparison, the unperturbed DF
 $f_{0}(\boldsymbol{x}_{M}(t),\boldsymbol{v})$ is plotted at the same position (figure 6a,c). The DF modifications become evident by comparing
 $f$ and
 $f_{0}$. At time
 $t=40$, such variations appear as a modulation in form of rings on the considered isosurface (figure 6b), which are co-axial with the direction
 $y$ of the background magnetic field
 $\boldsymbol{B}_{0}$, indicated by a blue arrow. We can also notice that the unperturbed DF
 $f_{0}$ departs from a Maxwellian, the parallel temperature
 $T_{p||}$ being larger than the perpendicular one
 $T_{p\bot }$ (Malara et al. Reference Malara, Pezzi and Valentini2018). At time
 $t=100$, the DF
 $f$ shows a peculiar feature where
 $\unicode[STIX]{x1D702}=\unicode[STIX]{x1D702}_{\text{max}}$; namely, a ‘bulge’ is present in the isosurface (figure 6d), indicating the presence of a sub-population of protons moving along
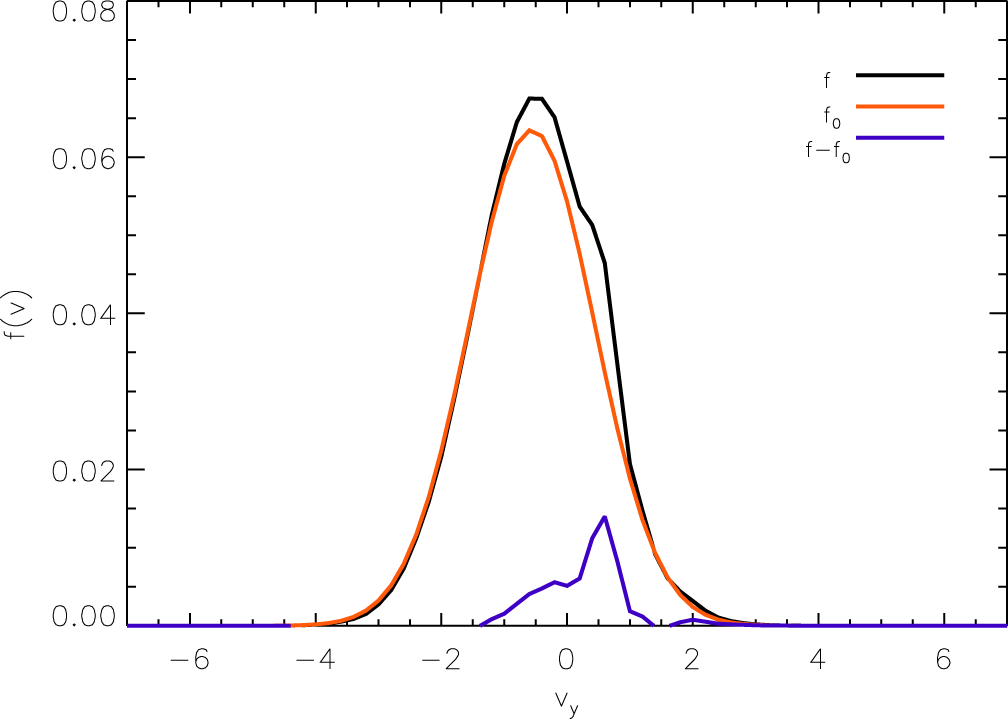
 $\boldsymbol{B}_{0}$ faster than the core particles. The existence of this beam of accelerated protons can also be seen in figure 7, where a ‘cut’ of the DF shown in figure 6 for
 $t=100$ is plotted in velocity space as a function of
 $v_{y}$, for
 $v_{x}=v_{z}=0$ (black line). In the same figure, the corresponding profile of the unperturbed DF
 $f_{0}$ is plotted for comparison (orange line), along with the difference
 $f-f_{0}$ of the two profiles (blue line). The proton beam is evident also in figure 7; in particular, the difference in velocity between the beam and core population along the
 $\boldsymbol{B}_{0}$ direction is
 $\unicode[STIX]{x0394}v_{y}\simeq c_{A}=1$.
Profiles of the proton distribution functions  $f$ (black line),
 $f_{0}$ (orange line) and of the difference
 $f-f_{0}$ (blue line) are plotted as functions of
 $v_{y}$, for
 $v_{x}=v_{z}=0$, at the space position
 $\boldsymbol{x}_{M}(t)$ at time
 $t=100$. Plots refer to the moderate-amplitude run (Run 2).

Concerning the origin of the beam, we observe that KAWs are characterized by a component of the electric field  $E_{y}$ parallel to the background magnetic field
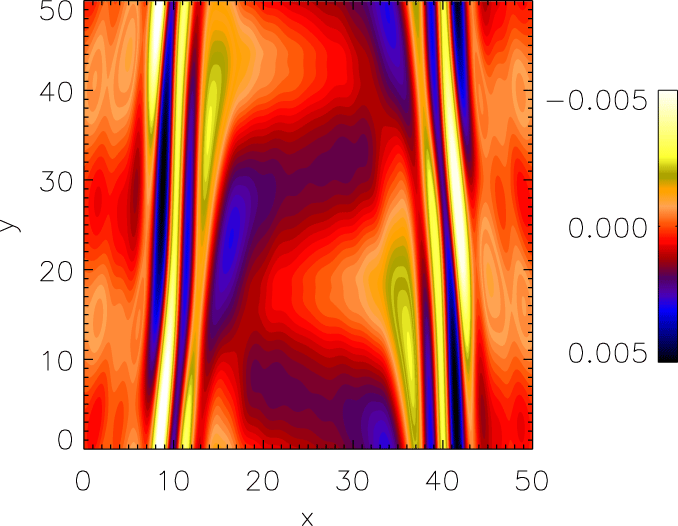
 $\boldsymbol{B}_{0}$ (e.g. Hollweg Reference Hollweg1999). Such a component is vanishing in the limit of ideal MHD and can be responsible for particle energization. In figure 8 a 2-D plot of the parallel electric field component
 $E_{y}$ at the time
 $t=100$ is shown. Figure 8 shows that
 $E_{y}$ is localized in the region where the smallest spatial scales are present in the perturbation, while it is negligible outside. Moreover, the spatial pattern of
 $E_{y}$ is similar to that of other perturbed quantities, and the wavelength in the parallel
 $y$ direction is
 $\unicode[STIX]{x1D706}_{||}=2\unicode[STIX]{x03C0}/k_{0}=L$. As a consequence, we can define a sort of electric potential
 $\unicode[STIX]{x1D719}$, such as
 $E_{y}=-\unicode[STIX]{x2202}\unicode[STIX]{x1D719}/\unicode[STIX]{x2202}y$. Of course, the dependence of
 $\unicode[STIX]{x1D719}$ on
 $y$ is also periodic, with a period equal to
 $L$. Protons, in their motion, feel this periodic potential and can interact with it. In particular, part of the ion population can remain trapped into the potential well associated with the spatially modulated
 $E_{y}$ component. For a given particle kinetic energy, this trapping is more probable for protons which move quasi-parallel to
 $\boldsymbol{B}_{0}$, i.e. with
 $v_{x}$,
 $v_{z}\ll v_{y}$; this latter condition corresponds to the cut in figure 7. The potential well co-moves with the wave along the magnetic field with a velocity
 $\simeq c_{A}$ in the plasma bulk reference frame, which explains why trapped protons have an average velocity of
 $u_{y}(x)+c_{A}$. This process can account for the formation of the DF features observed in figure 7.
Two-dimensional plot of the electric field parallel component  $E_{y}$ in the
 $x-y$ plane, calculated at time
 $t=100$ for the moderate-amplitude run (Run 2).

Indeed, in previous simulations of Alfvén wave phase mixing generated by magnetic field inhomogeneities, the presence of ion beams moving along the magnetic field at the local Alfvén speed has been observed by Vásconez et al. (Reference Vásconez, Pucci, Valentini, Servidio, Matthaeus and Malara2015) and Valentini et al. (Reference Valentini, Vásconez, Pezzi, Servidio, Malara and Pucci2017). These authors have shown that the origin of such beams is the parallel electric field associated with KAW-like fluctuations, generated in the inhomogeneity regions by the phase-mixing mechanism. It is likely that the same physical process is responsible for the creation of suprathermal ion beams also in the case considered in the present paper.
4 Conclusions
In this paper we have studied the evolution of an Alfvén wave in a collisionless plasma, propagating in a stationary configuration characterized by a sheared flow with a uniform magnetic field parallel to the velocity field. The present paper follows many previous investigations, starting from those in incompressible MHD configurations by Ghosh et al. (Reference Ghosh, Matthaeus, Roberts and Goldstein1998a,Reference Ghosh, Matthaeus, Roberts and Goldsteinb). Our study has been carried out numerically, by means of the HVM code. We considered a width of the shear layers of the order of the proton inertial length/Larmor radius. In order to properly describe the unperturbed configuration, we used an exact analytical solution suitable for the HVM approach (Malara et al. Reference Malara, Pezzi and Valentini2018). The physical mechanism acting on the time evolution of the perturbation is phase mixing, induced by transverse variations of the plasma bulk velocity, which bends wavefronts and generates increasingly small scales in the transverse direction. Though the initial perturbation is in a MHD regime, i.e. the wavelength  $\unicode[STIX]{x1D706}$ is initially much larger than proton scales, later in time
 $\unicode[STIX]{x1D706}$ locally becomes of the order of
 $d_{p}$. Once this stage is reached, both dispersive and kinetic effects come into play and the initial Alfvén wave is converted into a KAW. The identification of the perturbation within the shear region as a KAW has been done considering both its polarization, which is turned from linear into clockwise elliptical, and the transverse group velocity, which is non-vanishing but much less than the Alfvén speed.
In the moderate-amplitude run, properly kinetic effects have been observed, such as modifications of the initial stationary distribution function. In the considered case, variations of the DF are not particularly large, due both to the moderate perturbation amplitude and to the large value of the proton beta parameter ( $\unicode[STIX]{x1D6FD}_{p}=2$); in fact, larger values of
 $\unicode[STIX]{x1D6FD}_{p}$ correspond to a lower ratio of the perturbation energy to the bulk thermal energy. We decided not to increase further the amplitude of the initial perturbation as for larger amplitudes the wave features of the KAW are no longer easily identified.
Nevertheless, an interesting feature has been observed, namely, the generation of a beam of suprathermal protons moving along the magnetic field with a speed given by the sum of the Alfvén velocity and the local bulk velocity. The existence of such a beam can be related to an electric field component  $\unicode[STIX]{x1D6FF}E_{||}$ parallel to the magnetic field, which characterizes KAWs, and which has been indeed observed in our simulations in the velocity shears regions, where KAWs are generated. We notice that the presence of magnetic-field-aligned proton beams, is often observed in the solar wind plasma (Marsch Reference Marsch2006). Therefore, our results suggest that such a feature could be related to the presence of KAW-like fluctuations in the solar wind.
Most of the behaviour and features observed in the present simulations have been also found in another situation in which an Alfvén wave propagate in a background configuration where the magnetic field  $\boldsymbol{B}_{0}$ is inhomogeneous, with spatial variations perpendicular to
 $\boldsymbol{B}_{0}$, at scales comparable with the proton Larmor radius (Vásconez et al. Reference Vásconez, Pucci, Valentini, Servidio, Matthaeus and Malara2015; Pucci et al. Reference Pucci, Vásconez, Pezzi, Servisio, Valentini, Matthaeus and Malara2016; Valentini et al. Reference Valentini, Vásconez, Pezzi, Servidio, Malara and Pucci2017). In that case, phase mixing acting on the Alfvén wave is due to spatial variations of the Alfvén velocity. The results found in the latter studies and these obtained in the present investigation can be considered to be complementary. We can conclude that the observed phenomenology is due to phase mixing at proton scales, regardless of the origin of such a process (magnetic field and/or bulk velocity inhomogeneities); in other words, as long as the propagation velocity of Alfvén waves is spatially inhomogeneous in the direction perpendicular to the background field, these can be successfully converted into KAWs.
As a final remark, we observe that the present results have been derived within a simplified configuration, where it is possible to distinguish a single well-defined wave from the inhomogeneous background. Nevertheless, our results give some indications on the possibility of generating KAWs in more complex contexts, like in a turbulent setting. In fact, the wave–inhomogeneity coupling considered in this investigation is of a similar nature as the nonlinear coupling between fluctuations which generate the turbulent cascade in MHD: in a turbulent regime fluctuations with two different  $k$ values couple to produce a third one at higher
 $k$, while in the configuration here considered a fluctuation with a well-defined
 $k$ couples with the
 $k$ coming from the inhomogeneity.
We therefore conclude that the phenomenon we studied is closely related to the mechanism that favours perpendicular spectral transfer in the nonlinear cascade (e.g. Shebalin et al. Reference Shebalin, Matthaeus and Montgomery1983). Moreover, our results give a positive indication about the possibility of generating KAW-like fluctuations at proton scales within a turbulent cascade, as suggested by solar wind observations (Bale et al. Reference Bale, Kellogg, Mozer, Horbury and Reme2005; Sahraoui et al. Reference Sahraoui, Belmont and Goldstein2012).
Acknowledgements
The authors are grateful to Professor W.H. Matthaeus for many useful discussions about the subject of the paper. The work by F.P. has been supported by Fonds Wetenschappelijk Onderzoek – Vlaanderen (FWO) through the postdoctoral fellowship 12X0319N. This paper has received funding from the European Union’s Horizon 2020 research and innovation program under grant agreement no. 776262 (AIDA, www.aida-space.eu).