Introduction
The housefly, Musca domestica is a cosmopolitan species of great human and veterinary importance considered to be a major pest in livestock systems (Greenberg, Reference Greenberg1973; Smith, Reference Smith1986). The species originated from the Afrotropical region and with urbanization subsequently have colonized Europe and North America (Krafsur et al., Reference Krafsur, Bryant, Marquez and Griffiths2000). It is synanthropic and a public health threat because both adults and saprophagous larvae feed on feces, vomitus and decaying animal and vegetable matter. As a vector of a range variety of viral, bacterial and other pathogens (over 100 according to Sanchez-Arroyo, Reference Sanchez-Arroyo2008), the housefly has an important role in disease transmission to humans and animals (Grübel et al., Reference Grübel, Huang, Masubuchi, Stutzenberger and Cave1998; Sehgal et al., Reference Sehgal, Bhatti, Bhasin, Sood, Nada, Malla and Singh2002; Cafarchia et al., Reference Cafarchia, Lia, Romito and Otranto2009; Barin et al., Reference Barin, Arabkhazaeli, Rahbari and Madani2010; Wanaratana et al., Reference Wanaratana, Panyim and Pakpinyo2011). Pathogens living inside and/or on its body surface can be transmitted through mouth secretions, mechanically and through feces (Cafarchia et al., Reference Cafarchia, Lia, Romito and Otranto2009) causing serious diseases such as cholera, typhoid fever, bacillary dysentery, tuberculosis, anthrax ophthalmia, amebiais and poliomyelitis (Greenberg, Reference Greenberg1970, Reference Greenberg1973; Sanchez-Arroyo, Reference Sanchez-Arroyo2008).
The housefly is thought to be a species complex within which three subspecies are recognized: M. domestica s. s. with a largely temperate distribution, and M. domestica calleva Walker (1849) and M. domestica curviforceps Sacca and Rivosechi (1955)that occur in Africa. Different selection pressures such as diverse breeding substrates, insecticides usage and weather conditions have great influence on morphological and genetic variation of the housefly (e.g., Marquez & Krafsur, Reference Marquez and Krafsur2002; Krafsur et al., Reference Krafsur, Cummings, Endsley, Marquez and Nason2005; Čičková et al., Reference Čičková, Kozánek and Takáč2013). However, resistance to chemicals used in livestock production is now an immense practical problem challenging the management of the target insect pest (Chapman et al., Reference Chapman, Learmount, Morris and McGreevy1993; Kaufman et al., Reference Kaufman, Nunez, Mann, Geden and Scharf2010).
The housefly is highly fecund, with short life cycles, high growth rate and potential to mass rearing (Krafsur, Reference Krafsur1985; Black & Krafsur, Reference Black and Krafsur1987; Chapman & Goulson, Reference Chapman and Goulson2000; Pastor et al., Reference Pastor, Čičková, Kozánek, Martinez-Sánchez, Takáč and Rojo2011). In nature, temperate latitude populations of M. domestica overwinter in restricted habitats (e.g., closed livestock facilities), breeding slowly and continuously (Krafsur, Reference Krafsur1985; Black & Krafsur, Reference Black and Krafsur1986a ) and hence experience periodic bottlenecks followed by reduced genetic diversity (Black & Krafsur, Reference Black and Krafsur1986b ). Accordingly, because of environmental (e.g., insecticides) and/or genetic disturbances (genetic bottleneck) the individuals may experience during their development, developmental stability can be affected resulting in a violation of bilateral symmetry (Leamy & Klingenberg, Reference Leamy and Klingenberg2005). Developmental stability, an ability of individuals to produce a specific phenotype under a given set of environmental and genetic conditions (Palmer & Strobeck, Reference Palmer and Strobeck1986; Møller & Swaddle, Reference Møller and Swaddle1997), is of great adaptive importance since it conditions the accurate replication of the selected phenotype (Debat et al., Reference Debat, Bloyer, Faradji, Gidaszewski, Navarro, Orozco-terWengel, Ribeiro, Schlötterer, Deutsch and Peronnet2011). The evidence that environmental and genomic stresses induce the significant levels of developmental instability (DI) is numerous (e.g., Palmer & Strobeck, Reference Palmer and Strobeck1986; Palmer, Reference Palmer and Markow1994, Reference Palmer1996; Møller & Swaddle, Reference Møller and Swaddle1997; Pertoldi et al., Reference Pertoldi, Kristensen, Andersen and Loeschcke2006).
There are three kinds of bilateral asymmetry: fluctuating asymmetry (FA; within-individual variation), directional asymmetry (DA) and antisymmetry (AS). FA refers to subtle, random (non-directional) departures from the perfect symmetry in bilaterally paired traits that result in a normal distribution of asymmetry around a mean of zero (Van Valen, Reference Van Valen1962; Palmer & Strobeck, Reference Palmer and Strobeck1986, Reference Palmer and Strobeck1992; Palmer, Reference Palmer and Markow1994). FA is considered to reflect the efficiency of developmental mechanisms to buffer environmental and genetic stress, and therefore has been commonly used as a reliable estimator and epigenetic measure of developmental homeostasis (Palmer & Strobeck, Reference Palmer and Strobeck1992; Clarke, Reference Clarke1993; Stige et al., Reference Stige, David and Alibert2006; Van Dongen et al., Reference Van Dongen, Lens, Pape, Volckaert and Raeymaekers2009). DA is characterized by unimodal distribution of asymmetry and presents consistent difference between a pair of a morphological structure meaning that the same side is always larger than the other. AS is characterized by bimodal distribution with zero mean and presents deviation from symmetry toward either the right or left sides (Van Valen, Reference Van Valen1962; Palmer & Strobeck, Reference Palmer and Strobeck1986, Reference Palmer and Strobeck1992; Palmer, Reference Palmer and Markow1994). DA and AS are thought to have significant genetic basis and, therefore, are unsuitable for study of DI (Palmer & Strobeck, Reference Palmer and Strobeck1992; Palmer, Reference Palmer and Markow1994).
Previous studies of wing FA in M. domestica are rare and usually were aimed at detecting the presence of wing asymmetry using wing length (presented as one linear measurement), and to examine the relationship between various factors and asymmetry. Published results were conflicting. For instance, Møller (Reference Møller1996) reported FA but not DA in the wild-caught flies and those emerging from pupae collected from the wild. In addition, in two separate studies using flies collected from the same site and subsequently reared in laboratory, the first study revealed that flies did not exhibit FA, but rather were directionally asymmetrical (Goulson et al., Reference Goulson, Bristow, Elderfield, Brinklow, Parry-Jones and Chapman1999), whereas in the latter no evidence of DA was found (Chapman & Goulson, Reference Chapman and Goulson2000). Although previously no relationship between asymmetry and the likelihood of mating had been found (Goulson et al., Reference Goulson, Bristow, Elderfield, Brinklow, Parry-Jones and Chapman1999), finally it was discovered that houseflies with low wing length FA had a higher mating success, and that FA was influenced by rearing temperature (Chapman & Goulson, Reference Chapman and Goulson2000). Similarly, Møller (Reference Møller1996) found that FA in wing length was negatively correlated with mating success in both male and female, resistance to disease and likelihood of predation by swallows.
As wing size is correlated to fitness through general body size (Bryant & Meffert, Reference Bryant and Meffert1990, Reference Bryant and Meffert1996) and, that, the size of insects is an important factor governing individual fecundity and survival (Emerson et al., Reference Emerson, Bailey, Walraven and Lindsay2001), we used wing traits in this study. It has been known that fitness is strongly affected by flight performance (Speight et al., Reference Speight, Hunter and Watt2008), which, in turn, depends on variety of factors including wing asymmetry (see Breuker et al., Reference Breuker, Gibbs, Van Dongen, Merckx, Van Dyck and Elewa2010 and references herewith). Insect wing is a flatten rigid two-dimensional structure with homologous venation among individuals. Veins intersections provide accurate record of a large number of useful landmarks that can easily be compared within and between samples using geometric morphometrics (Zelditch et al., Reference Zelditch, Swiderski, Sheets and Fink2004). The application of geometric morphometrics allows depicting patterns of morphological variation (Bookstein, Reference Bookstein1991; Rohlf & Marcus, Reference Rohlf and Marcus1993; Klingenberg et al., Reference Klingenberg, McIntyre and Zaklan1998), and quantifying left–right differences in the wing size and shape among and within individuals giving more precise assessment of asymmetry. Therefore, utilization of geometric morphometrics to depict patterns of subtle variation in wings is powerful tool for assessment of asymmetry (Klingenberg & McIntyre, Reference Klingenberg and McIntyre1998; Klingenberg et al., Reference Klingenberg, Barluenga and Meyer2002; Breuker et al., Reference Breuker, Patterson and Klingenberg2006b ; Debat et al., Reference Debat, Bloyer, Faradji, Gidaszewski, Navarro, Orozco-terWengel, Ribeiro, Schlötterer, Deutsch and Peronnet2011) as well as developmental origin of morphological integration (Klingenberg & Zaklan, Reference Klingenberg and Zaklan2000; Klingenberg, Reference Klingenberg and Polak2003b ).
Accordingly, our first aim was to use a geometric morphometric approach and multivariate statistics to examine within-individual asymmetry (FA) in wing size and shape within and among wild populations and laboratory colonies of M. domestica. A laboratory colony provides an excellent model for studying the evolutionary trajectories of population adaptation to changing environments as well as mechanisms responsible for shaping both genetic and phenotypic variation (e.g., Bryant & Cowles, Reference Bryant and Cowles2000; Reed & Bryant, Reference Reed and Bryant2001; Cafarchia et al., Reference Cafarchia, Lia, Romito and Otranto2009; Trotta et al., Reference Trotta, Cavicchi, Guerra, Andersen, Babbitt, Kristensen, Pedersen, Loeschcke and Pertoldi2011), including inbreeding and bottleneck experiments (e.g., Backus et al., Reference Backus, Bryant, Hughes and Meffert1995; Meffert et al., Reference Meffert, Regan, Hicks, Mukana and Day2006; Meffert & Regan, Reference Meffert and Regan2006) and environmental–genotype interactions (e.g., Fox & Reed, Reference Fox and Reed2011; Fox et al., Reference Fox, Stillwell, Wallin, Curtis and Reed2011). Given the FA in wing shape, the second aim was to examine whether the amount of shape FA differed significantly among samples within each group (wild and laboratory) and between groups. Finally, comparing the laboratory-bred and wild-caught fly samples of the species we ask if there is consistency in patterns of left–right displacements of landmarks. Thus, given the fact that houseflies face different changes in their environment that have impact on their adaptation and survival, the findings gave us deeper insights into the potential of the housefly to respond to stress.
Material and methods
Sample collection
Samples used in this study were previously subjected to analysis of genetic diversity (using allozyme loci and COI mtDNA) and phenotypic variation (geometric morphometric analysis of wing size and shape) (Milankov V., Ludoški J., Francuski Lj., Pastor B., Martínez-Sánchez A., Ståhls G. and Rojo S., unpublished data). Since quantifying molecular and phenotypic diversity is of particular interest to an insect vector of pathogens associated with animal and human diseases, we contrasted the diversity between allozyme nuclear loci and COI mtDNA haplotype diversity, and the diversity of these two markers with phenotypic variation of wings (size and shape) between wild populations and laboratory colonies of M. domestica. In that study, laboratory colonies subjected to inbreeding and genetic and demographic stochasticity had a lower allozyme variation that is coupled with higher phenotypic differentiation, compared to the outbred populations. However, COI mtDNA variation did not show association with reduced genetic variation at allozyme nuclear loci in laboratory colonies nor wild populations. Since the shift in phenotypic divergence was observed (larger intra – than interpopulation divergence in outbred comparing to inbred samples), a deeper insight into distribution of phenotypic variation remained. Therefore, we performed analyses presented in this study.
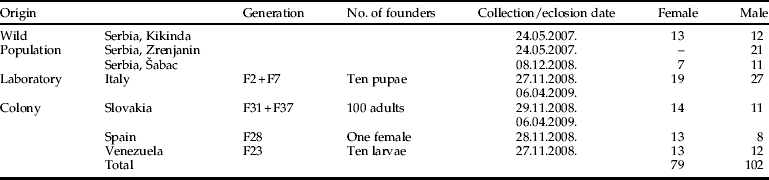
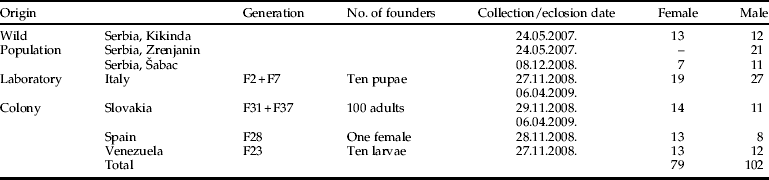
Samples of wild adult specimens were collected in urban areas using an entomological net in and around private houses from three localities in Serbia (Kikinda, Šabac and Zrenjanin) (Table 1). The geographic distances between the collecting sites in a straight line are approx. 50 km (Kikinda – Zrenjanin), 90 km (Zrenjanin – Šabac) and 135 km (Kikinda – Šabac). Two samples were collected in spring (Kikinda and Zrenjanin) and one in winter (Šabac). Individuals were transported to the laboratory where they were frozen alive and preserved for further genetic and morphometric analyses. Laboratory colony samples consisted of specimens reared in the laboratory at the University of Alicante (CIBIO, Spain). Colonies were established with different numbers of founders (gravid females, pupae or mature larvae), both wild and captive individuals, and origin (Italy, Slovakia, Spain and Venezuela) (Table 1). Italian colony was established from several commercial pupae obtained from Italy and individuals used were the 2nd and 7th generations after colony was started at the University of Alicante in 2008. Slovak colony was created from a mixture of flies from Ivanka pri Dunaji (close to Bratislava), Velke Bierovce (about 100 km north from Bratislava, west Slovakia) and Liptovska Tepla (central Slovakia in low Tatras). This strain was established in 1988 and was maintained almost 20 years in laboratory conditions at Zoological Institute (Slovak Academy of Sciences). In summer 2006, several pupae were transported to the laboratories at University of Alicante (CIBIO, Spain) and flies used here were the 31th and 37th generations reared in Alicante. Since geometric morphometric analysis of wing traits did not reveal significant differences in size and shape between generations in Italian (F2 and F7) and Slovak (F31 and F37) samples, individuals of both generations were pooled. Spanish colony (Alicante) was started from a single female captured in the campus of the University of Alicante in autumn of 2006 and the individuals used here were the 28th generation reared in laboratory. Finally, Venezuelan colony was obtained from the mature larvae feeding on a lamb cadaver in the Cerro Saroche National Park (central-western zone of Lara State). Pupae were transported to the laboratories of CIBIO, and there have been reared since February of 2007. Individuals used in this paper were the 23rd generation. The generation number only indicates the generations reared in Alicante laboratory. In the laboratory, larvae were reared in pig manure at low density (0.5 ml eggs per 1 kg manure). Once larvae pupated, pupae were separated from the manure by flotation and transferred to cages (40×40×40 cm). During each generation, adults were maintained under constant temperature, humidity and photoperiod (22±0.2 °C, 57±1.5% RH, 14:12 L:D) and were provided with water and food (sugar mixed with milk powder in a ration of 2:1) disposed ad libitum (Pastor, Reference Pastor2011).
Origin and sample size of Musca domestica used in this study. Generation number means the life cycles completed in laboratory at the University of Alicante.
Geometric morphometrics
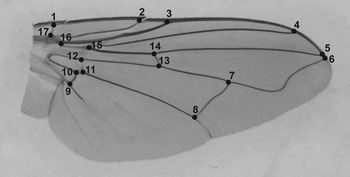
Right and left wings of 79 females and 102 males of M. domestica (Table 1) were gently dissected at the point of articulation with thorax and mounted between microscope slides and coverslips using Hoyer's medium. Wing images were captured using a digital camera Leica DFC320 connected to a stereomicroscope Leica MZ12.5. 17 landmarks positioned at vein intersections or terminations were collected using TpsDig 2.16 (Rohlf, Reference Rohlf2010) and expressed as x- and y-coordinates in a Cartesian space (fig. 1). To quantify and minimize measurement error all wings were digitized twice by the same person (Ludoški J.). From landmark coordinates centroid size (CS; the square root of the sum of squared distance between each landmark and the wing centroid) and shape information (Procrustes coordinates) were extracted using a full Procrustes fit (Klingenberg & McIntyre, Reference Klingenberg and McIntyre1998). Procrustes fit was performed on the whole data set (females and males pooled in the same file). Prior to further analyses Grubb's test (a free calculator available at http://www.graphpad.com/quickcalcs/Grubbs1.cfm) was performed on centroid size and Procrustes coordinates in order to detect outliers from normal distribution and no outliers were found.
The locations of 17 landmarks selected for geometric morphometric analysis of Musca domestica.

Statistical analysis
Analysis of asymmetry of wing size and shape was performed with pooled sexes because there were no significant differences between sexes in shape asymmetry (see the Results section). Given that studying object (wings) has a matching symmetry, shape variation was separated into symmetric component (among-individual variation) and asymmetry component (within-individual variation) (Klingenberg et al., Reference Klingenberg, Barluenga and Meyer2002). Symmetric component contains shape variation among individual that is variation in the left–right averages (within individual) of a wing. Asymmetry component (shape FA) considers variation within each individual, expressed as right–left differences analogous to the signed right–left differences in univariate approaches.
-
(a) Asymmetry, measurement error and AS: Asymmetry of wings was investigated following Klingenberg & McIntyre (Reference Klingenberg and McIntyre1998). Procrustes ANOVAs on centroid size and Procrustes coordinates were used to assess contribution of individual variation, FA, DA, and measurement error (E) to the overall variation. In the model implemented herein ‘Individuals’ (I) refers to a random factor that assesses variation among individuals, ‘Sides’ (S) is a fixed factor that assesses DA, S×I interaction assesses FA, and E assesses variation in the replicate measurements (Leamy, Reference Leamy1984; Palmer, Reference Palmer and Markow1994). Prior to the calculation of measurement error and asymmetry, the data were checked for AS, deviation from symmetry toward either the right or left sides. The Kolmogorov–Smirnov test was used to examine deviation of signed right–left side differences from normality.
-
(b) The equality of shape FA variances in different groups: Individual shape asymmetries are scores (shape FA scores) that quantify the amount of FA for each individual expressed either in units of Procrustes distance (absolute shape differences) or by using Mahalanobis distances (Klingenberg & Monteiro, Reference Klingenberg and Monteiro2005). More specifically, distances represent an amount of deviation of each individual from mean asymmetry, which is analogous to signed left–right differences. These two distances quantify shape variation differently (for details see Klingenberg & Monteiro, Reference Klingenberg and Monteiro2005 and references therein). Procrustes distance is a measure of absolute shape differences and treats shape deviations from the sample mean equally, regardless of their direction (isotropic model) (Dryden & Mardia, Reference Dryden and Mardia1998). Mahalanobis distance measures the differences between groups relative to the within-group variation and therefore accounting for the group-specific direction of shape variation (e.g., Mardia et al., Reference Mardia, Kent and Bibby1979). To calculate Mahalanobis distance we used the pooled covariance matrix of wild or laboratory groups depending on the assignment of populations to a respective group. Differences in the amounts of shape FA (shape FA variances) were tested with Levene's test of homogeneity of variances using both distances. Variances of shape FA were obtained dividing sums of squared deviations of shape FA scores from the mean asymmetry of respective group by appropriate degrees of freedom (Breuker et al., Reference Breuker, Patterson and Klingenberg2006b ).
Additionally, we tested differences of mean shapes of FA between the pairs of groups (within and among natural populations and laboratory colonies). The permutation test with 10,000 iterations was used to assess statistical significance against the null hypothesis of equal group shape means.
-
(c) Associations of size and shape FA variation: Since FA (of size and shape) might be influenced by size differences, its effects have to be considered (Palmer & Strobeck, Reference Palmer and Strobeck1986). Size estimates were calculated as individual's mean of both wings (mean CS) as well as signed right–left differences in CS (size FA). To observe the association of amounts of both size estimates (mean CS and size FA) and shape asymmetry (shape FA), we employed two methods. Firstly, we compared correlation between both size estimates and univariate estimator of shape variation (shape FA scores expressed as both Procrustes and Mahalanobis distances) (Breuker et al., Reference Breuker, Patterson and Klingenberg2006b ). This was done for each group (laboratory and wild) as well as for each sample within each group. Secondly, we analyzed allometry to assess whether size (both mean CS and size FA) had an effect on shape FA using multivariate regression, treating shape wholly in multivariate context. Namely, the association between size and shape could be due to developmental and/or functional constraints (Breuker et al., Reference Breuker, Patterson and Klingenberg2006b ). Therefore, shape FA was regressed onto size estimates. The statistical significance of regression was estimated using the permutation test with 10,000 iterations against the null hypothesis of independence between size and shape.
-
(d) Pattern of shape FA variation: To infer relationships among landmarks in shape FA we employed two methods. Firstly, the pattern of shape FA variation among samples within wild and laboratory groups was assessed with matrix correlation between covariance matrices. We used matrix correlation to quantify general patterns of joint landmark displacement. Matrix correlation was calculated with (full variance–covariance matrix) and without (matrix constituted of covariance alone) the diagonal blocks of the covariance matrices and tested against the null hypothesis of complete dissimilarity with 10,000 random permutations of landmarks. Since covariance concerns joint displacement of landmarks, comparing groups with and without diagonal blocks allows detailed assessment of overall directionality of shape FA. Secondly, we used principal component analysis (PCA) on covariance matrix derived from the asymmetry component of shape variation (shape FA) for more detailed investigation and visualization of the pattern of variation of asymmetry. For samples that had shown the presence of allometry (significant dependence between size estimates and shape FA) residuals from the multivariate regressions were used in subsequent analyses of landmark variation. To visualize the shape variation, we used the first principal component (PC1) since it accounts for the most of variation in the original landmark configuration compared to the other PCs.
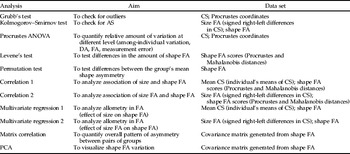
Morphometric and statistical analyses were conducted using the MorphoJ package (Klingenberg, Reference Klingenberg2011) (Procrustes ANOVA, multivariate regression, differences between the mean shape asymmetry of respective groups, matrix correlation, PCA), Statistica 10 (Stat Soft, 2011) (MANOVA, Kolmogorov–Smirnov test, Levene's test, correlation) and R software 2.15.1 (R Development Core Team, 2008) (calculation of Mahalanobis distances). All statistical analyses and data sets on which they were performed are summarized in Table 2.
The analyses and data sets used for studying asymmetry in Musca domestica wing size and shape (CS – centroid size, FA – fluctuating asymmetry, DA – directional asymmetry).

Results
The permutation test revealed the absence of significant intersexual differences in asymmetry of mean shapes when both Procrustes (0.0021, P=0.08) and Mahalanobis (0.7941, P=0.78) distances were used. One-way MANOVA with shape asymmetry as dependent and sex as independent variable, confirmed that sexes did not differ significantly in the amount of shape FA (Wilk's Λ=0.86, F (30,150)=0.78, P=0.78). Therefore, in subsequent analyses we pooled sexes.
Asymmetry, measurement error and AS
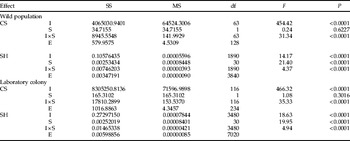
The Procrustes ANOVA performed on the whole sample of individuals from wild populations and on those reared in laboratory (within group analysis) indicated the significant individual variation and FA in wing size, and individual variation, DA and FA in wing shape. Also, the amount of measurement error for wing size and shape was estimated and in both wild populations and laboratory colonies, mean squares of FA, DA and individual variation were higher than error component indicating that measurement error was minor relative to wing size and shape variation (Table 3). The results of Procrustes ANOVA on wing size and shape for each of the three wild populations and four laboratory colony samples are given in Tables S1 and S2 (Supplementary material). For wing size, in all samples we observed the highly significant individual variation and FA, whereas DA was detected only in the Italy sample. The Procrustes ANOVA of shape variation revealed significant individual variation, FA and DA in all samples. Furthermore, Kolmogorov–Smirnov test demonstrated that the signed differences between right and left wings did not depart significantly from unimodal normal distribution representing the absence of AS in the data. Overall, contribution of FA variation compared to other sources of variation in both wild and laboratory groups was more consistent for size, than for shape: size FA variation contributed around 0.21% to total wing size variation. For the wing shape, FA contributed 6.2 and 4.9% to total shape variation in the wild and laboratory groups, respectively.
Procrustes ANOVA of centroid size (CS) and wing shape (SH) for Musca domestica. We presented sum of squares (SS), mean squares (MS), degree of freedom (df), F and P-values for the random effect ‘Individuals’ (I), fixed effect ‘Side’ (S), the ‘Individuals×Sides’ interaction (I×S), which assesses fluctuating asymmetry and measurement error (E).

FA: within-group difference in amounts and mean shapes
Individual FA scores quantified by Procrustes and Mahalanobis distances were used to calculate variance of shape FA. These two measurements were correlated to each other in both wild populations (r=0.49, P<0.001) and laboratory colonies (r=0.62, P<0.001). Differences in the amount of shape FA among samples within groups (wild and laboratory) were not significant using both Procrustes (wild populations: F (2,61)=2.67, P=0.08; laboratory colonies: F (3,113)=2.39, P=0.07) and Mahalanobis (wild populations: F (2,61)=0.98, P=0.38; laboratory colonies: F (3,113)=0.37, P=0.78) distances. Differences between group's mean shape configurations tested with the permutation test performed on Procrustes distances were not significant among samples within wild group (Procrustes distance=0.0033–0.0039, P=0.21–0.39 for all pairs) and within laboratory group for pairwise comparisons of Slovakia, Spain and Venezuela colony (Procrustes distance=0.0032–0.0033, P=0.34–0.56 for all pairs), but significant among pairs Italy and other laboratory colonies (Procrustes distance=0.0047–0.0063, P=0.0002–0.0023 for all pairs).
Associations between size and shape variation of asymmetry
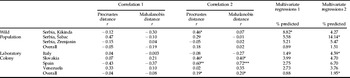
For wild populations, the correlations among amounts of shape FA and both mean CS and size FA were not significant when both shape measures were used (mean CS: Procrustes distance r=−0.05, P=0.72, Mahalanobis distance r=−0.18, P=0.14; size FA: Procrustes distance r=0.18, P=0.17, Mahalanobis distance r=0.02, P=0.88). When populations were analyzed separately the significant correlation was only found in Kikinda sample for size FA and Procrustes distance (r=0.46, P=0.02) (Table 4). Furthermore, to evaluate whether size has an effect on shape asymmetry (allometric effect) multivariate regressions of shape FA on size estimates were performed across samples. For an overall sample of wild populations non-significant allometry was found using both mean CS and size FA accounting for 0.89% (P=0.87) and 1.51% (P=0.44) of the total shape variation, respectively. The relationships between size and shape asymmetry within each analyzed population are given in Table 4. The permutation tests indicated that the allometric effect was significant in Kikinda sample (8.82%; P=0.04) for mean CS, and in Šabac sample (14.14%; P=0.019) for size FA.
Correlations between wing size estimates (mean CS and size FA) and univariate estimator of shape variation (Procrustes and Mahalanobis distances) and multivariate regressions of the Procrustes coordinates of asymmetry component onto wing size estimates within each analyzed sample of Musca domestica. Data sets used for each analysis is specified in Table 2. % predicted indicates the amount of size-related shape variation.

* P<0.05; **P<0.01; ***P<0.001.
Contrary to wild populations, for laboratory colonies significant correlations were found between amounts of shape FA and size FA when both Procrustes (r=0.19, P=0.04) and Mahalanobis (r=0.20, P=0.03) distances were used but not for shape FA and mean CS (Procrustes distance: r=−0.04, P=0.70; Mahalanobis distance: r=−0.08, P=0.41). The correlations calculated for each sample separately using both shape variation measures and both size estimates were significant only for size FA in laboratory colonies Slovakia (Procrustes distance: r=0.46, P=0.02; Mahalanobis distance: r=0.40, P=0.05) and Spain (Procrustes distance: r=0.60, P=0.004; Mahalanobis distance: r=0.72, P<0.001). For an overall sample, regression of shape FA on size FA was significant (P=0.015) and allometry accounts for only 1.95% of the total shape FA, whereas regression onto mean CS was not significant (P=0.40) and allometry accounts 0.88% of shape variation. Within four laboratory colony samples significant allometry among individuals was present only in Italy sample (4.59%; P=0.04) (Table 4).
Pattern of shape FA variation
The covariance structure calculated from asymmetry component of shape variation (shape FA) between pairs of groups were compared in two ways, including and excluding diagonal elements of matrix (the variances of landmark coordinates and the covariances between the x- and y-coordinates of each landmark). Comparison of covariance matrices of wild samples revealed the significant matrix correlation for all sample pairs in both analyses with excluded and included diagonal. The matrix correlation values ranged from 0.55 to 0.72 and from 0.32 to 0.59 with and without diagonal blocks included, respectively (Table S3 Supplementary material). For laboratory colony samples, the matrix correlation with diagonal blocks omitted was from 0.22 to 0.62 and with included diagonal elements from 0.29 to 0.75 being significant for all pairs apart from Slovakia/Venezuela pair (P=0.17) (Table S4 Supplementary material). Overall, the matrix correlations were higher when both variance and covariance were included in pairwise comparisons.
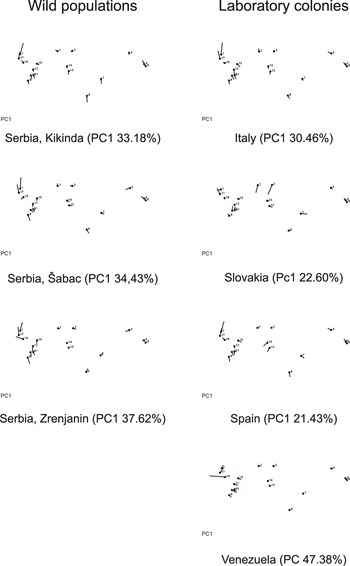
The PCA showed that the most shape variation was concentrated in the first few dimensions in each group (wild population and laboratory colony). For instance, the first three PCs accounted for large amount of variation, 58–64% of total variances in wild populations and 53–67% in laboratory colonies. Displacement of landmarks at the wing base (1, 16, 17) mostly pertaining to the PC1 in samples within both wild population and laboratory colony groups with the exception of Slovakia (fig. 2).
PCA of variation in landmark positions for fluctuating asymmetry in Musca domestica samples. The diagram visualize the PC coefficients of each landmark in x- and y-direction by line originating at the mean location of the landmark (dots). The lengths of the lines correspond to a shape change of 0.1 Procrustes units.

Wild populations versus laboratory colonies
The permutation test performed on Procrustes distances between group's mean shape configurations revealed that although there is a small difference in mean shape configuration between wild populations and laboratory colonies, it is significant (Procrustes distance=0.0024, P=0.039, Mahalanobis distance=1.2, P=0.025). On the other hand, Levene's test of variances indicated that between wild and laboratory samples the difference in the amounts of shape FA was non-significant for neither Procrustes distance (F (1,179)=2.15, P=0.15) nor Mahalanobis distance (F (1,179)=1.41, P=0.24).
Comparing PCA plots for samples of the wild populations and laboratory colonies, concordance between these two groups in the pattern of landmark variation was observed (fig. 2). With the exception of Slovakia sample, in all samples displacement of landmarks was similar in the direction and magnitude. Also, the matrix correlation between covariance matrices of wild and laboratory groups (generated matrices for each group were pooled by samples) was highly and statistically significant for the whole matrices (r=0.87; P<0.0001) and when diagonal blocks were excluded (r=0.82; P<0.0001).
Discussion
Wild populations and laboratory colonies were characterized by individual variation and FA in wing size and shape and DA in wing shape
Studying the variation of wing size and shape in the samples of M. domestica collected in nature and those reared in the laboratory, we found that individuals in both the groups displayed significant amounts of individual variation as well as FA in both wing traits. Wing size and shape displayed contrasting results regarding DA; except for Italy sample, a lack of DA in wing size in all samples was observed, but the significant DA in wing shape was detected in all samples. This absence of DA in wing size contradicts the results from another study of this species where wing size and shape studied by means of geometric morphometrics showed subtle, but statistically significant DA (Klingenberg et al., Reference Klingenberg, McIntyre and Zaklan1998). Similarly, Pélabon & Hansen (Reference Pélabon and Hansen2008) suggested that DA in the wing size is a widespread phenomenon in insects and probably has an adaptive significance. However, opposing data regarding wing size DA have been found within the other Diptera [e.g., Drosophila melanogaster (Klingenberg et al., Reference Klingenberg, McIntyre and Zaklan1998; Pélabon et al., Reference Pélabon, Hansen, Carter and Houle2010) and D. subobscura (Santos et al., Reference Santos, Iriarte and Cespedes2005; Rego et al., Reference Rego, Matos and Santos2006)]. Since it has been argued that DA might be expected to negatively affect the flying ability (Møller & Swaddle, Reference Møller and Swaddle1997; Goulson et al., Reference Goulson, Bristow, Elderfield, Brinklow, Parry-Jones and Chapman1999), there is a need of explicit analyses of influence of DA on flight performance in the future (Breuker et al., Reference Breuker, Debat and Klingenberg2006a ).
Mean shapes of FA differs between groups but not among samples within groups
In this study, substantial amount of shape FA was detected in wild and laboratory samples of M. domestica suggesting that individuals living in both environments experienced disturbance during development. Comparing differences in wing shape asymmetry permutation test revealed significant differences between mean shape configurations of wild populations and laboratory colonies, but non-significant differences in amount of FA between these groups. Similar to our results, comparison of FA in inbred, crossed (outbred) and wild-type lines of yellow dung flies of Scathophaga stercoraria (Hosken et al., Reference Hosken, Blanckenhorn and Ward2000) as well as in inbred and outbread house mice Mus musculus (Leamy et al., Reference Leamy, Meagher, Taylor, Carroll and Potts2001) revealed no significant differences in amount of FA. However, it was shown that genetic stress (inbreeding) had effect on the level of FA whereas the mean values of traits were unchanged in inbred and outbred flies of two genetically distinct populations of Drosophila melanogaster (Carter et al., Reference Carter, Osborne and Houle2009).
In the same way, the amounts of shape FA did not differ noticeably among samples within each group. Furthermore, contrary to significant between-group, differences in mean shape configurations among samples within wild group were not significant and neither were they among Slovakia, Spain or Venezuela colonies. A lack of clear differences in the level of FA among samples herein points out that although being different, captivity could be as stressful as wild environment (Frankham, Reference Frankham2005), and developmental stability of wing traits is disturbed in a similar way and extent under different stresses in both environments. These findings suggested that individuals from both environments were exposed to a variety of intrinsic (genetic) and extrinsic (environmental) stressors, which resulted in similar level of developmental instability. High and uniform level of FA found in wild populations as well as in laboratory colonies could be the result of inbreeding, genetic and demographic stochasticities, genetic bottlenecks and natural selection, making the populations less able to cope with developmental upset. In fact, both artificial and wild populations of M. domestica could be bottlenecked during founder events (captive populations), or experience a strong size decrease of population exposed to insecticide use and environmental fluctuations (overwintering bottlenecks in wild populations) (Krafsur, Reference Krafsur1985; Black & Krafsur, Reference Black and Krafsur1986b ). Likewise, a significant association between a smaller population size (bottlenecked population, founder group) and genetic stress (e.g., decreased genetic diversity, lack of heterozygosity) has arisen from it, and the increased level of FA has been reported for the other organisms (e.g., DiMichele et al., Reference DiMichele, Paynter and Powers1991; Paynter et al., Reference Paynter, DiMichele, Hand and Powers1992; Messier & Mitton, Reference Messier and Mitton1996; Tsubaki, Reference Tsubaki1998; Lovatt & Hoelzel, Reference Lovatt and Hoelzel2011). However, it remains open to detect exact mechanisms that influenced such observation because FA might have resulted from increasing amount of developmental noise and/or from decreasing the level of developmental stability (Klingenberg & Nijhout, Reference Klingenberg and Nijhout1999; Klingenberg, Reference Klingenberg and Polak2003a ).
Associations of size estimates and shape FA variation in wild populations and laboratory colonies is in discordance
In both wild populations and laboratory colonies no size dependence of shape FA was observed, and size had no effect on shape FA (except in Kikinda sample) when size was expressed as mean CS. The correlations among amounts of shape FA and size FA were slightly stronger and significant at the group level of laboratory colonies (P<0.05) compared to the group of wild populations, meaning that the increase in size asymmetry is accompanied by more asymmetric shape in the laboratory colonies. The association among size and shape variations was concordant in both wild and laboratory groups when both univariate estimator of shape variation (correlation of size FA and both Procrustes and Mahalanobis distances) and multivariate approach (regression of shape FA on size FA) were used. In addition, in two colonies (Slovakia and Spain) and one wild population (Kikinda) within-sample correlation of size FA and shape FA was significant and higher than correlation calculated for the respective groups. To evaluate whether correlation of FA size and FA shape is due to direct relationship between size and shape we tested allometry for groups and samples. Although size asymmetry accounted for a small portion of shape variation (less than 2% in each group), allometry was significant among individuals in the laboratory group (P=0.015) but not in the wild group. Accordingly, the allometric effect was small and exhibited minor impact on shape asymmetry. It might be expected that there is flexibility in the developmental program of the wing shape, which is irrespective of changes in size (Trotta et al., Reference Trotta, Cavicchi, Guerra, Andersen, Babbitt, Kristensen, Pedersen, Loeschcke and Pertoldi2011).
Discordance between wild (non-significant correlation) and laboratory (significant correlation) groups regarding associations of size FA and shape FA might have resulted from different influence of evolutionary mechanisms underlying population processes of laboratory-bred samples and wild populations. In this line, the shift in allometry FA might be linked to changes in developmental program, specifically, changes in efficiency of developmental mechanisms of both wing traits to buffer environmental and genetic stress. For instance, Klingenberg (Reference Klingenberg and Polak2003b ) highlighted correlation analysis of signed FA as a tool for studying interaction between developmental processes underlying morphological structures. The observed correlation between wing size FA and shape FA in inbred samples in our study indicates that mechanisms that control developmental stability of these traits with different genetic properties (Bitner-Mathé & Klaczko, Reference Bitner-Mathé and Klaczko1999; Carreira et al., Reference Carreira, Soto, Mensch and Fanara2011) are linked under stressful environments. Indeed, Breuker et al. (Reference Breuker, Patterson and Klingenberg2006b ) reported association between the amounts of shape FA and of size FA in isogenic lines suggesting the presence of developmental link between size and shape. Similarly, increase in inter-inbred lines phenotypic variation relative to outbred populations was observed in Drosophila (also see Whitlock & Fowler, Reference Whitlock and Fowler1996; Wright et al., Reference Wright, Tregenza and Hosken2008; Trotta et al., Reference Trotta, Cavicchi, Guerra, Andersen, Babbitt, Kristensen, Pedersen, Loeschcke and Pertoldi2011) and housefly (Milankov V., Ludoški J., Francuski Lj., Pastor B., Martínez-Sánchez A., Ståhls G. and Rojo S., unpublished data). Such shift in phenotypic variation was also found to be in concordance with pattern of wing size variation in housefly; bigger wings and lower variation was estimated in both sexes from outbred samples, but smaller wings and greater variation characterized laboratory samples.
General pattern of FA across samples of wild populations and laboratory colonies is in concordance
Patterns of shape FA variation, measured by the matrix correlation, revealed that patterns were significant and more correlated when both variance and covariance of FA were analyzed. It suggests that variance of shape FA (the amount of shape FA) may be more constrained compared to joint displacements of landmarks (covariation) across the samples. Such patterns are in line with the results obtained from the variance comparisons using Levene's test in this study. Analysis of variation and covariation among landmarks revealed quite uniform patterns of landmark displacements in wild populations as well as in laboratory colonies (with the exception of Slovakia). In both group samples, the strong dominance of a single PC was observed noting that PC1 takes up at least about one-third of the total variation in wild populations (35–40%) or slightly lower in laboratory colonies (21–47%), far more than any other PCs, meaning that most of the shape variation in each data set is highly concentrated in a single dimension of the shape space. The shape changes associated with the PC1 across all samples in both groups were primarily linked to large variability of a few landmarks located in the wing base (1, 16, 17) for FA. Our findings suggest that different wing compartments varied differentially, indicating wing base as the less constrained wing part, which means more plastic response comparing with other parts of the wing. Consequently, disturbance during the development apparently does not have influence on different parts of wing at the same level.
The observed concordance in patterns of left–right displacements of homologous landmarks among/within groups that developed in contrasting environments (nature/laboratory) and, hence, faced different causes disturbing developmental stability, reflects a similar response of the developmental processes to perturbations during development and likely conservation of developmental basis of asymmetry (Klingenberg et al., Reference Klingenberg, McIntyre and Zaklan1998; Debat et al., Reference Debat, Alibert, David, Paradis and Auffray2000). Comparing the pattern of shape FA variation within and between the wild populations (genetic heterozygous) and laboratory colonies (genetic homozygous) we found consistent pattern of plastic response of different wing compartments. This consistence might be explained by integrative and modular conceptions which imply that all wing regions are expected to be integrated (e.g., in Drosophila: Klingenberg & Zaklan, Reference Klingenberg and Zaklan2000). However, the question linking to developmental integration of the wing is beyond this study.
Summary
Studying the amounts and patterns of FA of wing shape we found two main findings. Firstly, levels of FA, as a measure of developmental instability, neither differ among samples within the group nor between the groups (laboratory and wild). However, contrary to significant between-group difference, mean shape configurations among samples within wild group were not significantly different and neither were they among Slovakia, Spain or Venezuela colonies, suggesting that the laboratory colonies and wild samples differ in buffering mechanisms to perturbations during development. Hence, inbreeding and stochastic processes, the mechanisms dominating in laboratory-bred samples contributed to significant changes in FA of wing shape. Secondly, developmental perturbations probably cause such different mean shape constellation, which does not change the general patterns of left–right displacements of landmarks across both studied sample groups implying that individual landmarks influenced the mean shape differences. Observed consistent direction of shape FA implies high degrees of wing integration. Thus, our findings shed light on the developmental buffering processes important for population persistence in the environmental change and genetic stress influence on M. domestica. Owing to epidemiological role, a better understanding of evolutionary processes underlying population dynamics of M. domestica is of great importance.
Supplementary Material
The supplementary materials for this article can be found at http://www.journals.cambridge.org/ber
Acknowledgements
Authors would like to thank Dr. Ljubinka Francuski and Danijela Marković for providing material from Kikinda and Šabac, respectively, and their assistance in the laboratory. The authors thank to the three anonymous reviewers for constructive comments on an earlier version of this manuscript. This work was supported in part by the Ministry of Science of Serbia (Dynamics of gene pool, genetic and phenotypic variability of populations, determined by the environmental changes, no. 173012), and the Provincial Secretariat for Science and Technological Development (Molecular and phenotypic diversity of taxa of economical and epidemiological importance, and endangered and endemic species in Europe). This study was partially funded by project LIFE-ECODIPTERA (LIFE05-ENV/E/000302).