Nomenclature
- CCGT
combined cycle gas turbine
- HP
high pressure
- HRSG
heat recovery steam generator
- LP
low pressure
- OPR
overall pressure ratio
- PRESS RMSE
predicted sum of square RMSE
- REC
recuperator
- RMSE
root mean square error
- RSM
response surface method
- SBC
steam bottoming cycle
- TIT
turbine inlet temperature, K
- TERA
techno-economical environmental risk analysis
- MLE
maximum-likelihood estimation
Symbols
- ∆T HRSG
HRSG pinch temperature difference, K
- ε
heat exchanger effectiveness
- η
efficiency
- −log L
log-likelihood
- X
parameter calculated in the probability analysis
- σ
standard deviation
1.0 INTRODUCTION
In evaluating the thermal performance of advanced power cycles, a key aspect is the cycle’s thermal efficiency across a defined design space. This enables the assessment of the influence of the key design parameters. Very frequently, the complexity of the power plant and the number of thermodynamic design variables make it computationally challenging to simulate a sufficient number of cycles for an acceptable representation of its efficiency across the prescribed design space. In that context, response surface approaches can be used to approximate the cycle’s performance metrics and the correlate key design parameters with the efficiency of the power system. Such an approach would allow the integration of cycle’s performance within a wider analysis deck that enables a number of preliminary design and analysis studies as for example integrated power plant performance, lifecycle economic analysis, noise or emissions such as the ones discussed previously in TERA analysis in the marine sector( Reference Koutsothanasis 1 , Reference Koutsothanasis, Kalfas and Doulgeris 2 ) or in aerospace( Reference Hempert 3 – Reference Celis 5 ) or in power generation( Reference Di Lorenzo 6 ).
Surrogate models have been used successfully in various fields where computational simulations or experimentations are time expensive or of difficult realisation, for instance and among others: in reservoir engineering for predicting the flow of fluids (typically, oil, water, and gas) through porous media( Reference Mohaghegh 7 ), in bio-engineering for the optimisation of the relative ratio of three factors influencing cardiomyocyte cell differentiation( Reference Bai, Lim, Jia, Santostefano, Simmons, Kasahara, Wu, Terada and Jin 8 ) and in aerospace field to predict the noise levels generated by contra rotating open rotor propellers( Reference Kritikos, Giordano, Kalfas and Tantot 4 ).
This article focuses on the development and application of a response surface method (RSM) to approximate the efficiency of gas-steam combined cycle power plant at design point across a range of design parameters. A large number of cycle performance simulations are used as the underlying dataset for the generation of the response surface. A range of statistical and mathematical techniques are herein analysed with regard to their capability to create a response surface models, for the thermal efficiency and the free design variables, that links the cycle’s performance with the variation of free design parameters across a design space for a combined-cycle gas turbines (CCGT).
2.0 GENERATION OF TRAINING DATA SET
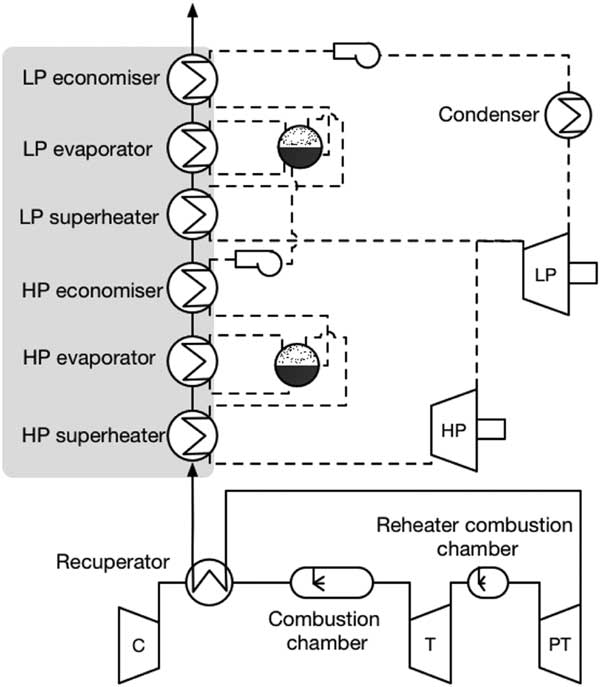
A RSM is applied to describe the preliminary design space of a combined cycle gas turbine (CCGT) with a power output of 40 MW. The cycle layout considered in this work is shown in Fig. 1. The topping cycle comprises a dual-shaft, reheated and recuperated gas-turbine coupled with a power turbine. The bottoming cycle is a vacuumed dual-pressure steam Rankine cycle (SBC). The hot exhaust gas from the recuperator enters the heat recovery steam generator (HRSG), while a sequence of six heat exchangers recover the waste heat to generate steam for the two steam turbines.
CCGT layout.

The design point thermodynamic performance of the topping cycle is resolved by means of Turbomatch( Reference Macmillan 9 , Reference Li, Pilidis and Newby 10 ) an in-house 0D gas-turbine performance software developed at Cranfield University, with external modules for the heat exchangers and blade cooling calculations. The bottoming cycle is simulated by means of SteamoMatch, another in-house 0D performance software developed at Cranfield University for steam Rankine cycle modelling and simulation( Reference Mucino, Li, Ojile and Newby 11 ).
Some general assumptions are made throughout all the simulations performed:
∙ All components are adiabatic.
∙ No mechanical losses are accounted for.
∙ Air is used for the cooling of the turbine blade rows.
∙ Diesel chemical proprieties are used in combustion calculations as discussed in Ref Reference Goodger and Ogaji12.
∙ Cycle performance is simulated at ISA ambient conditions with relative humidity of 80% (humidity in coastal areas).
∙ Cooling water temperature of 288.15 K.
A 90% polytropic efficiency is assumed for the compressors and the core turbines whereas 92% for the power turbine, to reflect the current technology levels of the components. The turbine inlet temperature (TIT) downstream of the combustion chamber is 1600 K.
The turbine cooling flows are calculated using the methodology proposed by Young and Wilcock( Reference Young and Wilcock 13 ). Typical values for maximum metal temperature (T max=1300 K), film cooling effectiveness (ε=40%) and internal flow cooling efficiency (η c =70%) are fixed in agreement with Horlock( Reference Horlock, Watson and Jones 14 ). The cooling flows for all turbines, if necessary, are extracted downstream of the recuperator and upstream of the combustion chamber.
A 90% polytropic efficiency is assumed for the steam power turbines whereas an isentropic efficiency of both circulation and service pumps is set at 80% in agreement with current technology limits. The steam quality at the outlet of the turbines is limited to be higher than 85%, to avoid erosions in the last stages of the turbine due to high number of condensate droplets( Reference Kehlhofer, Hannemann, Rukes and Stirnimann 15 ).
In the recuperator, the inlet properties of both streams are defined; therefore, the outlet conditions of the two streams are calculated by defining the effectiveness of the heat exchanger (ε=Q/Q max). The pressure levels of the HRSG – i.e. high and low-pressure levels – are resolved by imposing the pinch temperature difference between the steam-water and the gas at the outlet of the superheater and at the inlet of the evaporator. The approach temperature difference to the evaporator is 2 K to reflect the current technology level in HRSG. The minimum super-heater pinch temperature difference is limited to 20 K whereas the maximum steam temperature is limited to 850 K, a common creep limit for Ni–Cr steels for times of order of 30–40 years( Reference Ganapathy 16 ).
The required steam-water mass flow for the bottoming cycle is calculated by imposing the two pinch temperature differences and resolving the HRSG energy balance system of equations. In the condenser, the inlet and outlet conditions and mass flow of the condensing steam are known and temperature difference between the coolant at the inlet and outlet is imposed to be 5 K. The required coolant mass flow is, therefore, calculated solving the energy balance in the condenser. The total pressure losses of the heat exchanger are assumed to be 5% in both sides of all heat exchangers. In the evaporators, the pressure losses are compensated by the circulation pumps and the power consumption of the latter is accounted for in the cycle thermal efficiency calculations.
The exploration of the cycle design space aims to evaluate the impact of the technology challenges across the main cycle components on the system’s performance. One of the main concerns about the CCGT cycle is the impact of the total heat transfer area, required to achieve high thermal efficiency. The design space exploration is, therefore, focused on identifying the impact of the technology level of the cycle key heat exchangers – i.e. recuperator and HRSG – on its overall thermal efficiency.
The most representative thermodynamic design variable for the technology level of the recuperator is its effectiveness. The higher the heat exchanger effectiveness, the smaller is the minimum achieved temperature difference between the hot and cold streams at the exit which yields to a continuously decreasing heat flux between the two streams as a function of the heat exchanger’s effective length. This reflects in bulkier heat exchangers or/and the need to deploy more expensive materials to increase the heat transfer coefficient within the heat exchangers.
The design parameter that mostly affects the size and the weight but also the performance of the HRSG is the evaporator pinch temperature difference (∆T HRSG). The amount of heat recovered from the exhaust gas strongly depends on the latter, but while the steam generated by the HRSG has a linear dependency with the evaporator pinch point, the heat transfer area of the HRSG varies exponentially further pronouncing the increase in size for low ∆T HRSG. One of the cycle parameters that mostly affects the size and weight of the condenser is the condensing pressure in the Rankine cycle due to the effect it has on the amount of heat that needs to be rejected to liquefy the steam.
The above-mentioned design variables, representative of the analysed components technology level, are varied parametrically as shown in Table 1 to create a multi-dimensional mesh of the design space for the training of the response surface.
Ranges for the free design variables of the CCGT design space

The single objective genetic algorithm in MATLAB, based on Deb( Reference Deb 17 ), is used for the optimisation of the remaining design variables (Table 2), within the prescribed design envelopes, for maximum thermal efficiency of the combined cycle, which is defined as follows:
 $${\rm \reta }_{{{\rm CCGT}}} {\equals}{\rm \reta }_{{{\rm GT}}} {\plus}\left( {1{\minus}{\rm \reta }_{{{\rm GT}}} } \right){\rm \reta }_{{{\rm HRSG}}} {\rm \reta }_{{{\rm SBC}}} {\rm }$$
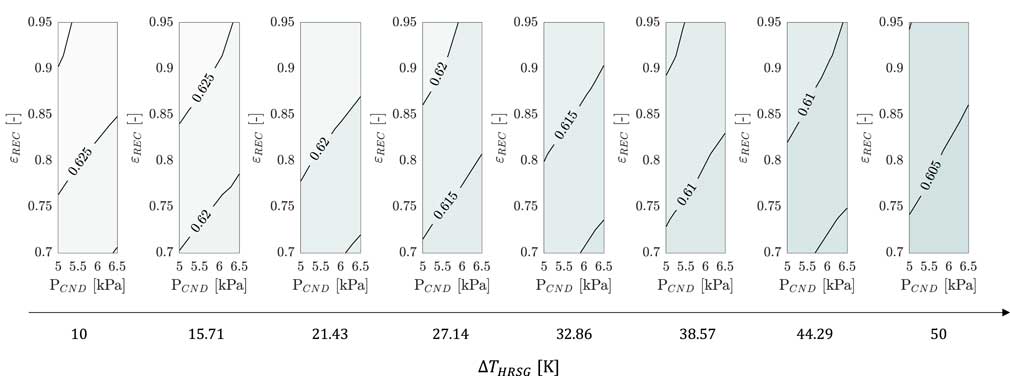
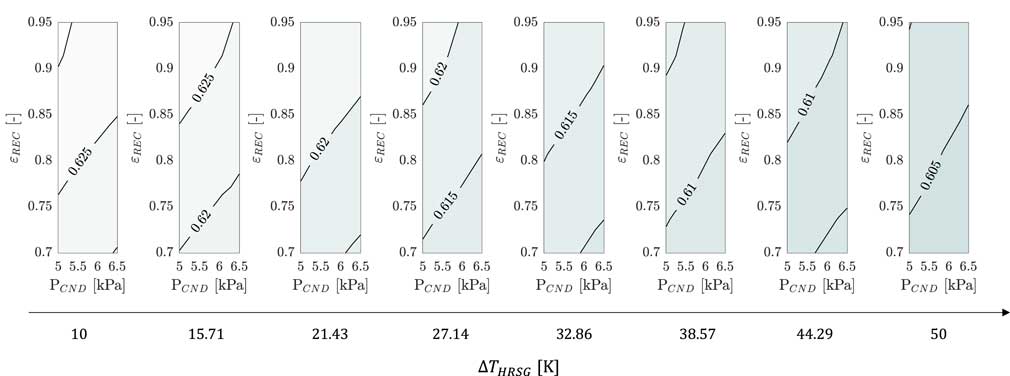
Figure 2 shows the thermal efficiency obtained from the optimisation of the CCGT at design point across the design space, as a function of the identified technology indicators of the recuperator, HRSG and condenser. These are the recuperator effectiveness (εREC), the pinch temperature difference at the HRSG (∆T HRSG) and the condenser pressure (P CND). In this example, a total number of 512 cycle simulations were required for the calculation of the cycle’s performance data across the design envelope (Fig. 2) each one of which included the optimisation in terms of the parameters shown in Table 2. A run-time of approximately 45 min was required to completed the optimisation of a single cycle which resulted in a total run-time of roughly 7 seven days to complete the development of the training dataset (Fig. 2). The aim of the response surface is to best surrogate the design space shown in Fig. 2 without the need of developing a thermal model of the power system hence providing a much faster approach to assess cycle performance with very small penalties in accuracy.
(Colour online) Thermal efficiency across the design envelope of the CCGT system in function of condenser pressure (P CND), recuperator effectiveness (εREC) and pinch temperature difference at the HRSG (∆T HRSG).
Range of the optimised design variables for the CCGT

3.0 CCGT SURROGATE MODEL GENERATION
3.1 Conditioning of CCGT dataset
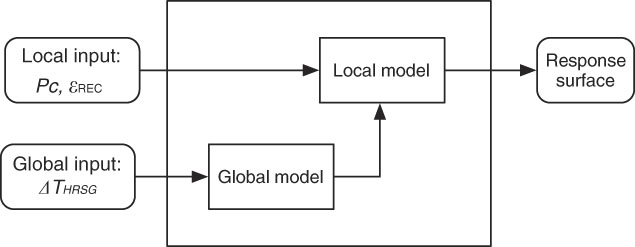
A two-stage approach is used to build the surrogate model for the response of the CCGT cycle thermal efficiency, steam HP pressure and OPR. This approach reduces the number of parameters in the local model increasing the prediction capability( Reference Holliday, Lawrance and Davis 18 ) – i.e. higher the number of parameters, lower is the prediction capability. The HRSG pinch temperature difference is chosen as global input whereas the remaining condenser pressure and recuperator effectiveness are local inputs to the model as shown in Fig. 3.
Two-stage block diagram for the CCGT cycle surrogate model.

In the local model, both quadratic function and hybrid spline function can be used. Holliday et al.( Reference Holliday, Lawrance and Davis 18 ) recommend to use spline model rather than quadratic function due to the significant bias the hybrid spline function exhibit. A spline model or segmented polynomial is desirable to represent the curvature of the complex model, nevertheless in this paper the selection of the model is based on the root mean square error (RMSE) and predicted root mean square error (PRESS RMSE).
Both quadratic and hybrid spline functions are assessed for the best fitting of the local data set by varying, respectively, 6 and 13 coefficients for each global input value. These coefficients are response features of the local models and used for the training of the global model.
Several global models are assessed for each coefficients of local models. These coefficients are considered as response features of the local models. There are five different classes of global models. Kernels from these classes may attain best fit to the data sets. These five classes are:
1. Linear models
2. Radial basis functions (RBF)
3. Hybrid RBF
4. Gaussian process functions
5. Free knot splines
These classes of global models are studied for the best fitting of the response features of the local models, for a total of 140 analysed kernel global models. The assessment of the global model kernels, for both local models, is based on the minimum RMSE achieved between the actual coefficient values and the response coefficient values of the local model. Nevertheless, kernels that achieve large discrepancy between the RMSE and PRESS RMSE are discarded, to avoid over-fitting.
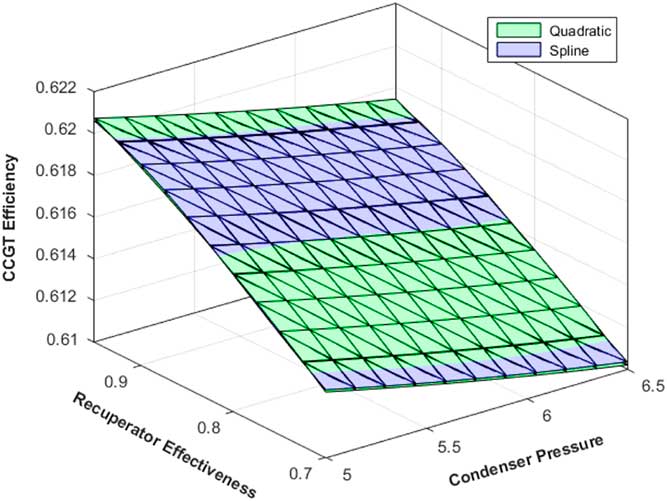
From the comparison between the quadratic and the hybrid spline fitting functions, it can be seen that they are in good agreement with each other (Fig. 4). In addition, no notable noise levels appear in neither approximation approach hence the selection of the local model is based on the model with the lowest RMSE and on the smallest difference between PRESS RMSE and RMSE between the data set values and the response values.
(Colour online) Comparison of the response surface for the quadratic and hybrid spline based two-stage model. −∆T HRSG=30.

The summary of the statistics of the two-stage model for all three responses is reported in Table 3, where –log L is the log-likelihood of the output parameters of the RSM. These statistics represent the accuracy of the surrogate model to reproduce the information it was trained with and has been evaluated separately for the three output parameters of the response surface namely the overall pressure ratio (OPR), the thermal efficiency of the combined cycle (ηCCGT) and the high pressure steam level as a function of the three independent parameters used to define the design of each cycle. The local model for the CCGT thermal efficiency and OPR responses that achieves the lowest RMSE is the Hybrid spline whereas for the steam HP pressure, the best fitting local model was found to be the quadratic function (Table 3). Both local and global RMSE are within the acceptable values for the exploration of the cycle design space as the discrepancies between the actual data and the RSM predictions lie well within the measurement accuracy for each one parameters. Also, the RMSE values for the three responses do not vary significantly between the local model and the global model, which indicates a good choice of the local and global variables. A range of different local models were identified as the best fits for the thermal efficiency, overall pressure ratio and the steam high pressure, due to lower local and global RMSE.
Statistics summary of the two-stage CCGT surrogate models −∆T HRSG global input −512 data sets

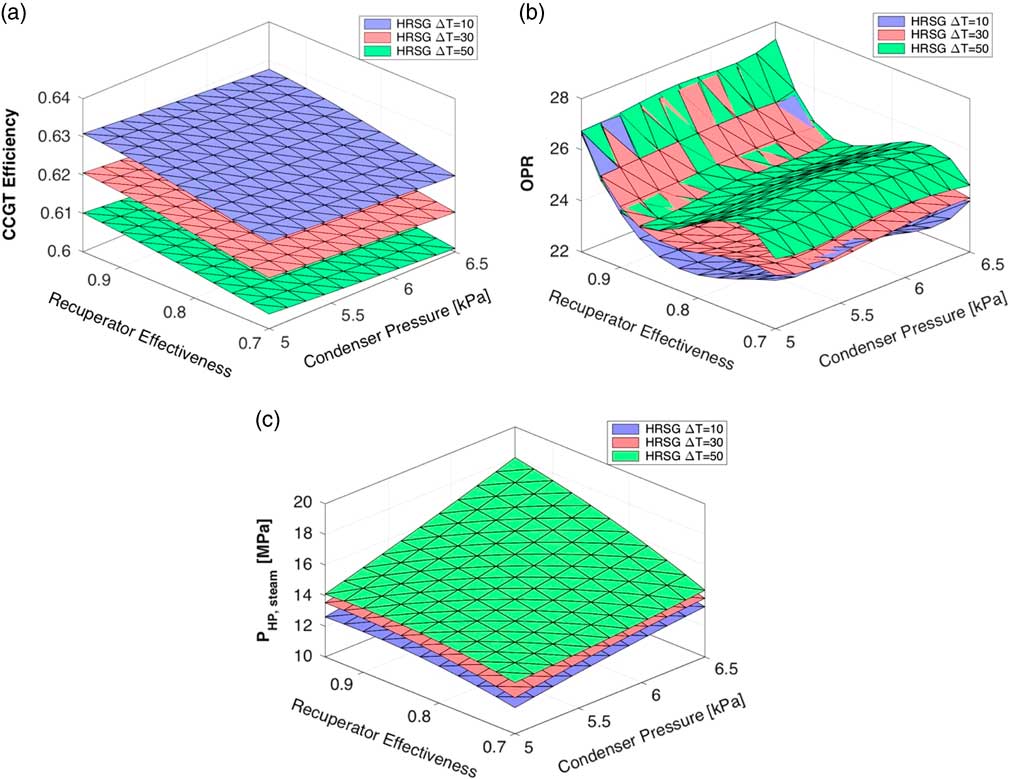
The response surfaces for the cycle thermal efficiency and the two free design variables, OPR and steam HP pressure, are illustrated in Fig. 5 for three values of the HRSG pinch temperature difference. Figure 5(a) represents the maximum thermal efficiency that the cycle can achieve for the given technology levels of the HRSG, recuperator and condenser and it, therefore, enables the assessments of the impact of each component on the thermal efficiency of the system. For example, from Fig. 5(a) becomes clear that the pinch temperature point of the heat recovery steam generator has a strong impact on the thermal efficiency of the combined cycle as a 20K change from 10K to 30K is found to cause broadly a 2pp penalty in the thermal efficiency across the design envelope.
(Colour online) Response surface for three values of HRSG ΔT: (a) cycle thermal efficiency, (b) OPR and (c) steam high pressure.

Figure 5(b) and (c) show the impact of the technology level of the HRSG, recuperator and condenser on the design variables that are optimised to maximise the thermal efficiency namely the overall pressure ratio and the steam HP pressure. It can be noticed that although the ∆T HRSG mostly affects the thermal efficiency, it only has a weak impact on the high-pressure level in the steam bottoming cycle, while it affects the OPR of the gas turbine only for low values of effectiveness of the recuperator. In addition, the high pressure level of the steam cycle is mostly affected by the condenser pressure, with an increase of 2 MPa when the condenser pressure in increased from 5 to 6.5 kPa. The OPR of the gas turbine instead is mostly affected by the recuperator effectiveness, with an abrupt increase at high effectiveness (>0.9), whereas the condenser pressure has almost no impact on the optimised OPR of the system. The abrupt increase in OPR, when the recuperator effectiveness increases from 0.8 to 0.95, is attributed to the temperature variation of the gas at the recuperator exit. As the increase in the recuperator effectiveness leads to a reduction of the gas temperature at this position, the increase in OPR compensates this effect and the temperature of the gas at the inlet of the recuperator shows an increasing trend as a consequence.
3.2 Response surface refinement
An alternative way to further enhance a generated response surface is via the maximum-likelihood estimation (MLE) method. MLE is used to take into account possible correlations between the responses (ηCCGT, OPR and Steam HP pressure) and, therefore, to increase the accuracy of the surrogate model. If a generic model with the following generic structure f(X,w) is considered, where w is the set of parameters that define the shape of the model and X is the output of the response surface, MLE is a method that improves the estimation of the identified parameters w to best fit the data:
The probability
 $$\left\{ {\left( {X^{{(i)}} ,\reta ^{{(1)}} \,\pm\,{\rvarepsilon}} \right),\left( {X^{{(2)}} ,\reta ^{{(2)}} \,\pm\,{\rvarepsilon}} \right),\,\ldots\,,\left( {X^{{(n)}} ,\reta ^{{(n)}} \,\pm\,{\rvarepsilon}} \right)} \right\} $$
of each the parameters X, calculated with the model, falling within a small error ε of the dataset values η can be calculated from Equation (1) where ε follows a normal distribution with a standard deviation of σ(
Reference Forrester, Sobester and Keane
19
):
 $${\rm Probability},p{\equals}{1 \over {\left( {2{\rm \rpi \rsigma }^{2} } \right)^{{{n \over 2}}} }}\mathop \prod\limits_1^n \left\{ {\exp \left[ {{\minus}{1 \over 2}\left( {{{{\rm \reta }^{{(i)}} {\minus}f\left( {X,w} \right)} \over \rsigma }} \right)^{2} } \right]{\rm {\rvarepsilon}}} \right\}$$
This probability (Equation (1)) is defined as the likelihood of the parameters given the data ( Reference Forrester, Sobester and Keane 19 ). In order to maximise the probability, the negative natural logarithm in Equation (2) must be minimised and the selection of w is updated:
 $$\mathop{{\min }}\limits_{w} \mathop \sum\limits_{i{\equals}1}^n \left[ {{{{\rm \reta }^{{(i)}} {\minus}f\left( {X,w} \right)} \over {2{\rm \rsigma }^{2} }}} \right]{\minus}n\ln {\rm {\rvarepsilon}}$$
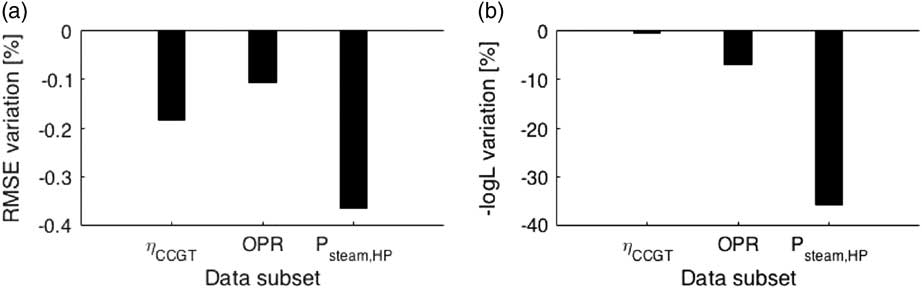
By applying the MLE correction on the surrogate model, the predictive capability of the surrogate for all three responses slightly improves against the baseline model. The model improvements due to the MLE method for all three responses of the CCGT cycle are reported in Fig. 6 relative to the baseline accuracy statistics shown in Table 3.
Variation between the uni-variate model and MLE model for the responses of the CCGT cycle, (a) RMSE and (b) –log L.

Although only minor improvements are achieved for the RMSE of the three responses, MLE method improves the overall method by decreasing –log L test up to 36% for the steam HP pressure response.
3.3 Validation of the CCGT surrogate model
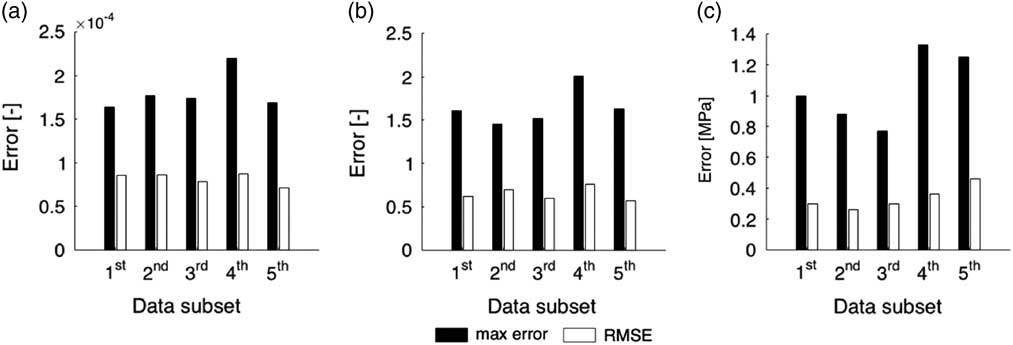
The surrogate models generated previously were validated within the bounds of the training data using a so-called subset apparent validation approach. The error between the surrogate model response for the training data and the actual training data is assessed and the training data is divided in five subsets to ensure homogeneity of the errors across the response surface. Figure 7 illustrates the maximum error (
 $Err{\equals}\left| {{\rm \reta }{\minus}{{\hat{\reta }}} \right|$
) and the RMSE between the response value
 ${{\hat{\reta }}}$
and the actual thermodynamic simulation result η for each subset of data. As shown in Fig. 7, the maximum observed error and the RMSE do not vary substantially across the data subsets highlighting the robustness of the model. As a result, the performance of the three RMSE are consistent across the design space. The errors for the thermal efficiency are well within the accuracy margin of the thermodynamic model used to produce these data points.
Maximum error and RMSE per data subset: (a) CCGT thermal efficiency, (b) OPR and (c) steam HP pressure.

The generated surrogate models were also validated with a split sample validation, where the response surfaces were used to produce 27 new predictions at certain positions within the design space where no data points existed previously. The sampling of the values of the recuperator effectiveness, of the pinch temperature in the HRSG and of the pressure in the condenser of the steam cycle was generated using the Latin Hypercube Sampling method( Reference Kritikos, Giordano, Kalfas and Tantot 4 ) whereas the thermal efficiency of the system, high pressure in the steam cycle and OPR are a result of the optimisation process. The same 27 sample points were subsequently modelled on the TurboMatch – StemoMatch simulation deck to generate a simulated cycle thermal efficiency, OPR and steam HP pressure level. The RMSE and the maximum difference between the new samples values and the values obtained with the response surfaces are reported in Table 4.
Statistics summary of split sample validation between simulated and approximated via the surrogate design points. −∆T HRSG global input −27 data sets

The discrepancy between the model prediction and the sample data from the split sample validation is within acceptable values for the description of a design space of a complex system as a combined cycle. This adds credibility in the use of surrogate models for design space exploration of the complex gas-turbine systems.
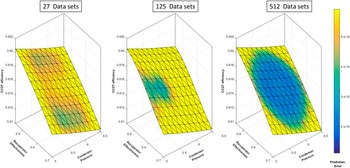
Figure 8 shows the prediction error of the combined cycle thermal efficiency across a range of population sizes used as training datasets. As shown, the applied surrogate model approach captures the behaviour of the cycle’s efficiency with the maximum discrepancy between the simulated and the approximated data points no higher than 6e−10 for the smallest training sample of 27 simulation points. The accuracy increases with sample size and although there is some residual increased discrepancy around the boundaries of the design space for the 512 sample size case, the surrogate model is generally approximating fairly well the entire design space examined. The notably good performance of the response surface application is generally attributed to the smoothness of the design space which presents very limited challenges to the both the local and global approximation models used.
(Colour online) Impact of the population of the dataset on the prediction error of the surface.

4.0 CONCLUSIONS
The methodology developed in the current paper shows the application of a response surface approach to capture the performance of a complex power system across a defined design space. The method evaluates the selection of the best fitting local and global model, allowing a range of local models for each response (efficiency, overall pressure ratio, temperature pinch difference in the HRSG and HP steam pressure) to achieve the minimum RMSE for each one of them. The analysis showed that the overall thermal efficiency and overall pressure ratio are best described by a hybrid spline local model while a quadratic local model showed the best fit to capture the variations in the high pressure steam level. After the refinement of the response surface, an improvement in the –log L test by 35% for the pressure of the HP steam pressure was achieved. Finally, a subset apparent validation as well as a split sample validation of the generated response surfaces showed that the employed models could successfully capture the design space variations both within and beyond the initially defined design space with the total number of training datasets slightly affecting the accuracy of the model.
This paper demonstrates the feasibility of using response surface approaches for describing the performance of advance cycles with multiple design variables. This helps in drastically reducing the modelling time and number of thermodynamic simulations required as part of the preliminary evaluation of a design space and consequently produce notable economies in computational time and resources during preliminary design phases. The response surface could be further used where several advance power cycles need to be evaluated as alternatives to a new system, coupled with cost, size and weight analyses tools, for example, to determine the impact of the technology level of the components on key design metrics of the power plant. A response surface would in that case successfully replace the thermodynamic model of the cycle within the general application model. This can then be used for system optimisation where the goal could be maximum thermal efficiency or minimum levelised cost of the electricity.