


1. Introduction
Vision and tactile are the two most widely used perception modalities during robot interaction [Reference Zhang, Chen, Gao and Wan1]. In real life, humans see the global information of things through eyes and touch the local features of objects through skin. The pairing of two organs can help humans to perceive the external environment. In the field of robotics, researchers have used electronic tactile sensors to simulate human tactile mechanisms, such as resistive sensors [Reference Liao, Xiong, Liu, Li and Song2], capacitive sensors [Reference Wang, Qiu, Yang, Wu, Shi, Chen, Lu, Xiang and Ju3], inductive sensors [Reference Li, Yin, Zhang, Xing, Peng, Meng, Yang and Peng4], and fiber sensors [Reference Presti, Massaroni, D’Abbraccio and Massari5]. However, traditional tactile sensors tend to be localized and sparse for the perception of object features due to hardware limitations. Therefore, adding a vision unit to the tactile system has become a hot way in the tactile research.
Advances in image recognition and deep learning techniques have allowed machine vision to help visualize tactile information. The quality of tactile features can be improved by vision. For example, marking vectors in tactile images to represent the magnitude and direction of force [Reference Li, Alomainy, Vitanov, Noh, Qi and Althoefer6], and embedding vision sensors inside the fingers of robots for sensing the bending state of the fingers [Reference Zhang, Shan, Fang and Sun7]. The combination of vision and tactile sensation has greatly contributed to the development of tactile sensors. Currently, the representative sensor is GelSight [Reference Yuan, Dong and Adelson8]. This sensor has been developed with various functions. Reference [Reference Yuan, Li, Srinivasan and Adelson9] perceives the normal, shear, and torsional forces on the contact surface by analyzing the image sequence of GelSight for slip detection. In ref. [Reference Yuan, Zhu, Owens, Srinivasan and Adelson10], W. Yuan et al. used GelSight for different object hardness detection based on deep learning. In ref. [Reference Wang, She, Romero and Adelson11], GelSight Wedge sensor was proposed for high-resolution 3D reconstruction of tactile images. Based on a series of studies, a new optical sensor GelTip [Reference Gomes, Lin and Luo12] was proposed. This sensor is shaped as a finger and has a full range of tactile sensing capabilities. And it can capture high-resolution tactile images. Similarly, GelSlim [Reference Donlon, Dong, Liu, Li, Adelson and Rodriguez13] implemented a more compact tactile system than GelSight. E. Donlon et al. redesigned the optical path from light source to camera, combining light guide and mirror to reduce the thickness of the finger. In ref. [Reference Taylor, Dong and Rodriguez14], GelSlim3.0 can measure the shape of contact objects, estimate 3D contact force distribution, and detect slip. Although existing tactile sensors can achieve many powerful functions, there is a problem in the object perception process: weak pairing between multimodal information.
In ref. [Reference Luo, Yuan, Adelson, Cohn and Fuentes15], authors proposed a classification method for the fusion of visual and tactile senses and validated it on the recognition of cloth textures. The dataset is obtained from tactile images acquired by GelSight and camera images captured by an external camera. There is a problem here: GelSight extracts the local features of clothes. The camera extracts the global features of clothes. And the extraction process of both is separated. This leads to a spatial and temporal mismatch between the tactile images and the camera images. Similarly, reference [Reference Wei, Zhao, Shan and Yuan16] validated a visual and tactile fusion approach for object classification on three datasets: GelFabric, LMT, and Vitac. All three datasets contain external image information and local tactile information of different objects. The same weak pairing exists between these two modal information. Inspired by this problem, we hope to make a sensor that can solve the problem of weak pairing between visual and tactile information.
Laboratory scene of the sensor. FVSight is fixed to the end of the UR3 robot arm. On the table are the experimental objects.

To achieve this goal, we replaced GelSight’s gel layer with a flexible force-tactile sensing array. Two heterogeneous tactile modal information can be collected in the same spatial region and in the same time span when the sensor presses an object. The sensor was firstly proposed in ref. [Reference Xiong and Yin17], named FVSight. In this paper, we calibrate the parameters of FVSight, enrich the object recognition experiments, and explore the slip detection function. The laboratory scenario of sensor is shown in Fig. 1. The contributions of this paper are as follows:
-
Integrated spatiotemporal synchronization: Traditional tactile sensors often collect tactile information by contacting the local surface of an object, resulting in a weak spatial pairing with globally acquired visual information. To address this issue, FVSight ensures a congruence between the visual contact area and the tactile contact area when pressing the measured object. This approach establishes spatial coherence, aligning the perception areas of tactile images and force-tactile arrays. Furthermore, conventional tactile sensors typically acquire tactile and visual information independently, leading to temporal discrepancies in the data collection process. To overcome this limitation, FVSight simultaneously captures tactile image information and force-tactile array data upon pressing the object, achieving temporal synchronization of both visual and tactile modal information of the object.
-
Sensory layer innovation: Traditional tactile sensors such as GelSight, GelTip, GelSlim, etc. can only collect one type of tactile modality information through the sensory layer. FVSight is able to collect two types of heterogeneous tactile modality information simultaneously with force-tactile arrays in the sensory layer. This ensures that the tactile image and force-tactile array information are paired spatially and temporally.
-
Experimental validation: Through the fusion of vision and tactile, the multimodal tactile sensor has demonstrated enhanced efficacy in object classification experiments, effectively addressing the challenge of weak pairing between the two modalities. Moreover, the sensor has exhibited exceptional performance in slip detection experiments, thereby expanding its potential applications in human-computer interaction scenarios.
The rest of this paper is organized as follows. In Section 2, we present the work related to the content of the paper. Section 3 presents the calibration experiments and parameters of the sensor. In Section 4, we present the object classification experiment. In Section 5, we present the slip detection experiment. Finally, the conclusions are given in Section 6.
2. Related work
2.1. Fusion of vision and tactile sensing
For robots, vision-based tactile sensors are more effective than sensors that rely on vision or tactile sensations alone [Reference Yamaguchi and Atkeson18]. Traditional array piezoresistive sensor technology is well established. In ref. [Reference Wang, Wu, Mei, Zhu and Chen19], a flexible tactile sensor array with a spatial resolution of 3.5 mm was proposed. This sensor can detect the three-axis contact force when grasping different objects. However, the hysteresis of resistive sensor and the number of contacts limit the sensing range and accuracy. On top of this, the addition of vision enables the analysis of higher-resolution 3D force distribution from tactile images [Reference Sferrazza and D’Andrea20]. Vision-based tactile sensors that provide accurate tactile feedback are also used on robotic arms. The robot hand uses a camera to acquire global images of objects during approach and a tactile unit to acquire local tactile features during contact with objects [Reference Chaudhury, Man, Yuan and Atkeson21]. The combination of vision and tactile sensation visualizes the approach-contact process of object perception.
The sensory layer technology is the most complex when it comes to sensor fabrication. Elastomeric materials and reflective layer materials rely on specialized equipment and are expensive. In this paper, a soft and low-cost canvas is used as the surface of sensory layer. The canvas is laminated to the tactile array to form a kind of flexible electronic skin. This is similar to the integration of 10 stretchable resistors inside the e-skin sensor mentioned in ref. [Reference Zhong, Zhao, Liu, Li, Kan and Feng22]. This electronic skin can output an array of forces and also capture the deformation produced by objects. Based on vision we can capture a tactile image of this deformation.
2.2. Object recognition
Visual-tactile fusion has excellent performance in object recognition. sun et al. developed a learning framework based on visual-tactile fusion [Reference Sun, Liu, Huang and Zhang23]. This framework utilizes a visual feature histogram and two different tactile models for object recognition tasks. In ref. [Reference Yuan, Wang, Dong and Adelson24], a multi-input network jointly trained visual and tactile features and demonstrated that object recognition with the combination of two modal information is far more effective than relying on only one modal information. In ref. [Reference Sankar, Brown and Balamurugan25], a 3*3 tactile array was mounted on a bionic finger to classify items with seven different textures. The classification results achieved 99.21% accuracy on the SVM model. The KNN classifier mentioned in the paper [Reference Younes, Ibrahim, Rizk and Valle26] is also a classical model that is commonly used as a comparison algorithm. In addition, Chen Z et al. [Reference Chen, Zuo, Hu and Lin27] develop a series of Gaussian elastic matching kernels to deal with the problems of time shift and nonlinear representation. On the basis of KSC, H. Liu et al. [Reference Liu, Guo and Sun28] propose a joint kernel sparse coding (JKSC) model to solve the multifinger tactile sequence classification problem. And it verifies better performance than KSC. P. Xiong et al. [Reference Xiong, He, Song and Liu29] propose a method to convert multimodal sparse codes obtained using a unified dictionary into shared labels, enhancing the fusion of multimodal information. Meanwhile, in the field of object recognition, reference [Reference Xiong, Tong, Liu, Song and Li30] proposes a novel few-sample learning method with a coupled dictionary learning framework, which can effectively perceive unknown objects under few-sample learning. Reference [Reference Xiong, Liao, Zhou, Song and Liu31] proposes a deeply supervised subspace learning method to help robots perceive the properties of objects during noncontact human-robot interaction.
2.3. Slip detection
Slip refers to the relative motion that occurs between two rough surfaces, which then generates a high-frequency signal [Reference Sinou, Cayer-Berrioz and Berro32]. Slip detection is amplifying and capturing this signal. Tactile sensing is an important part of slip detection. In ref. [Reference James and Lepora33], J. W. James et al. used the T-MO sensor to grasp 11 different objects. The experiment was divided into two pieces: adding weight during grasping to destabilize and using slip detection to stabilize the grasp at the first contact with objects. This verifies that the sensor relies on slip detection to stabilize grasping in an unstructured environment. Similarly, these authors also used TacTip to measure positions of the internal pins embedded in their skin to determine whether slippage is generated [Reference James, Pestell and Lepora34]. There are also many models for slip detection. Reference [Reference Zapata-Impata, Gil and Torres35] proposed a ConvLSTM model that uses spatiotemporal tactile features learned from a tactile sensor to detect the direction of slip. Reference [Reference Li, Dong and Adelson36] proposed a deep neural network for slip detection. The objects trained during the experiments are unknown. Furthermore, in ref. [Reference Stachowsky, Hummel, Moussa and Abdullah37], a force mediation strategy for precision grasping is proposed. This strategy is independent of the properties and surface features of objects and is applicable to a variety of grasps. Part of this work is to compute the magnitude signal of slip using the covariance matrix of the tactile data. This gives the idea of slip detection in this paper.
3. FVSight sensor design
3.1. Measuring circuit for the force-tactile array
The distributed force-tactile array in FVSight can be modeled as a matrix array with variable resistance of 4*4. It is necessary to pay attention to the electrical short-circuit phenomenon between any two electrodes when measuring the analog voltage values at each junction. Therefore, it is necessary to isolate the signal by a switching circuit, which is designed as shown in Fig. 2 (a).
Distributed force-tactile sensing array measuring circuit. (a) Force-tactile sensor array measurement circuit. (b) Single node measurement circuit.

When the sensor works, one row is selected by the multi-channel analog switcher S1 (CD4066) and connected to the power supply. The resistors of other rows are in a high-impedance state. The voltage of each column is equal to the input voltage, and each column is independent of each other. Then, the STM32 microcontroller equipped with a 16-bit ADC chip scan sampling the analog voltage value of the active row, where the force measurement circuit of a single node is shown in Fig. 2 (b). The relationship between the output voltage Uout and the measurement resistance is expressed in equation (1).
 \begin{equation} U_{out} \equiv VCC\times \frac{R}{R_1+R} \end{equation}
where R1 indicates the resistance value of a junction of the force-tactile unit. After measuring all the resistive units in this line, the microcontroller uses S1 to connect the next line to the power supply and obtains the analog voltage value at each junction in the line. This can be cycled four times to obtain the analog voltage value of the entire force-tactile array of 16 junctions, thus obtaining the contact force-tactile distribution between the object under test and the flexible tactile film. In the circuit, the power supply VCC is provided by the AMS-1117 voltage regulator chip with a value of 3.3V, and R is used as a voltage divider resistor with a size of 10 k
 $\Omega$
.
3.2. Calibration of the force-tactile array
Figure 3(a) shows the calibration device performing a static force calibration experiment on the tactile sensing array. The device applies a force in a vertical direction to one contact in the tactile array, and the force is measured ranging from 0 to 50 N. During the experiment, the value of the force is recorded along with the induced voltage of the array. The value of voltage is then converted to the value of force. The magnitude of force varies uniformly at a rate of 1n/s. We performed two experiments on the tactile array, pressing and unloading. The curves of the force values with time during these two processes are shown in Fig. 3(b).
The experimental results show that the sensor has a high sensitivity in the small pressure range and is suitable for the detection of moderate contact force in strength. Also, the maximum difference between the longitudinal coordinates of the press curve and the unload curve is compared. The presence of low hysteresis in the haptic array does not have an impact on our experiments.
Force calibration experiment. Experimentally observe the change of force in two processes of tactile array pressing and unloading.

Standard weight experiment. Weights of different masses are placed on different contacts in the perceptual layer.

Additionally, the perceptual layer of FVSight was equipped with standardized weights of 20, 50, 100, and 200 g, as illustrated in Fig. 4(a). The corresponding force-tactile values are depicted in Fig. 4(b). Placing various masses on distinct contacts of the perceptual layer resulted in force-tactile values corresponding to their respective weights. This validation underscores that the different contacts of the perceptual layer exhibit uniform sensitivity to stress.
3.3. Parameters of the FVSight
The hardware part of sensor includes a camera, a flexible force-tactile sensing array, RGB light beads, and a housing. The housing of the device is made of epoxy resin print and has an overall rectangular shape. The camera is mounted on the top of the device, and the shooting view can cover all the sensing layer. RGB light beads provide three channels of light source to enrich the characteristics of the image. The flexible force-tactile sensing array is wrapped with canvas using force-tactile array as shown in Fig. 5(b). The sensing layer not only acquires the stress generated when objects touch but also records the information of canvas deformation. The installation position of each part of the sensor is shown in Fig. 5(a). The device is securely attached to the robot arm using a hot-melt adhesive, allowing it to be easily installed on all robot arm setups with flat surfaces. This makes it especially well-suited for mounting on robotic arms used in industrial applications, such as object sorting or detecting object movements in assembly lines. The detailed parameters of the sensors are shown in Table I.
Real-world FVSight model parameters.

Overall sensor structure and sensing layer. (a) Distribution of sensing units inside the device. (b) The circuit array inside the sensing layer with resistive units.

Object set. The photos were taken by cell phone camera. The dataset includes 27 different features of household items.

FVSight data when pressing on different kinds of experimental samples. The RGB image represents the haptic image, and the histogram represents the force-tactile array information of 16 contacts. The array distribution values generated by different sample contact perception layers are related to the shape of the sample and the depth of the press. From left to right and top to bottom, they are earphone, shaver, glue, batteries, toy, and spoon.

The process of training the dataset collected by FVSight. Firstly, the acquired tactile image information is parsed into n-dimensional vectors by VGG and PCA algorithm, and the tactile array information is averaged into 16-dimensional vectors, then the vector information of the two modalities is spliced into (n + 16)-dimensional vectors, which are divided into two parts: training set and test set. Finally, the test set gets the prediction labels after the classifier model, and the classification results are obtained after comparing with the reference labels of the training set.

4. Methods and results of object classification experiment
Experimental data are obtained from 27 different items, as shown in Fig. 6. Twelve sets of tactile image information and force-tactile array information are collected for each item, of which 10 sets are deep presses and 2 sets are shallow presses. A partial sample of the data is shown in Fig. 7. The authors in ref. [Reference Xiong and Yin17] detail the production method of VicTac Item Dataset, and add new algorithm models for validation in this paper. It is crucial to emphasize that, throughout the experiment, all objects were consistently positioned and oriented identically. Moreover, the parameters for each press executed by the robotic arm were standardized. The experimental procedure is shown in Fig. 8. Firstly, the data of different objects are labeled, and then, the deep pressure dataset is divided into two parts: training set and test set, with a ratio of 9:1. The tactile array information is a sequence of 16 stress values containing shape information and depth information. The visual information is extracted from the center part of 256*256 tactile images, parsed into 512-dimensional feature information using the VGG algorithm, and then downscaled using the PCA algorithm. Then the test set and training set of depth presses in a single tactile or visual modality are used for classification experiments using four algorithms: KSC, JKSC, KNN, and SVM. Finally, the multimodal depth press data are fused using four algorithms for classification experiments, the formula for calculating the accuracy of object classification is shown in equation (2):
 \begin{equation} Accuracy \equiv \frac{\#of\ correctly\ training\ samples}{\#of \ training\ samples} \end{equation}
That is, we use the data of a single known item in the test set to compare with all the data of the unknown items in the training set arbitrarily and take out the training set data with the highest similarity. If the labels of the two data agree, the classification is considered correct this time. Since there is a bit of uncertainty in the classification algorithm, the final result is the average of 10 experiments. After doing the depth-pressing experiment, we added the noise data, that is, shallow-pressing data, to do the comparison test. The method is the same as the original experiment. And the dataset in the comparison experiment is divided into two parts, the training set and the test set, with a ratio of 11:1.
4.1. Kernel sparse coding model
The KSC model [Reference Chen, Zuo, Hu and Lin27] is used in this experiment for unimodal sample data. This algorithm is mainly used to find the coding vectors of the sample data so that the samples are represented as a linear combination of these coding vectors and the training samples after high-dimensional mapping. This model is:
 \begin{equation} \min _X \sum _{t/ v=1}^{T/ V}\left \|\Phi \left (S^{(t/ v)}\right )-\Phi \left (\varsigma ^{(t/ v)}\right ) \chi ^{t/ v}\right \|_F^2+\lambda \|\chi \|_1 \end{equation}
where
 $S^{(t/ v)}=\left [S^{\left (t_1/ v_1\right )} \ldots S^{\left (t_n/ v_n\right )}\right ] \in R^{d \times n}$
are the test samples of tactile sequence or image data,
 $\varsigma ^{(t/ v)}=\left [\varsigma ^{\left (t_1/ v_1\right )} \ldots \varsigma ^{\left (t_n/ v_n\right )}\right ] \in R^{d \times n}$
are the training samples of tactile sequences or image data,
 $\Phi (\cdot )$
is the implicit mapping function,
 $\chi ^{t/ v}$
is the encoding parameter which is obtained using Kernel Orthogonal Matching Pursuit under row zero parametric constraints,
 $\lambda$
is the penalty weight, and by this model we can classify the test sample
 $S^{(t/ v)}$
according to the residue:
 \begin{equation} r_c^{(t/ v)}=\sum _{t/ v=1}^{T/ V}\left \{-2 \kappa ^T\left (S^{(t/ v)}, \varsigma _c{ }^{(t/ v)}\right ) \chi _c^{(t/ v)}+\chi _c^{(t/ v)^T} \kappa \left (\varsigma _c{ }^{(t/ v)}, \varsigma _c{ }^{(t/ v)}\right ) \chi _c^{(t/ v)}\right \} \end{equation}
where
 $\varsigma _c{ }^{(t/ v)}$
is the cth unimodal object class,
 $\chi _c^{(t/ v)}$
is the coefficient associated with the
 $c$
th class, and the label
 $c^{*}$
of the test sample is determined by the smallest reconstruction error class, and whether the object recognition is correct this time can be obtained by comparing the labels of the test sample with the training sample, which is given by:
 \begin{equation} c^*=\arg \min _{c \in \{1, \ldots, C\}} r_c^{(t/ v)} \end{equation}
4.2. Joint kernel sparse coding model
The JKSC model is used in this experiment for multimodal sample data. The core idea of JKSC is similar to KSC, so the algorithm model is basically the same. On the basis of KSC, [Reference Liu, Guo and Sun28] gives a method for classifying multimodal information, the residue is:
 \begin{align} r_c^{(t, v)}& =\sum _{t=1}^T\left \{-2 \kappa ^T\left (S^{(t)}, \varsigma _c{ }^{(t)}\right ) \chi _c^{(t)}+\chi _c^{(t){ }^T} \kappa \left (\varsigma _c{ }^{(t)}, \varsigma _c{ }^{(t)}\right ) \chi _c^{(t)}\right \} \nonumber\\ & +\sum _{v=1}^V\left \{-2 \kappa ^T\left (S^{(v)}, \varsigma _c{ }^{(v)}\right ) \chi _c^{(v)}+\chi _c^{(v)^T}\kappa \left (\varsigma _c{ }^{(v)}, \varsigma _c{ }^{(v)}\right ) \chi _c^{(v)}\right \} \end{align}
Similarly, we can calculate the sum of reconstruction errors based on multimodal information, and then use
 $r_c^{(t, v)}$
to determine the labels of objects in the test set. Based on the comparison with the labels of objects in the training set, the results of object classification can be obtained. Among them, JKSC and KSC calculate the distance by kernel formula, KSC is applicable to classify objects under unimodal data, and JKSC classifies objects under multimodal data by combining multiple KSC.
4.3. K nearest neighbors model
KNN is an algorithm to determine the class of unknown samples by finding the nearest K training neighbor vectors with the distance between unknown samples and all known samples as a reference, which means that the KNN algorithm only relies on the class of the nearest one or more samples to determine the class of the unknown samples in the classification decision. And this method does not require estimation parameters and is suitable for multi-classification problems. In this experiment, we choose to select the Euclidean distance as the distance function, and the Euclidean distance between the training and test vectors is:
 \begin{equation} d(x, y)=\sqrt{\sum _{i=1}^n\left (x_i^{(t, v)}-y_i^{(t, v)}\right )^2} \end{equation}
where
 $x$
is the test set feature vector and
 $y$
is the training set feature vector. The test vector is classified by setting a suitable value of positive integer K and by finding the minimum distance between
 $x$
and
 $y$
. The classification effect is achieved by finding the minimum distance between
 $x$
and
 $y$
.
4.4. Support vector machine model
SVM is a binary classification model, which maps feature vectors to some points in space and then draws an optimal line or a hyperplane that maximizes the margin between two categories for sample space partitioning. This algorithm is suitable for small and medium data samples, nonlinear and high-dimensional classification problems. The training dataset labeled in the experiments in this paper is as follows:
 \begin{equation} \left (x_1^{(t, v)}, y_1\right ), \ldots,\left (x_n^{(t, v)}, y_n\right ), x_i^{(t, v)} \in R, y_i \in ({-}1,+1) \end{equation}
where
 $x_i^{((t,v)}$
is the feature vector representation of the tactile sequence and the tactile image, and
 $y_i$
is the category label of the support vector point
 $x_i^{(t,v)}$
(negative or positive), the optimal hyperplane can be defined as:
 \begin{equation} w x^T+b=0 \end{equation}
where
 $w$
is the weight vector,
 $x$
is the input feature,
 $b$
is displacement, which determines the distance of the hyperplane from the origin, and these parameters satisfy the following equation:
 \begin{equation} w x_i^T+b \geq +1 \text{ if } y_i=1 \end{equation}
 \begin{equation} w x_i^T+b \leq -1 \text{ if } y_i=-1 \end{equation}
The purpose of training the SVM model is to find the most suitable
 $w$
and
 $b$
that maximize the distance
 $\frac{1}{\|w\|^2}$
between the division hyperplane and any point on the marginal hyperplane on both sides of it, so that the model can better distinguish the feature information of the differently labeled items and divide the differently labeled items by the hyperplane to train the dataset to obtain the accuracy of object recognition.
4.5. Results analysis
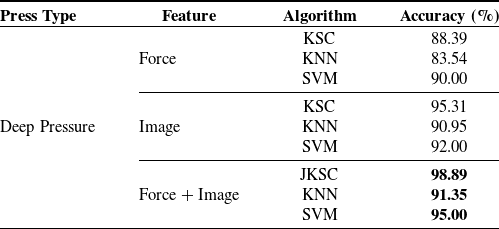
The experimental results of object classification are shown in Table II and Table III. Firstly, we put force-tactile information and tactile image information into the classifier model separately. Importing force-tactile array information, the accuracy is 88.39% under the KSC model, 83.54% under the KNN model, and 90% under the SVM model. Importing the tactile image information, the accuracy is 95.31% under the KSC model, 90.95% under the KNN model, and 92% under the SVM model. Both modal data achieve more than 83% accuracy and it is not difficult to find that the tactile image reliability is stronger. Then, we combined the image information and the tactile information into the classifier model for classification, and the accuracy was 98.39% under the JKSC model, 91.35% under the KNN model, and 95% under the SVM model. Obviously, the accuracy under each model is improved significantly, which also proves that multimodal data fusion is more accurate than unimodal information in object recognition.
Experimental results of object classification.
Experimental results of object classification with interference data.

Subsequently, we added the shallow press data to re-run the classification experiments. Relying on force-tactile information for classification, the accuracy decreased by 11–16%. Relying on tactile image information, the accuracy decreased by 8–19%. Fusing the data from both, the accuracy decreased by 8–15%. The effect of shallow pressure data can be clearly seen in the comparison of the two experimental results. Also, the above experimental results verify the effectiveness of the sensor for object perception.
5. Methods and results of slip detection experiment
In order to enrich the functionality of the sensor, we use FVSight to detect the slip state of object based on the existing hardware. The sensor is mounted on UR3 robot arm. The robot arm movement drives a slight slip between the sensor and the object. Slip under vision can be observed by eyes, while slip under tactile sensation needs to be observed by algorithm. We control the robot arm so that FVSight presses the object with a force of 5 N. The initial state is stationary, then it moves laterally at a fixed speed and direction and then comes to rest. The experimental process is shown in Fig. 9. The whole process is repeated 20 times. Slip data were collected for each of the three objects. The experimental procedure ensured uniformity across all objects, covering the entire sequence from initial rest, through slipping, to returning to a resting state. Finally, the slip data and the stationary data are imported into the algorithm to determine whether slip occurs. Figure 10 illustrates the force-tactile data for different object-sliding processes.
Slip process. Three distinct shapes of objects – specifically, a ball, a cuboid, and a cylinder – were selected as entities for sliding experiments. The force-tactile data collected during the sliding process were used as input for the covariance model to calculate the sliding outcomes.

Force-tactile data during object sliding. The change of force-tactile data of three different objects throughout the sliding process.

5.1. Slip detection principle
We assume that the process of object slipping is discrete. The force-tactile sequence under each moment during the contact between the sensor and the object is
 $F(t)=(f_1,,,f_{16})$
, where
 $f_i$
is the stress value of the ith contact of the tactile array. The derivative of the
 $i$
th contact force at any two adjacent moments is defined as:
 \begin{equation} d_i(t_n)=f_i(t_n)-f_i(t_{n-1}) \end{equation}
Ideally, when no slip is generated between the object and the tactile array,
 $d_i(t_n)=0$
. In practice, there is noise in the data from real sensors. We assume that the steady state
 $d_i(t_n)$
obeys a zero-mean Gaussian distribution. If a slip occurs,
 $d_i(t_n)=0$
becomes an indeterminate value. We save the derivative values of 16 contact forces for the whole slip process in a new matrix
 $\chi$
.
 \begin{equation} \chi (t_n)=\begin{bmatrix} d_1(t_1) & \quad \dots & \quad d_{16}(t_1) \\[3pt] \vdots & \quad \ddots & \quad \vdots \\[3pt] d_1(t_n) & \quad \dots & \quad d_{16}(t_n) \end{bmatrix}_{n \times 16}, \ \chi \in R^{n\times 16} \end{equation}
Then, define the covariance matrix
 $\phi$
of the data:
 \begin{equation} \phi (t_n)=\chi (t_n){\chi (t_n)}^T,\ \phi \in R^{j\times j} \end{equation}
This covariance matrix contains information about whether the object slips or not. If no slip is generated,
 $d_i(t_n)$
obeys a zero-mean Gaussian distribution and
 $\phi (t_n)$
can be viewed as a diagonal matrix. If slip is generated,
 $\phi (t_n)$
can be seen as an offset in the base of diagonal matrix. The magnitude of offset is the amount of displacement of slip. Combining the above derivation,
 $\phi (t_n)$
can be written as:
 \begin{equation} \phi (t_n)=\tau +\varepsilon \end{equation}
where
 $\tau$
is a
 $j\times j$
diagonal matrix representing the steady state.
 $\varepsilon$
is a
 $j\times j$
matrix with diagonal 0, representing the slip distance. If
 ${\Vert \varepsilon \Vert }_\infty$
is approximated by 0,
 $\varepsilon$
is approximated by a 0 matrix. It is known that
 ${\Vert \varepsilon \Vert }_\infty$
is equal to the maximum sum of rows of the matrix. We can calculate the value of
 ${\Vert \varepsilon \Vert }_\infty$
for the whole slip process, and the slip is judged to be generated when the value is greater than
 $\beta$
. The value of
 $\beta$
affects the experimental results. In this paper, we determine the value of
 $\beta$
by a prior slip.
5.2. Results analysis
The experimental results are shown in Table IV. Overall, the success rate of slip detection is very high. A slip detection failure is observed specifically for the cylinder, potentially attributed to the delayed response of force information resulting from the unrecovered deformation of the flexible tactile array. This results in a small covariance matrix difference of the slip data in two consecutive time points. This failure can be avoided by increasing the AD sampling speed. There is some noise in the data of the object at rest. However, this noise does not affect the results.
Experimental results of data under slip and no slip.

We select three representative data sets from the slip test results of three different objects for presentation. Figure 11 shows the relationship between
 ${\Vert \varepsilon \Vert }_\infty$
and the slip signal. At moment t, it is sliping when
 ${\Vert \varepsilon \Vert }_\infty \gt =\beta$
. When
 ${\Vert \varepsilon \Vert }_\infty \lt \beta$
, it is stationary. If the slip signal consistently exceeds the specified threshold
 $\beta$
over a period of time, then trigger slip has occurred. It is worth noting that there are intermittent situations where the slip signal briefly drops to zero during the slip process. This phenomenon is mainly influenced by the inherent unpredictability of the sensor slip vibration. The final results show that this slip detection algorithm is effective. FVSight has excellent performance in the field of slip detection.
Sample slip detection. Slip detection is considered successful when the slip signal consistently surpasses the threshold
 $\beta$
over multiple consecutive time periods.

6. Conclusion
In order to solve the problem of weak pairing between multimodal data that exists in conventional robots for object perception, this work introduces a multimodal tactile sensor based on a distributed flexible tactile sensing array and a vision unit. The core idea is to use one perception layer to trigger two heterogeneous tactile modal information, so that the vision-tactile information can be matched spatially and temporally. Meanwhile, object recognition and slip detection experiments are conducted. The integration of sparse coding principles enhances feature extraction, while classical classifiers help to achieve robust classification. Validation of the classification methodology is performed on a dataset comprising 27 objects, revealing a significant enhancement in classification through multimodal fusion. Furthermore, the covariance operator method is employed to enhance slip correlation within array information. The slip detection ability of the sensor is verified on three different objects. This study provides a detailed description of the application of these algorithms to improve object classification and slip detection.
In future work, we want to refine FVSight and optimize the tactile resolution of the perceptual layer. A high degree of pairing can be achieved for multimodal recognition of some precision textures. Simultaneously, a high-performance algorithm can be devised to effectively integrate visual and haptic information, enabling FVSight to be deployed in object recognition and slide detection processes, thereby achieving superior results. Finally, the sensor can also be extended in the research fields of cross-modal generation, motion prediction, and tactile recurrence.
Author contributions
A and D provide ideas and directions for the paper, control the overall research progress, and help with the writing of the paper. B involves the research on high-performance algorithms related to object classification and slip detection experiments. C entails sensor fabrication and experimental data collection. Both B and C collaborate on the completion of the paper. E is responsible for formatting and grammar editing of the paper.
Financial support
This work was supported in part by the National Natural Science Foundation of China under Grants 62373181, 62163024, 61903175, and 61663027; and in part by Jiangxi Science Fund for Distinguished Young Scholars under Grant 20232ACB212002; and in part by Jiangxi Double Thousand Plan Project under Grant jxsq2023201097; and in part by Jiangxi Academic and Technical Leaders in Major Disciplines Project under Grant 20204BCJ23006; and in part by National Key R
 $\&$
D Program of China under Grant 2023YFB4704903.
Competing interests
The authors declare no competing interests.
Ethical approval
Not applicable.



