Implications
A major problem of the pig industry is pre-weaning mortality. Piglet performance, immediate- and long-term survival depend on early intake of good quality colostrum. Reduced teat accessibility due to larger and more heterogeneous litters and increased sow body size impairs colostrum intake. Knowledge of udder morphology in order to facilitate teat accessibility is therefore of fundamental importance to improve nursing ability of modern sows.
Introduction
Sow productivity and nursing ability are the base to support the economy and the efficiency of the pig industry (Kim et al., Reference Kim, Easter and Hurley2001). Piglets are totally dependent on their mother when they are born, and adequate intake of good quality colostrum is fundamental for their immediate and longer-term survival (Edwards, Reference Edwards2002). In this respect, a short latency to find a teat and suckle is vital for a newborn piglet (Andersen et al., Reference Aziz, Roehe and Kalm2011). Udder conformation plays a role in this; modern sows have larger body size and sub-optimal udder conformation that affects the ability of the newborn piglets to find a teat and suckle (Vasdal and Andersen, Reference Vasdal and Andersen2012). Genetic selection for lean growth rate and prolificacy in swine has also had undesirable consequences for piglet survival (Canario et al., Reference Canario, Pere, Tribout, Thomas, David, Gogue, Herpin, Bidanel and Le Dividich2007; Tribout et al., Reference Tribout, Caritez, Gruand, Bouffaud, Guillouet, Billon, Pery, Laville and Bidanel2010), reducing size and maturity of piglets at birth and increasing sibling competition. Rydhmer (Reference Rydhmer2000) reviewed genetic selection in the pig, focussing on all aspects of the sow production cycle, and stated that the present genetic increase in number of piglets born will become meaningless without selecting also for maternal ability. Morphological and genetic studies on the sow udder are scarce and have focussed on functional teat number (Jonas et al., Reference Jonas, Schreinemachers, Kleinwaechter, Uen, Oltmanns, Tetzlaff, Jennen, Tesfaye, Ponsuksili, Murani, Juengst, Tholen, Schellander and Wimmers2008; Vasdal and Andersen, Reference Vasdal and Andersen2012; Chalkias et al., Reference Chalkias, Ekman, Lundeheim, Rydhmer and Jacobson2014) and on mammary gland characteristics in terms of milk production (Farmer and Sorensen, Reference Farmer and Sorensen2001; Ford et al., Reference Ford, Kim, Rodriguez-Zas and Hurley2003; Theil et al., Reference Theil, Sejrsen, Hurley, Labouriau, Thomsen and Sorensen2006). In contrast, udder conformation traits have been well studied and included as selection criteria in other species, since these determine the suitability for mechanical milking in goats (Horak and Gerza, Reference Horak and Gerza1969; Wang, Reference Wang1989), cows (Moore et al., Reference Moore, Higgins, Kennedy and Burnside1981) and sheep (Labussiere et al., Reference Labussiere, Dotchewski and Combaud1981; Casu et al., Reference Casu, Sechi, Salaris and Carta2010). In sows there is only one published study on udder conformation, which determined genetic parameters of mammary gland firmness in relation with milk production (Aziz et al., Reference Andersen, Naevdal and Boe1995). To date, no study has been reported on the associations between udder conformation, milk production and piglet survival. Therefore, the aim of this project was to develop practical measures to describe udder conformation that can be used in studying the correlation between these traits and piglet survival, and in determining their potential use in sow selection programs.
Material and Methods
Animals
All procedures on animals were in accordance with institution guidelines and UK animal welfare regulations, and approved by the Animal Welfare and Ethics Review Body of Newcastle University. The experiment was performed at Cockle Park Farm, Newcastle University, Newcastle upon Tyne, UK. The trial was carried out on 24 sows of crossbred genotype (Large White×Landrace dam line), which had been inseminated with semen from a synthetic sire line (Hermitage Genetics, Kilkenny, Ireland). In accordance with normal commercial farm procedures, animals were moved from the group gestation house to the farrowing unit at 110 days post-insemination, where they were kept in individual crates equipped with a feeder and drinker. Ambient room temperature averaged 21°C. Sows were allowed to farrow normally at term over a 4-days period (Monday to Thursday); sows that had not farrowed within this period were then induced on Thursday by injection of a prostaglandin analogue. Sows were fed home-milled meal before and during lactation (18.5% CP, 13.98 MJ DE and 0.95% total lysine); at a level of 2.0 kg/day from entry to the farrowing accommodation until parturition.
Udder measurements
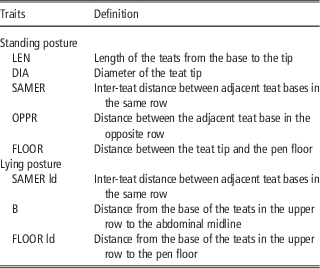
The sows were scored for six udder conformation traits measured twice a day on every day from the sows’ entrance into the farrowing crates (Monday) until parturition. Trait definitions are given in Table 1. To evaluate the feasibility of the recording process, where it was possible, measures were taken both when the sow was lying and when she was standing. Some traits were measured in both postures, but others only in one posture because the constraint of the anatomy and behaviour of the sows prevented measurements. The classification of the measurement for each posture is reported in Table 1. To assess the uniformity between sides, data were collected from both teat rows in each posture. Five traits were measured using a retractable flexible ruler. Initially a tailor’s ruler was used and it was applied directly on the skin surface, but the reading was not possible all the time because of the sow’s reaction and movement. For a single operator a rigid tape measure facilitated the recording process. Teat diameter was measured using a calliper. All the measurements were reported in millimetres.
Definition of measurement of sow udder conformation traits (mm)

Measures were taken for each teat with its teat pair and teat side noted.
Statistical analysis
Data were excluded from the analysis if they were incomplete due to missing repeated values. Descriptive statistics were performed, and data are reported as arithmetic mean and standard deviation (mean±SD). Data repeatability, based on measurements of the same parameter at different time points (AM and PM), was assessed with the intraclass correlation coefficient (ICC package in R; Wolak et al., Reference Wolak, Fairbairn and Paulsen2012). Data are considered highly reproducible when ICC>0.8 (Wolak et al., Reference Wolak, Fairbairn and Paulsen2012). A linear model (lm function in R) was applied to evaluate the proportion of variance of each measured trait (considered as a continuous dependent variable) explained by the main and interaction effects of different factors (day when the measurement was recorded, sow and teat pair position, each considered as fixed effects). To test the significance of day, position and side, a mixed effects linear model (nlme package in R; Pinheiro et al., Reference Pinheiro, Bates, DebRoy and Sarkar2007) was used to analyze the pseudoreplicated data (multiple observations of the same sow on the days before farrowing, on the two sides and at different teat pair positions) considering sow as a random effect to correct for repeated measurements within sow. Specifically, the following statistical model with fixed and random effects was applied:
 $$y_{{ijk}} {\equals}\beta _{0} {\plus}S_{i} {\plus}D_{j} {\plus}TPP_{k} {\plus}{\rm sow}{\plus}{\epsilon}_{{ijk}} $$
where y ijk is the dependent variable studied, such as SAMER, LEN, DIA, FLOOR, B, OPPR, S i is side (fixed effect with two levels), D j the day before farrowing (fixed effect with five levels), TPP k the teat pair position (fixed effect with eight levels), sow is the animal (random effect), ε ijk the random error. Separate analyses were performed for each conformation trait. The level of significance was taken as P<0.05. The statistical software R version 3.0.2 (2013-09-25) was used for all tests.
Results
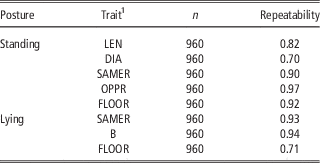
In total, 11 436 scores were collected. Sows were sampled at different parities (first parity nine sows, five second, two third, one fourth, two eighth, two tenth and three eleventh parity). In total, four sows farrowed on the 6th day from the entrance into the farrowing crate, ten sows farrowed on the 5th day, eight sows farrowed on the 4th day, one sow on the 3rd day and one sow on the 2nd day. In total, 341 teats were measured (two sows had eight functional teats on both sides, six sows had eight functional teats on one side and seven on the other, twelve sows had seven functional teats on both sides, three sows had seven functional teats on one side and six on the other; one sow had six functional teats on both sides). To assess repeatability of measures only the sows and days with full data were kept; five sows were excluded from the analysis. The ICCs of the repeated measures of the six udder characteristics are shown in Table 2.
Repeatability (intraclass correlation coefficient) of sow udder trait measures

Traits were measured in millimetres.
1 Udder trait measurement: LEN=teat length; DIA=teat diameter; SAMER=inter-teat distance within the same row; FLOOR=distance from the teat base to the floor of the pen; OPPR=distance from the teat base to the adjacent teat on the other row recorded in a standing posture; B=distance from the teat base to the abdominal midline, recorded in a lying posture.
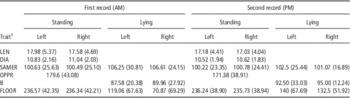
Descriptive statistics of each measured trait, classified by posture, side and repeated measurements (AM and PM) are presented in Table 3.
Mean and (standard deviation) in millimetres of six sow udder traits

1 Udder trait measurement: LEN=teat length; DIA=teat diameter; SAMER=inter-teat distance within the same row; FLOOR=distance from the teat base to the floor of the pen; OPPR=distance from the teat base to the adjacent teat on the other row recorded in a standing posture; B=distance from the teat base to the abdominal midline, recorded in a lying posture.
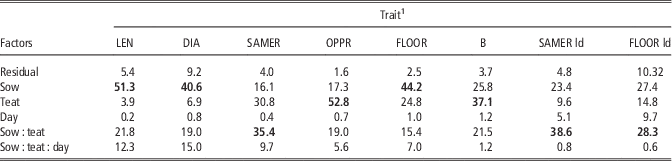
The variance components for each of the six measured traits are presented in Table 4. The largest proportion of variation in teat dimensions (LEN=51% and DIA=40%) was explained at the sow level. The variance in the distance from the teat base to the adjacent teat on the other row, recorded in a standing posture, and the distance from the teat base to the abdominal midline, recorded in a lying posture, was highest at the teat pair position level (OPPR=53%; B=37%). These two dimensions were recorded differently according to the posture due to the practicality of measurement in a lying animal with sometimes only partial udder exposure. For the different SAMER dimensions, recorded in a standing or lying posture (SAMER=35%; SAMER ld=39%) the largest proportion of variance was explained by interaction between sow and teat pair position. Only a small part of the variation in the six udder conformation traits was explained at the day level.
Percentage of variance explained by sow, teat pair position, the day of the recording, the interaction between the sow and the teat pair position and the interaction of the sow, the day and the teat pair position for six traits describing the udder conformation of 24 sows

For each trait, the value in bold indicates the factor that explains the largest proportion of variation.
1 Udder trait measurement: LEN=teat length; DIA=teat diameter; SAMER=inter-teat distance within the same row; FLOOR=distance from the teat base to the floor of the pen; OPPR=distance from the teat base to the adjacent teat on the other row recorded in a standing posture; B=distance from the teat base to the abdominal midline, recorded in a lying posture; SAMER ld=inter-teat distance within the same row, recorded in a lying posture; FLOOR ld=distance from the teat base to the floor of the pen, recorded in a lying posture.
Factors associated with udder conformation trait variation
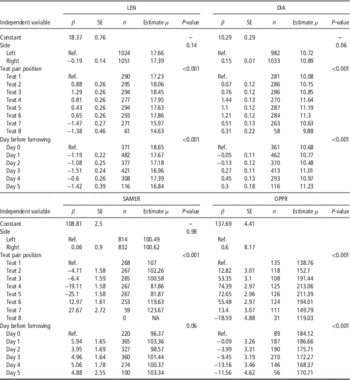
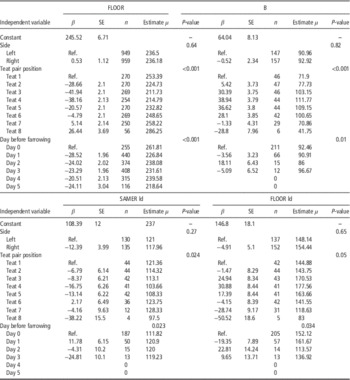
The results of the mixed effects linear model are presented in Tables 5 and 6. Side was not associated with any of the dependent variables, whereas teat pair position was significantly associated with all udder conformation traits measured. Only the measurements recorded immediately before farrowing were significantly different from the previous udder traits measurements. Generally, teat diameter decreased 1 day before farrowing (day 5=11.23 mm v. day 0=10.68 mm; P<0.001), whereas FLOOR (day 5=218.64 mm v. day 0=261.81 mm; P<0.001), LEN (day 5=16.84 mm v. day 0=18.65 mm; P<0.001) and OPPR (day 5=170.71 mm v. day 0=184.12 mm; P<0.001) dimension increased significantly between the entry into the farrowing crate and the parturition day.
Mixed effects linear model describing the factors associated with four udder conformation traits measured in a standing posture on 24 sows

LEN=teat length; DIA=teat diameter; β=linear regression coefficient; Ref=reference; SAMER=inter-teat distance within the same row; OPPR=distance from the teat base to the adjacent teat on the other row recorded in a standing posture.
Mixed effects linear model describing the factors associated with four udder conformation traits measured on 24 sows

FLOOR=distance from the teat base to the floor of the pen; B=distance from the teat base to the abdominal midline, recorded in a lying posture; β=linear regression coefficient; Ref=reference; SAMER ld=inter-teat distance within the same row, recorded in a lying posture; FLOOR ld=distance from the teat base to the floor of the pen, recorded in a lying posture
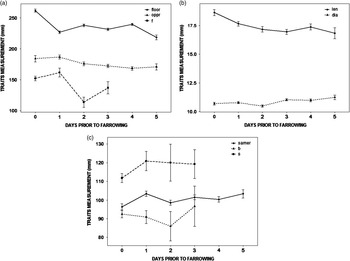
Figure 1 shows the mean values of the six udder conformation traits according to the day before farrowing. The lying posture measurements were recorded for only 3 days before farrowing because the sows did not lie laterally to expose the udder during the 1st day in the farrowing crate, preventing collection of these data.
Mean and SE of 6 udder conformation traits of 24 sows, recorded in millimetres in a standing or lying posture during the days before farrowing. (a) Floor=distance from the teat base to the floor of the pen recorded in a standing posture; oppr=distance from the teat base to the adjacent teat on the other row recorded in a standing posture; and f=distance from the teat base to the floor of the pen recorded in a lying posture. (b) LEN=teat length and DIA=teat diameter. (c) Samer=inter-teat distance within the same row, recorded in a standing posture; b=distance from the teat base to the abdominal midline, recorded in a lying down posture; and s=inter-teat distance within the same row, recorded in a lying posture.

Discussion
To characterise udder conformation, two series of measurements were performed by one operator every day from the entrance of a sow into the farrowing house until farrowing, with six traits recorded on each occasion. The evaluation method proposed is based on traits previously used to define udder conformation in the description of cows (Hickman, Reference Hickman1964; Higgins et al., Reference Higginst, Moore and Kennedy1980; Moore et al., Reference Moore, Higgins, Kennedy and Burnside1981), sheep (Labussiere et al., Reference Labussiere, Dotchewski and Combaud1981; Makovicky et al., Reference Makovicky, Nagy and Makovicky2013) and goats (Wang, Reference Wang1989). These measurements were adapted due to the different morphology of the sow udder, principally the lack of a milk cistern, the greater number of teats and the small nipple dimension. Linear scores were not adopted, as often done in other species, since this was the first attempt to evaluate sow udder conformation, and the knowledge and experience of the classifier was not sufficient to transform the biological descriptive traits into a linear scale.
With respect to the first research question, it was found that measures that adopted anatomical landmarks as a reference point were highly repeatable. In contrast, measures which relied on distance relative to the floor were less so, as these were more affected by sow posture or motion at the time of measurement. The same repeatability of udder traits was found in the sheep for ranking ewes with a single score per lactation for selection purposes (Casu et al., Reference Casu, Pernazza and Carta2006).
The second question in this study sought to determine the effect of side and posture on udder morphological measurements. Results showed that on average records were not significantly different on the two sides of the same sow, indicating a lack of significant asymmetry which would invalidate single side assessment. The effect of posture was not assessed statistically, since the same traits were recorded in different ways dictated by practicality of measurement in a lying animal with sometimes only partial udder exposure. The repeatability of the measurements was high in both postures. However, data collected in a lying down posture were less feasible on the 1st day after entry into the farrowing crate because the sows were more agitated. The trait FLOOR taken in a lying posture showed the highest within-sow variability and the smallest repeatability. This trait when taken standing was considered reliable to define udder conformation in ruminants (Labussiere et al., Reference Labussiere, Dotchewski and Combaud1981; Moore et al., Reference Moore, Higgins, Kennedy and Burnside1981), but in sows it cannot be reliably measured in either standing or, above all, lying posture, where the sows do not always lie in full lateral extension and expose the bottom row of teats (Fraser, Reference Fraser1976).
The third question in this study was to assess the main sources of variability of udder conformation trait measures. Results indicated significant variation at sow level. Such variation can be explained by the same factors that affect morphology in other species: parity number, breed, anatomical characterisation (sheep: Fernandez et al., Reference Fernandez, Alvarez, Sanprimitivo and Delafuente1995; Makovicky et al., Reference Makovicky, Nagy and Makovicky2013), but further studies are needed to determine the influence of these factors in the sow.
The trait FLOOR recorded in a lying posture and the teat diameter were the measurements that varied more within the same sow, moreover their lower repeatability reflected the same trends. Diameter results could be explained by the methods used to record the data. The calliper slightly pressed the teat during the measurement, and the degree of pressure could bias the repeatability. However, Zwertvaegher et al. (Reference Zwertvaegher, Van Weyenberg, Piepers, Baert and De Vliegher2012) recorded 8678 cow teat diameters using a more accurate technique, a two-dimensional vision-based camera, and they described the same diameter variability within animal.
With respect to the fourth research question, it was found that measurements were not significantly different according to the day of collection for almost all of the traits, the exceptions being FLOOR, OPPR and DIA, which showed significant changes mostly 1 day before farrowing. This suggests that most of the variables measured were not greatly affected over this period by growth of mammary glands due to colostrogenesis (Kim et al., Reference Kim, Osaka, Hurley and Easter1999). The increased distance between the teat bases in opposite rows on the parturition day might be explained by the onset of colostrogenesis. Overall, results for all the variables analysed indicated that the measurements taken with an anatomical landmark as a reference point are more reliable than those recorded using pen floor as a reference point. Teat diameter and distance from the adjacent teat in the opposite row measurements have to be corrected for the effect of day relative to farrowing.
This preliminary study showed that measures of udder conformation are repeatable within sow. Because they do not differ significantly between sides, in either standing or lying posture, they can be collected only from one side. The results show significant variability between sows and most do not change markedly in the days shortly before farrowing. Measures that use anatomical landmarks as the reference point are more reliable than those using the floor of the pen. Taken together, these results suggest that this methodology can be used to describe sow udder conformation in a quick and efficient way. This research will serve as a base for future studies focused on understanding the main sources of variation in udder morphology traits between sows. Further studies are also necessary to define how these udder conformation traits influence piglet suckling behaviour, survival and performance. Likewise it would be interesting to improve measurement methodology in order to assess mammary gland size variation. Moreover, in order to assess the feasibility of incorporating such traits into selection programmes, it is essential to investigate whether these traits are heritable and if they are correlated with other important production traits such as prolificacy and milk production.
Acknowledgement
A. B. was supported by a studentship from the British Pig Executive (BPEX).