INTRODUCTION
Coral reefs are among the most complex and diverse marine ecosystems (Jackson et al., Reference Jackson, Kirby, Berger, Bjorndal, Botsford, Bourque, Bradbury, Cooke, Erlandson, Estes, Hughes, Kidwell, Lange, Lenihan, Pandolfi, Peterson, Steneck, Tegner and Warner2001; Knowlton, Reference Knowlton2001). Their proximity to land, however, subjects them to multiple interacting stressors associated with human activities. Stressors related to these activities include land-based pollution (sedimentation, agricultural runoff, untreated sewage, etc.), eutrophication (Guzmán et al., Reference Guzmán, Jackson and Weil1991; Bell, Reference Bell1992; Guzmán & Jiménez, Reference Guzmán and Jiménez1992; Edinger et al., Reference Edinger, Jompa, Limmon, Widjatmoko and Risk1998; Öhman & Cesar, Reference Öhman, Cesar and Cesar2000; McCulloch et al., Reference McCulloch, Fallon, Wyndham, Hendy, Lough and Barnes2003; Fabricius, Reference Fabricius2005; Maina et al., Reference Maina, de Moel, Zinke, Madin, McClanahan and Vermaat2013; Wear & Thurber, Reference Wear and Thurber2015) and global warming (e.g. Munday et al., Reference Munday, McCormick and Nilsson2012), among others. These disturbances negatively affect biodiversity and coral reef resilience, which can ultimately lead to shifts in ecosystem structure and function (Mumby, Reference Mumby2009; Smith et al., Reference Smith, Hunter and Smith2010; Plass-Johnson et al., Reference Plass-Johnson, Ferse, Jompa, Wild and Techberg2015). One of the most affected taxa are coral reef fishes.
Coral reef fishes play important roles in ecosystem processes and energy flow in coral reefs (Bellwood et al., Reference Bellwood, Hughes, Folke and Nyström2004). The interaction between fish communities and reef habitat is strongly related to distinct feeding behaviours, which characterize various fish families and functional groups. Some fish species are, for example, shown to be largely responsible for the removal of Sargassum biomass, which may suppress the recruitment and growth of corals across several coral reef habitats (Great Barrier Reef; Hoey & Bellwood, Reference Hoey and Bellwood2009). On the other hand, a decline in predatory fish densities can lead to an increased density of crown-of-thorns starfish and, as a consequence, to the decline of reef building corals and coralline algae, and their replacement by filamentous algae (Dulvy et al., Reference Dulvy, Freckleton and Polunin2004). Changes in reef fish community composition due to environmental change can therefore have a large impact on the diversity and functioning of the reef ecosystem by promoting shifts in ecosystem structure and function (Mumby, Reference Mumby2009; Smith et al., Reference Smith, Hunter and Smith2010; Plass-Johnson et al., Reference Plass-Johnson, Ferse, Jompa, Wild and Techberg2015).
Fish biomass has been reported to be influenced by multiple factors. McClanahan et al. (Reference McClanahan, Maina, Graham and Jones2016), for example, showed fish biomass to be influenced by sea surface temperature (SST). According to Duffy et al. (Reference Duffy, Lefcheck, Stuart-Smith, Navarrete and Edgar2016), the influence of temperature on fish biomass depends on the diversity of fish assemblages; in low-richness fish communities, biomass increases at low temperatures and declines at high temperatures. In high-richness communities, in turn, fish biomass shows a weak linear increase with temperature. In addition to adversely impacting coral reefs, sedimentation has also been suggested to negatively affect reef fish communities. High suspended sediment loads have been associated to significantly longer larval phase duration; reduced settlement success, impacted predator–prey interactions, reduced growth rates and increased juvenile fish mortality (Wenger et al., Reference Wenger, McCormick, Endo, McLeod, Kroon and Jones2014 and references therein). Excess nutrients (eutrophication), in turn, can lead to hypoxia events. Due to the elevated rates of organic decomposition and reduced oxygen saturation levels of warmer and more saline waters, coral reefs are especially susceptible to these events. Hypoxia can have detrimental effects on fish community behaviour (e.g. increased ventilation, emigration) with concomitant increasing energy demand and reduced growth rates. Fish eggs and larvae are particularly affected due to their high oxygen requirements and limited ability to avoid low oxygen zones, resulting in reduced hatching success and larval survival rates (Wenger et al., Reference Wenger, Williamson, da Silva, Ceccarelli, Browne, Petus and Devlin2015). The structural complexity provided by corals is also of fundamental importance in structuring fish assemblages given it provides them with habitat, refuge and resources (Hixon & Beets, Reference Hixon and Beets1993; McCormick, Reference McCormick1994) and mediates interactions between predator and prey.
The complexity of coastal waters together with the high levels of pollution to which they are frequently subjected make research in these areas increasingly difficult. In the inshore zone of the Jakarta Bay−Thousand Islands reef system (Indonesia), the extremely low visibility and high levels of pollution have hindered traditional field-based research activities. Additionally, measuring water column quality parameters with the necessary frequency is expensive and time-consuming and depends on weather conditions. These limitations restrict proper assessment of a wide range of valuable information that, in turn, hinders proper management policies. Remote sensing can overcome some of these issues and, as a monitoring tool, can provide scientists and managers with critical information related to water quality. Understanding the influence of water quality parameters on the ecosystem will facilitate informed policy and management decisions (Álvarez-Romero et al., Reference Álvarez-Romero, Devlin, da Silva, Petus, Ban, Pressey, Kool, Roberts, Cerdeira-Estrada, Wenger and Brodie2013; Fabricius et al., Reference Fabricius, Logan, Weeks and Brodie2014; Wenger et al., Reference Wenger, Williamson, da Silva, Ceccarelli, Browne, Petus and Devlin2015). However, few studies have integrated remotely sensed data with compositional and/or abundance data of coral reef taxa.
Here, we investigated fish biomass at 16 reef sites along the pronounced on-to-offshore gradient of the Jakarta Bay−Thousand Islands reef system (hereafter referred to as JBTI). We related variation in fish biomass to locally measured substrate cover and remotely sensed data. The remotely sensed data focused on those aspects that may relate to important stressors for coastal coral reefs: eutrophication (chlorophyll-a concentrations), global warming (SST), total suspended sediments (remote sensing reflectance at 645 nm) and runoff (coloured dissolved organic matter index).
The main questions addressed with this study were (1) does the fish biomass of selected fish families vary in relation to the proximity to Jakarta? (2) Can the observed variation in fish biomass be attributed to sets of proxies for different types of disturbances, including reef structural parameters and satellite-derived parameters?
MATERIALS AND METHODS
Study site
This study is part of a larger series of studies assessing the historical impact of urbanization on coral reef environments adjacent to the major city of Jakarta. The JBTI reef complex is a valuable research location due to the high number of studies undertaken in this region (Ongkosongo & Sukarno, Reference Ongkosongo, Sukarno and Brown1986; Tomascik et al., Reference Tomascik, Suharsono, Mah and Ginsburg1993; de Vantier et al., Reference de Vantier, Suharsono, Tuti, Imanto, Ledesma and Soemodijhardjo1998; Rachello-Dolmen & Cleary, Reference Rachello-Dolmen and Cleary2007; Cleary et al., Reference Cleary, de Vantier, Giyanto, Manto, de Voogd, Rachello-Dolmen, Tuti, Budiyanto, Wolstenholme, Hoeksema and Suharsono2008; Cleary et al., Reference Cleary, Polónia, Renema, Hoeksema, Rachello-Dolmen, Moolenbeek, Budiyanto, Yahmantoro, Giyanto, Prud'homme van Reine, Hariyanto, Gittenberger, Rikoh and de Voogd2016; Cleary, Reference Cleary2017). Earlier research reported on various levels of pressure from human activities, including unsustainable fishing, coral mining, oil exploration, uncontrolled tourism, beach litter, sand dredging, anchor damage, resort construction and the discharge of industrial and domestic effluent in this coral reef system (Willoughby et al., Reference Willoughby, Sangkoyo and Lakaseru1997; Rees et al., Reference Rees, Setiapermana, Sharp, Weeks and Williams1999; Rachello-Dolmen & Cleary, Reference Rachello-Dolmen and Cleary2007; Rinawati et al., Reference Rinawati Koike, Koike, Kurumisawa, Ito, Sakurai, Togo, Saha, Arifin and Takada2012).
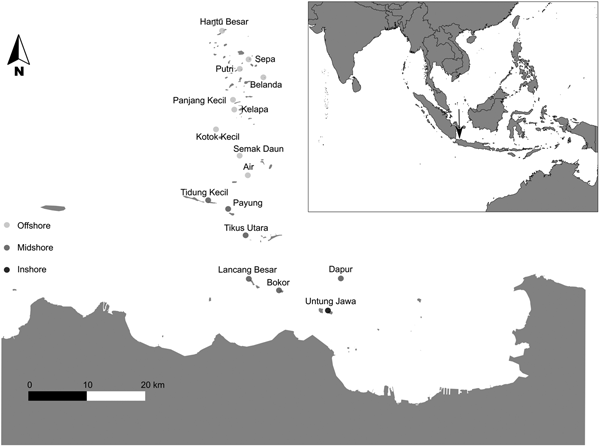
Quantitative data were collected in the JBTI reef complex. This complex extends more than 80 km north-west from Jakarta Bay (Figure 1). Jakarta is one of the largest urban environments in the world with more than 10 million people living in a 460 km2 area. Several rivers transport sewage and storm water over a 2000 km2 catchment area to the central sector of the bay (Rees et al., Reference Rees, Setiapermana, Sharp, Weeks and Williams1999). This central sector is defined by two flanking delta systems, both of which have a large sediment input (Rees et al., Reference Rees, Setiapermana, Sharp, Weeks and Williams1999). Data were collected by Naturalis Biodiversity Centre in 1985, 1995 and 2005 in this area. Most transect locations of the 1985, 1995 and 2005 surveys (Cleary et al., Reference Cleary, Suharsono and Hoeksema2006; Reference Cleary, de Vantier, Giyanto, Manto, de Voogd, Rachello-Dolmen, Tuti, Budiyanto, Wolstenholme, Hoeksema and Suharsono2008) were revisited.
Map of the research area with the survey locations: Inshore: Untung Jawa; Midshore: Dapur, Bokor, Lancang Besar, Tikus Utara, Payung and Tidung Kecil; Offshore: Air, Semak Daun, Kotok Kecil, Kelapa, Panjang Kecil, Belanda, Putri, Sepa and Hantu Besar. The inset in the top shows the location of Jakarta Bay–Pulau Seribu reef complex in South-east Asia, Indonesia.

Based on distance to the shore and geomorphologic and geographic characteristics, JBTI has been divided into three distinct shelf zones: inshore, midshore and offshore, representing an inshore-to-offshore gradient of anthropogenic disturbances (de Vantier et al., Reference de Vantier, Suharsono, Tuti, Imanto, Ledesma and Soemodijhardjo1998; Cleary et al., Reference Cleary, Suharsono and Hoeksema2006, Reference Cleary, de Vantier, Giyanto, Manto, de Voogd, Rachello-Dolmen, Tuti, Budiyanto, Wolstenholme, Hoeksema and Suharsono2008, Reference Cleary, Polónia, Renema, Hoeksema, Wolstenholme, Tuti and de Voogd2014, Reference Cleary, Polónia, Renema, Hoeksema, Rachello-Dolmen, Moolenbeek, Budiyanto, Yahmantoro, Giyanto, Prud'homme van Reine, Hariyanto, Gittenberger, Rikoh and de Voogd2016).
The inshore zone is located between the coast and 21 km (Cleary et al., Reference Cleary, de Vantier, Giyanto, Manto, de Voogd, Rachello-Dolmen, Tuti, Budiyanto, Wolstenholme, Hoeksema and Suharsono2008) and comprises the reefs within Jakarta Bay (e.g. Nyamuk Besar, Onrust, Bididari, Kelor, Ayer Besar, Damar Kecil and Untung Jawa). These reefs are in closer proximity to, and strongly affected by, the urbanized area of Jakarta. Environmental stressors related to urbanization include: reduced visibility caused by suspended terrigenous sediments, phytoplankton blooms due to increased nutrient concentrations, high concentrations of organic contaminants such as oils and hydrocarbons (de Vantier et al., Reference de Vantier, Suharsono, Tuti, Imanto, Ledesma and Soemodijhardjo1998; Rees et al., Reference Rees, Setiapermana, Sharp, Weeks and Williams1999; Farhan & Lim, Reference Farhan and Lim2012) and high concentrations of heavy metals (Williams et al., Reference Williams, Rees and Setiapermana2000). Based on data from the Regional Environment Agency BPLHD Jakarta, 13 rivers flowing from the south to Jakarta Bay bring at least 14,000 cubic metres of household and industrial effluents each day. Inshore reefs are also subjected to intense exploitation of marine resources and a range of damaging fishing practices (Rees et al., Reference Rees, Setiapermana, Sharp, Weeks and Williams1999; Jackson et al., Reference Jackson, Kirby, Berger, Bjorndal, Botsford, Bourque, Bradbury, Cooke, Erlandson, Estes, Hughes, Kidwell, Lange, Lenihan, Pandolfi, Peterson, Steneck, Tegner and Warner2001; Cleary et al., Reference Cleary, de Vantier, Giyanto, Manto, de Voogd, Rachello-Dolmen, Tuti, Budiyanto, Wolstenholme, Hoeksema and Suharsono2008; Green & Bellwood, Reference Green and Bellwood2009). In contrast to the current state, Umbgrove (Reference Umbgrove1939) recorded a diverse coral assemblage around the island of Nyamuk. Species assemblages that were historically common (e.g. Montipora digitata, M. foliosa and Acropora aspera) have seemingly disappeared. According to Cleary et al. (Reference Cleary, Polónia, Renema, Hoeksema, Wolstenholme, Tuti and de Voogd2014), there was still a small amount of Acropora present (1.8%) in this reef in 1985, which declined to 0.3% in 1995 and had disappeared by 2005. Furthermore, in 2005, only 3.8% of the cover recorded at Nyamuk consisted of live coral whereas 89% of the reef consisted of rubble, sand and algae. Tomascik et al. (Reference Tomascik, Mah, Nontji and Moosa1997) reported a drop in the water transparency of the most inshore reefs (e.g. those of Onrust and Kelor) from 1929 to 1993 and Cleary et al. (Reference Cleary, Polónia, Renema, Hoeksema, Wolstenholme, Tuti and de Voogd2014) reported an additional reduction in inshore water transparency from 1995 to 2005. In the present study, only Untung Jawa was sampled in the inshore zone due to the extreme levels of pollution at the other inshore locations and consequent health risks to divers (Rees et al., Reference Rees, Setiapermana, Sharp, Weeks and Williams1999).
The midshore zone is located between 22 and 40 km offshore from Jakarta (Cleary et al., Reference Cleary, de Vantier, Giyanto, Manto, de Voogd, Rachello-Dolmen, Tuti, Budiyanto, Wolstenholme, Hoeksema and Suharsono2008) and comprises the mid-region reefs (e.g. Dapur, Bokor, Lancang Besar, Tikus Utara, Payung and Tidung Kecil). Here, the influence of land-based pollution is less intense. However, during the South-east monsoon, the prevalent winds push the polluted plumes from Jakarta Bay over this zone (Cleary et al., Reference Cleary, Suharsono and Hoeksema2006).
The offshore zone is located more than 40 km offshore from Jakarta (Cleary et al., Reference Cleary, de Vantier, Giyanto, Manto, de Voogd, Rachello-Dolmen, Tuti, Budiyanto, Wolstenholme, Hoeksema and Suharsono2008) and consists of the outer-region reefs (Air, Semak Daun, Kotok Kecil, Kelapa, Panjang Kecil, Belanda, Putri, Sepa and Hantu Besar). This zone is minimally affected by land-based pollution associated with Jakarta city. However, other disturbances such as dredging activity, poison and blast fishing, outbreaks of the predatory Acanthaster planci and high temperatures associated with ENSO (El Niño Southern Oscillation) phenomena have been reported (de Vantier et al., Reference de Vantier, Suharsono, Tuti, Imanto, Ledesma and Soemodijhardjo1998; Vail & Thamrongnawasawat, Reference Vail, Thamrongnawasawat and Soemodijhardjo1998; Cleary et al., Reference Cleary, Suharsono and Hoeksema2006). The first marine park of Indonesia – Pulau Seribu National Marine Park – was established within this zone in 1982 (Djohani, Reference Djohani1994; Farhan & Lim, Reference Farhan and Lim2012; Cleary et al., Reference Cleary, Becking, de Voogd, Pires, Polónia, Egas and Gomes2013).
Sampling
A total of 16 sites were sampled in JBTI from 20 July to 20 August 2011 (south-east monsoon – ‘dry’ season; Rees et al., Reference Rees, Setiapermana, Sharp, Weeks and Williams1999) (Figure 1). In each site, three replicate 50 m belt-transects were laid parallel to the reef crest at ~5 m depth. All belt-transects were placed in the same direction (NW), separated by distances of 5–10 m. In order to minimize any observer bias, fish counts at all sites were performed by the same trained researcher. All individuals observed within 5 m on either side of the 50 m transect were identified to taxonomic groups at the family level and recorded. Each transect encompassed a total survey area of 500 m2 per transect and 1500 m2 per site. Both fish species abundance and size (total length in cm, TL) were estimated. Size categories of 2.5 cm were used for fish less than 10 cm in length, 5 cm categories were used for all larger fish, in line with Green & Bellwood (Reference Green and Bellwood2009). Because TL of the fish was estimated during the fieldwork, TL was converted into FL (fork length) in order to use the formula for weight estimates. For species with rounded or square tails, FL and TL were considered the same (Green & Bellwood, Reference Green and Bellwood2009). However, for species with forked tails, FL is ~90% of TL for most species (Kulbicki et al., Reference Kulbicki, Guillemot and Amand2005). Additionally, because size categories were used, fish lengths used for biomass estimates were the mid value for each size category (Green & Bellwood, Reference Green and Bellwood2009).
All individuals of species in the transect area from the reef substratum to the water surface were counted, and fish that had left and subsequently re-entered the transect area were not counted again (Hoey & Bellwood, Reference Hoey and Bellwood2008; Dickens et al., Reference Dickens, Goatley, Tanner and Bellwood2011). Length estimates were converted to biomass using known length-weight relationships for each species using the formula W = aLb (Kulbicki et al., Reference Kulbicki, Guillemot and Amand2005). Where: W = weight of the fish in grams (g); L = fork length (FL) of the fish in centimetres; a and b are biomass constants calculated for each family. The biomass constants used for each family were obtained from Appendix 2 of Green & Bellwood (Reference Green and Bellwood2009).
For the purpose of this study, we chose to focus on the eight most abundant families in terms of total biomass and distribution across the sites. These included the Acanthuridae (surgeonfishes), Apogonidae (cardinalfishes), Caesionidae (fusiliers), Chaetodontidae (butterflyfishes), Ephippidae (batfishes), Pomacentridae (damselfishes) and Labridae (wrasses) and the subfamily Scaridae (family Labridae; parrotfishes). According to molecular evidence (Westneat & Alfaro, Reference Westneat and Alfaro2005), the Scarinae have been widely considered as a subfamily of Labridae (Choat et al., Reference Choat, Herwerden, Robertson and Clements2012). However, due to their distinct feeding behaviour, the family Labridae and the subfamily Scarinae were analysed separately.
Predictor variables
In addition to the fish data, the cover of the following substrate cover classes was recorded during dive surveys: Acropora, branching coral, encrusting coral, foliose coral, massive coral, mushroom coral, submassive coral, dead coral with algae, dead coral, algae, rubble and sand. The cover of each class was recorded using the line-intercept transect method (English et al., Reference English, Bake and Wilkinson1997) along a 30 m transect placed at 3 and 5 m depth (the same depth as the fish transects; Cleary et al., Reference Cleary, Polónia, Renema, Hoeksema, Wolstenholme, Tuti and de Voogd2014). The line-intercept transect data were analysed in order to calculate the percentage cover of each class surveyed.
Due to its coastal nature, JBTI waters can be considered case II waters where the phytoplankton co-exists in similar concentrations with many other substances that are not directly related to it and thus vary in an independent way (Sathyendranath, Reference Sathyendranath2000). The contribution of all case II water constituents for the optical water leaving signal of JBTI coral reef waters demands a careful analysis in order to infer the weight of each one of them in the final magnitude of the signal (Richardson & LeDrew, Reference Richardson and Ledrew2006). A more detailed description of the satellite-derived parameters and the strategies used to diminish the estimation issues associated with satellite images can be found in Polónia et al. (Reference Polónia, Cleary, de Voogd, Renema, Hoeksema, Martins and Gomes2015). Four satellite-derived parameters were assessed for the study region using ocean colour satellite imagery: near-surface chlorophyll-a concentration (Chl-a), sea surface temperature (SST), remote sensing reflectance at 645 nm (Rrs_645) and coloured dissolved organic matter index (CDOM). These parameters were selected because they could be considered as proxies for eutrophication (Chl-a), warming sea temperatures (SST), riverine inputs (CDOM; Fichot et al., Reference Fichot, Kaiser, Hooker, Amon, Babin, Belanger, Walker and Benner2013) and total suspended sediments derived from land-based erosion (Rrs_645; Miller & McKee, Reference Miller and Mckee2004; Chen et al., Reference Chen, Hu and Muller-Karger2007). CDOM is largely composed of humic and fulvic substances resulting either from decaying plant material brought by land runoff in areas with high vegetation productivity or originating from mangroves and seagrasses (Carder et al., Reference Carder, Chen, Lee, Hawes and Kamykowski1999 in Martin, Reference Martin2004; Richardson & LeDrew, Reference Richardson and Ledrew2006); these absorb mostly in the blue spectrum which assign to the CDOM-dominated waters a dark yellow colour (Devlin et al., Reference Devlin, da Silva, Petus, Wenger, Zeh, Tracey, Álvarez-Romero and Brodie2013 and references therein). Depending on the mineral composition and concentration, sediment-dominated waters, have, in turn, a brown/beige colour due to the highly reflective nature of sediment particles in the red–infra-red wavelengths (Devlin et al., Reference Devlin, da Silva, Petus, Wenger, Zeh, Tracey, Álvarez-Romero and Brodie2013 and references therein).
Satellite-derived parameters were obtained using previously described methods (Polónia et al., Reference Polónia, Cleary, de Voogd, Renema, Hoeksema, Martins and Gomes2015). Briefly, Aqua Moderate Resolution Imaging Spectro-radiometer (MODIS-Aqua) Level 1A LAC (1 km resolution) data were obtained from the NASA Goddard Space Flight Centre through the Ocean Colour website (http://oceancolor.gsfc.nasa.gov/cgi/) and processed to Level 3 format using NASA's SeaWiFS Data Analysis System (SeaDAS version 7.0) software. Monthly mean values were generated for the previously mentioned satellite-derived parameters using the daily data values of June, July and August 2011 (months preceding our survey and with less cloud cover) and the values extracted (from each location) using the SeaDAS pixel extraction tool for window sizes of 5 × 5 pixels (mean). The main goal of this study was to use the remotely sensed variables as proxies of environmental patterns of variation, and not to quantitatively estimate the parameters. For quantitative estimation, several issues need to be resolved when working with coastal waters. For this reason, satellite-derived parameters were used as a qualitative proxy, and not to estimate the real values.
Analysis
All environmental (including satellite and substrate data) and biomass matrices were imported into R (R Core Team, 2015). Biomass and environmental data matrices were loge (x + 1) transformed and distance matrices constructed using the Euclidean index with the vegdist() function in the vegan package (Oksanen et al., Reference Oksanen, Kindt, Legendre, O'hara, Simpson, Solymos, Stevens and Wagner2009) in R. Spatial autocorrelation is defined as the tendency of neighbouring sites to be more similar (positive autocorrelation) or less similar (negative autocorrelation) to one another than expected for randomly selected sites (Legendre & Fortin, Reference Legendre and Fortin1989; Legendre, Reference Legendre1993). Spatial autocorrelation has been recognized as violating the assumption of independence of errors leading to biased variance estimates and inflating the probability of a type I error in hypothesis tests (Legendre & Fortin, Reference Legendre and Fortin1989). Autocorrelation is thus a potential problem for all spatial-based studies. Permutational regression was used to assess to what extent total fish biomass and the biomass of selected families (Acanthuridae, Apogonidae, Caesionidae, Chaetodontidae, Ephppidae, Pomacentridae, Labridae and the subfamily Scaridae) could be explained by environmental variables (Legendre et al., Reference Legendre, Lapointe and Casgrain1994). Firstly, triangular distance matrices containing pairwise Euclidean differences in biomass between pairs of sites were unfolded to vectors using a modified function in R of the dist2sym function found in Venables & Ripley (Reference Venables and Ripley2002). We used the forward.sel function of the packfor package (Jombart et al., Reference Jombart, Dray and Dufour2009), which selects significant explanatory variables based on a forward selection procedure and uses a permutation test to test for significant associations between variation in biomass and environmental variables. The forward selection test used was based on a novel forward selection procedure that corrects for inflated Type I error and overestimation of explained variance associated with classical forward selection (Blanchet et al., Reference Blanchet, Legendre and Borcard2008).
RESULTS
Total fish biomass and distribution across JBTI
In total, 16 locations (1500 m2 per location) were surveyed amounting to a total survey area of 24,000 m2 (2.4 hectares). A total of 5466 individuals assigned to 30 different families were counted (Table 1). The total number of individuals per family ranged from 1 (Zanclidae) to 2135 (Pomacentridae).
Total biomass (kg ha−1) sampled for all fish families per location. Untung Jawa (UnJ); Dapur (Dap); Bokor (Bok); Lancang Besar (LaB); Tikus (TkU); Payung (PaU); Tidung Kecil (TdK); Pulau Air (Air); Semak Daun (SeD); Kotok Kecil (KoK); Pulau Kelapa (Kpa); Panjang Kecil (Pan); Belanda NW (Bel); Putri Timor (Put); Sepa NW (SeB); Hantu Besar (HaB).

Only seven families were detected in the inshore zone. Lethrinidae was the family with highest biomass, followed by Pomacentridae, Centriscidae, Labridae, Nemipteridae, Pinguipedidae and Blenniidae. In contrast, only five families were not found in the midshore zone (Fistulariidae, Priacanthidae, Sphyraenidae, Zanclidae, Microdesmidae) and offshore zone (Dasyatidae, Haemulidae, Lethrinidae, Blenniidae, Pempheridae). There were however, families that were not found in the offshore zone but were detected in the inshore zone and midshore zone (Lethrinidae and Blenniidae) or only in the midshore zone (Dasyatidae, Haemulidae, Pempheridae).
The eight most abundant and widespread families (Table 2) accounted for 86.13% of total estimated biomass (1249.52 kg of 1450.76; see Table 1). The lowest estimated fish biomass (4.95 kg per hectare, ha) was recorded at Untung Jawa (closest to Jakarta). Semak Daun, located in the middle of JBTI, had the highest total estimated recorded biomass (193 kg ha−1) while the outermost locations had lower fish biomass. The families Labridae and Pomacentridae were the only families recorded at all 16 sites. The families Chaetodontidae and Scolopsidae were observed at 15 of the sites. Caesionidae followed by Labridae and Acanthuridae were the families with highest biomass while Pomacentridae followed by Apogonidae and Labridae were the most abundant ones.
Total number of individuals sampled per length and per location for the families Acanthuridae, Apogonidae, Caesionidae, Chaetodontidae, Ephppidae, Labridae, Pomacentridae, and the subfamily Scaridae. Untung Jawa (UnJ); Dapur (Dap); Bokor (Bok); Lancang Besar (LaB); Tikus (TkU); Payung (PaU); Tidung Kecil (TdK); Pulau Air (Air); Semak Daun (SeD); Kotok Kecil (KoK); Pulau Kelapa (Kpa); Panjang Kecil (Pan); Belanda NW (Bel); Putri Timor (Put); Sepa NW (SeB); Hantu Besar (HaB).

The family Acanthuridae was recorded at nine sites and biomass ranged from 1.50 kg ha−1 in Pulau Air (offshore zone; reef further south) to 37.98 kg ha−1 in Sepa (offshore zone; reefs further north). Acanthurid biomass was highest offshore and the family was absent or rare in sites closest to shore (Figure 2A). The family Apogonidae was recorded in 12 sites and biomass ranged from 1 kg ha−1 in Pulau Air (offshore zone; reef further south) to 29.48 kg ha−1 in Dapur (midshore zone reef further south). The family Chaetodontidae was recorded in 15 sites and biomass ranged from 0.39 kg ha−1 in Bokor (midshore zone) to 17.57 kg ha−1 in Sepa (offshore zone). Both these families were absent from the sites closest to shore, but present in moderate amounts at most other sites (Figure 2B, D).
Variation in fish family biomass for Acanthuridae (A), Apogonidae (B), Caesionidae (C) and Chaetodontidae (D).

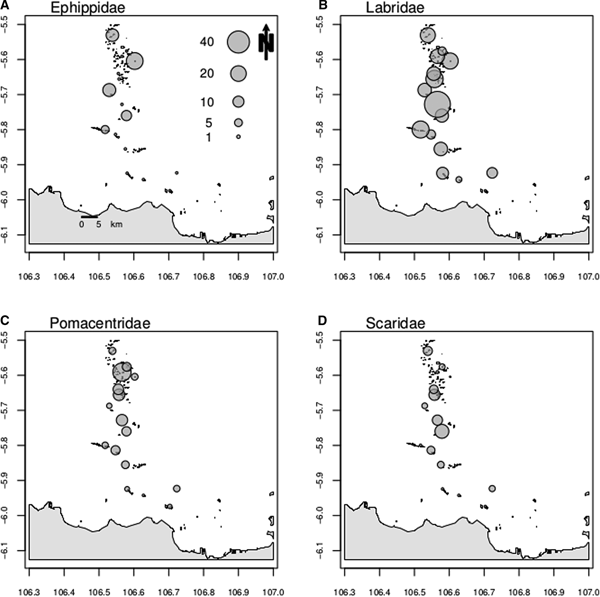
The family Caesionidae was recorded in 12 sites and biomass ranged from 4.99 kg ha−1 in Payung NW (midshore zone) to 72.7 kg ha−1 in Semak Daun (offshore zone). Caesonids were markedly more abundant offshore (Figure 2C). The family Ephippidae was recorded at five sites and biomass ranged from 5.22 kg ha−1 in Tidung Kecil (midshore zone) to 23.10 kg ha−1 in Belanda (offshore zone). The family was absent from sites closer to shore, and was sparse offshore (Figure 3A). The families Labridae and Pomacentridae were recorded at all 16 sites. Biomass of the former ranged from 0.42 kg ha−1 in Untung Jawa (inshore zone) to 55.30 kg ha−1 in Semak Daun (offshore zone), whilst the biomass of the latter ranged from 0.53 kg ha−1 in Bokor (midshore zone) to 27.33 kg ha−1 in Putri (offshore zone). Both families showed a decreasing biomass closer to shore (Figure 3B, C). The subfamily Scaridae was recorded at 12 sites and biomass ranged from 0.20 kg ha−1 in Belanda (offshore zone) to 15.92 kg ha−1 in Pulau Air (offshore zone). Scarids were largely absent from sites closer to shore (Figure 3D).
Variation in fish family biomass for Ephippidae (A), Labridae (B), Pomacentridae (C) and the subfamily Scaridae (D).

Remotely sensed and substrate cover variables
The satellite-derived proxies for environmental stressors indicated that the influence of eutrophication, total suspended sediments and sea surface temperature was generally higher inshore than offshore, while land runoff (coloured dissolved organic matter) did not show a clear inshore to offshore gradient.
With the exception of CDOM, all the satellite-derived parameters were generally higher inshore than offshore. CDOM was lowest at Untung Jawa (3.95) and highest at Hantu Besar (7.33) while Chl-a had the opposite pattern (lowest at Hantu Besar (0.08 mg m−3) and highest at Untung Jawa (1.18 mg m−3)). Rrs_645 was lowest at Hantu Besar (0.0005 sr−1) and highest at Semak Daun (0.004 sr−1) while SST was also lowest at Hantu Besar (29.8°C) but highest at Lancang Besar and Bokor (30.4°C).
CDOM was only a significant determinant of Pomacentridae biomass, but had no significant effect on any of the other groups, or on overall fish biomass patterns. SST only proved to be a significant predictor of Scaridae (Labridae subfamily) biomass and Rrs_645 was not a significant predictor for any fish family (Table 3).
Results of the forward selection procedure testing for significant associations between variation in biomass and environmental variables.

Variable: Explanatory variable; R 2: Variation explained by the explanatory variables; R 2-Cum: Adjusted cumulative variation explained by the explanatory variables; F: F-test statistic; P-value: significance of the variable.
Of the substrate cover variables, Acropora cover was lowest at Bokor (0.47 m) and highest at Kotok Kecil. Branching coral cover was lowest at Untung Jawa (0.18 m) and highest at Payung NW (38.6 m). Sand cover was lowest at Hantu Besar and Lancang Besar (0 m) and highest at Untung Jawa (13.8 m). Rubble cover was lowest at Payung (0 m) and highest at Bokor (50.7 m). Mushroom coral cover was lowest at Untung Jawa, Bokor, Dapur and Panjang Kecil (0 m) and highest at Belanda (2.46 m). Foliose coral cover was lowest at Bokor (0 m) and highest at Tikus (13.2 m). Submassive coral cover was lowest at Untung Jawa, Payung and Tidung Kecil (0 m) and highest at Hantu Besar (6.57 m). Massive coral cover was lowest at Payung (0.94 m) and highest at Pulau Air (10.1 m) and dead coral cover was lowest at Bokor (1.8 m) and highest at Pulau Kelapa (21.4 m).
The estimated biomass of acanthurids, chaetodontids and ephippids was significantly related to substrate cover variables (Table 3). Branching coral cover, foliose coral cover, and mushroom and submassive coral cover explained 8, 20.8 and 46.5% of the variation in the biomass of these three families, respectively (Table 3). Apogonid, caesionid, labrid, pomacentrid and scarid biomass were significantly related not only to substrate cover variables but also to remotely sensed variables. Apogonid biomass was significantly related to sand, Acropora and rubble cover and Chl-a, which together explained 34.6% of the variation in biomass. Branching coral and rubble cover and Chl-a together explained 59.9% of the variation in caesionid biomass. Labrid biomass was significantly related to Chl-a and branching coral cover, which together explained 27.1% of the variation in biomass. Algae, rubble and sand cover and CDOM index explained together 29.8% of the variation in pomacentrid biomass. Scarid biomass, in turn, was significantly related to massive and dead coral cover, Chl-a and SST, which together explained 40.0% of the variation in biomass (Table 3).
DISCUSSION
Coral reefs have been subjected to a range of anthropogenic disturbances that have changed their composition and functional characteristics. Coral reef fish can influence ecosystem processes and it is therefore critical to identify and protect them in already heavily degraded coral reef ecosystems. Here, we assessed fish biomass along the Jakarta Bay−Thousand Islands reef system and related variation in the biomass of selected fish families to substrate cover and remotely sensed data. The lowest fish biomass values were recorded in the most inshore sites (Untung Jawa; Bokor and Lancang Besar) while much higher biomass values were observed mid- and offshore. However, it should be noted that in the most inshore reef (Untung Jawa), the low visibility might have impaired the researcher's ability to detect fish. It should also be noted that the highest total biomass in our study was recorded in the site proximate to the offshore island of Semak Daun (193 kg ha−1). This may be attributed to the presence of a marine protected area, which may have favoured reef fish communities around the island by lowering fishing pressure. These results are in accordance with other studies that have shown fish abundance to decline with decreasing water quality (Fabricius et al., Reference Fabricius, De'ath, McCook, Turak and Williams2005; Mallela et al., Reference Mallela, Roberts, Harrod and Goldspink2007) and to be lower at inshore reefs compared to offshore reefs (Letourneur et al., Reference Letourneur, Kulbicki and Labrosse1998; Johansson et al., Reference Johansson, van de Leemput, Depczynski, Hoey and Bellwood2013).
Our suite of predictor variables explained 8.2–59.9% of the spatial variation in fish biomass. This suggests that different fish families respond to different environmental conditions. Our analyses showed that eutrophication, as indicated by Chl-a concentrations, was by far the most important determinant of spatial variation in fish biomass in terms of remotely sensed environmental variables. The fact that CDOM, SST and Rrs_645 were significant predictors of the biomass of only one or none of the studied fish families suggests that land runoff, temperature, and suspended sediments are, on their own, weak determinants of fish biomass in the Pulau Seribu reef complex when compared with the other studied variables.
There are, however, some local scale variables that also need to be taken into consideration. For example, the Chl-a and Rrs_645 values were higher in Semak Daun (further offshore) than in Tidung Kecil (further inshore). This may reflect local impacts due to island populations without a proper sewage treatment system. These results are in line with Baum et al. (Reference Baum, Januar, Ferse and Kunzmann2015) who analysed the spatial impact of anthropogenic stressors at local and regional scales in JBTI coral reefs. The authors surveyed eight reefs along the JBTI reef complex and suggested that the impact of urbanization is essentially restricted to inshore reefs. The authors also verified a high spatial variability in reef condition among sites referring to the importance of localized anthropogenic effects and suggested that these stressors are more important in shaping the spatial structure of reefs than regional stressors. This high variability of reef conditions along JBTI highlights the importance of sampling a larger number of reefs.
Chlorophyll-a was the most important predictor of total fish and Labridae (carnivorous) biomass. It was also a significant predictor for the fish subfamily Scaridae (herbivorous) and the fish families Apogonidae (planktivorous, carnivorous) and Caesionidae (planktivorous). Williams et al. (Reference Williams, Baum, Heenan, Hanson, Nadon and Brainard2015) found an increase of planktivore and piscivore fish biomass with higher Chl-a concentrations, suggesting that highly productive waters sustained large numbers of planktivores which, in turn, sustained large numbers of piscivores. The opposite, however, was the case in the present study, with highest biomass at lower Chl-a values (offshore). This may result from the fact that in JBTI, Chl-a is likely not driven by natural processes but instead by anthropogenic nutrients, which increases the levels of Chl-a to levels beyond which fishes are able to cope. The highly eutrophic coastal waters of JBTI may thus be one of the causes for the coral-depauperate reef communities that were found in the inshore reefs (Tomascik et al. Reference Tomascik, Suharsono, Mah and Ginsburg1993, Reference Tomascik, Mah, Nontji and Moosa1997). Although high Chl-a can benefit certain functional groups, very high Chl-a concentrations are reported to reduce hard coral cover, which may be detrimental to reef fishes that depend on coral as a structural part of their habitat. The high levels of Chl-a found in the most inshore reefs may exert an indirect influence over fish biomass through habitat destruction. This is supported by the strong influence of the substrate cover variables used in the present study in structuring spatial variation in fish biomass. With the exception of the families Acanthuridae and Labridae (8%), substrate variables explained 20–47% of fish family biomass.
The decline of fish densities (a top-down factor) has sometimes been suggested as one of the main causes of habitat loss, and has inhibited coral reef recovery (Hughes et al., Reference Hughes, Rodrigues, Bellwood, Ceccarelli, Hoegh-Guldberg, McCook, Moltschaniwskyj, Pratchett, Steneck and Willis2007; Rasher et al., Reference Rasher, Engel, Bonito, Fraser, Montoya and Hay2012). However, some other studies have shown that, for some fish species, substrate is instead a determinant of their density (bottom-up factor) and not the other way around (Russ et al., Reference Russ, Questel, Rizzari and Alcala2015). Several studies have recognized the role of structural complexity in structuring fish assemblages (e.g. Hixon & Beets, Reference Hixon and Beets1993; McCormick, Reference McCormick1994; Jones et al., Reference Jones, McCormick, Srinivasan and Eagle2004; Wilson et al., Reference Wilson, Fisher, Pratchett, Graham, Dulvy, Turner, Cakacaka, Polunin and Rushton2008). Jones et al. (Reference Jones, McCormick, Srinivasan and Eagle2004) reported a decline in fish biodiversity after a marked decline in coral cover regardless of fisheries policies. Studies in protected reserves reported that structural complexity was associated with increased fish biomass and abundance (Rogers et al., Reference Rogers, Blanchard and Mumby2014). According to Wilson et al. (Reference Wilson, Fisher, Pratchett, Graham, Dulvy, Turner, Cakacaka, Polunin and Rushton2008) the abundance of branching Acropora species is not only directly linked to the abundance of coral-feeding species, but also to the abundance of damselfish species (by altering the reef structural complexity). Baum et al. (Reference Baum, Januar, Ferse and Kunzmann2015), in a recent study in JBTI, also reported a high correlation between fish and benthic community composition, pointing out that the cover of acroporid, non-acroporid and dead corals could be linked to almost 90% of the variability in fish community composition. The cover of total live coral and branching coral has been shown to contribute to the physical three-dimensional structure of the ecosystem (Graham & Nash, Reference Graham and Nash2013). Different coral forms contribute to habitat complexity and offer distinct functional uses to reef fishes (Kerry & Bellwood, Reference Kerry and Bellwood2012). Despite providing a lower habitat complexity when compared with Acropora spp., massive corals, for example, are also used by small reef fishes like Pomacentridae as refuges (Precht et al., Reference Precht, Aronson, Moody and Kaufman2010). Similarly, in Kimbe Bay, Papua New Guinea, apogonids were strongly associated with live scleractinian corals, and more specifically with branching forms, which they used for resting (Gardiner & Jones, Reference Gardiner and Jones2005). These studies show that if reef structural complexity deteriorates due to urban pressure, this may lead to indirect detrimental effects on reef fish communities as well.
In our study, substrate cover variables (live coral, dead coral, rubble, sand and algae cover) were significant predictors of fish biomass. However, as mentioned earlier, these variables themselves can be impacted by the water quality variables analysed in the present study. The families Acanthuridae (branching coral), Apogonidae (Acropora; sand, rubble), Caesionidae (branching coral; rubble), Chaetodontidae (foliose coral), Ephippidae (mushroom and submassive coral), Pomacentridae (algae, sand and rubble), Labridae (branching coral) and the subfamily Scaridae (massive coral, dead coral) were all associated with substrate cover variables. This contrasts with Graham et al. (Reference Graham, Pratchett, McClanahan and Wilson2013), who only found significant relationships between fish biomass and increasing structural complexity for the families Pomacanthidae and Pomacentridae and for the subfamily Scaridae but not for the families Acanthuridae, Chaetodontidae and Labridae. Madduppa et al. (Reference Madduppa, Ferse, Aktani and Palm2012) showed that different fish species were particularly associated with specific habitat types in JBTI: the subfamily Scaridae was predominantly found associated with massive corals, while Apogonidae were only observed in branching Acropora coral sites. Likewise, members of the subfamily Scaridae were shown to preferentially feed on algae found on massive Porites species (Bonaldo & Bellwood, Reference Bonaldo and Bellwood2011; Welsh et al., Reference Welsh, Bonaldo and Bellwood2014). This is in line with our results showing a significant relationship between the apogonid biomass and Acropora cover and between scarid biomass and massive coral cover. For pomacentrids, in turn, algal cover was the main predictor of variation in biomass. Despite also feeding on plankton, pomacentrids have been considered important herbivores on coral reefs (Ceccarelli et al., Reference Ceccarelli, Jones and McCook2005). Vitelli et al. (Reference Vitelli, Hyndes, Kendrick and Turco2015) reported red foliose and filamentous algae as the main diet items of the damselfish Parma mccullochi, highlighting the important role of this family in altering algal assemblages in tropical systems. Previous studies suggested that the parrotfish community is bottom-up controlled by the benthic habitat structure. Members of the subfamily Scaridae were shown to be more abundant in reefs with high dead coral cover (Russ et al., Reference Russ, Questel, Rizzari and Alcala2015). Here, parrotfish biomass was also significantly related to dead coral cover and parrotfish were largely absent from inshore sites. Most of the reported dead corals were classified as ‘dead coral with algae’, which may justify the importance of this variable in structuring the biomass of this herbivorous family. The higher cover of dead coral on offshore reefs when compared with inshore reefs may seem contradictory, however, the inshore reefs were almost completely dominated by rubble and sand with very low percentages of coral cover (dead or alive). The lack of food resources in inshore reefs, due to the pollution rates reported for this zone (Rees et al., Reference Rees, Setiapermana, Sharp, Weeks and Williams1999; Jackson et al., Reference Jackson, Kirby, Berger, Bjorndal, Botsford, Bourque, Bradbury, Cooke, Erlandson, Estes, Hughes, Kidwell, Lange, Lenihan, Pandolfi, Peterson, Steneck, Tegner and Warner2001; Farhan & Lim, Reference Farhan and Lim2012), may thus have led to the migration of parrotfish to offshore reefs. Overfishing (parrotfish are important fishery targets) may also play a role. However, some studies have pointed to overexploitation as a secondary factor in influencing fish abundances at inshore reefs. In a study assessing the potential functional redundancy of herbivore fishes, Johansson et al. (Reference Johansson, van de Leemput, Depczynski, Hoey and Bellwood2013) revealed that, despite negligible fishing activities in the studied reefs, herbivore abundances were lower at inshore reefs. The authors suggested that this resulted in lower functional redundancy of these reefs and, consequently, higher vulnerability to disturbances. Additionally, in a recent study, Baum et al. (Reference Baum, Kusumanti, Breckwoldt, Ferse, Glaser, Adrianto, van der Wulp and Kunzmann2016) conducted a series of questionnaire surveys in 15 coastal communities of JBTI; the most referred-to reason for the observed marine species declines differed between island and mainland inhabitants. On the islands overexploitation (24.7%), pollution (23.9%) and tourism (22.3%) were the most mentioned cause for marine species decline while on the mainland pollution (27.8%), overexploitation (19.5%) and poor enforcement (18.0%) were the most referred-to reasons.
The study of coral reefs is hampered by the simultaneous occurrence of a multitude of stressors with interactive (additive, synergistic and antagonistic) and cumulative effects. The limited number of field studies analysing multiple cumulative stressors (Crain et al., Reference Crain, Kroeker and Halpern2008) is illustrative of the complexities involved in such studies. As such, there are additional potential stressors that may be impacting reefs in JBTI that were not measured in the present study. The main goal of the present study was to analyse cross-shelf variation in fish biomass and relate this variation to easily accessible remotely sensed environmental variables and variation in substrate type. Changes in total fish biomass and the biomass of selected families were observed with increasing distance from Jakarta. We have shown that distinct fish families respond differently to variation in substrate cover and remotely sensed variables. Furthermore, our study identified eutrophication as an important determinant of fish biomass (with high levels of eutrophication leading to low fish biomass). This shows the importance of satellite-derived as a tool to predict variation in fish family and water quality. Additionally, degradation of the reef structure, leading to loss of structural complexity was associated with lower fish biomass. Overall, the study showed a very low biomass of fishes in inshore reefs and an increasing fish biomass as the distance from Jakarta increased, indicating a clear effect of urbanization. Inshore reefs were those where anthropogenic perturbations have caused most damage, both in terms of coral cover and fish abundance. Further complementary studies involving the study of a larger number of cumulative and interacting stressors are needed to better understand and protect coral reef fish communities.
ACKNOWLEDGEMENTS
The research permit (6a/TKPIPA/FRP/SM/VI/2011) was issued by the Indonesian State Ministry of Research and Technology (RISTEK). We thank Y. Tuti (PPO-LIPI), Estradivari, W. Renema and E. Dondorp for their help in the field.
FINANCIAL SUPPORT
Research was funded by the Portuguese Foundation for Science and Technology, FCT, under the project LESS CORAL, PTDC/AAC-AMB/115304/2009 and a PhD Fellowship SFRH/BD/33391/2008. Thanks are also due for the financial support to CESAM (UID/AMB/50017), to FCT/MEC through national funds, and the co-funding by the FEDER, within the PT2020 Partnership Agreement and Compete 2020.