
Introduction
Si-based materials can store up to 2.8 times the amount of lithium per unit volume as graphite, making them highly attractive for use as the negative electrode in Li-ion batteries.[Reference Obrovac and Chevrier1, Reference Larcher, Beattie, Morcrette, Edström, Jumas and Tarascon2] Si-TiN alloys for Li-ion battery negative electrodes were introduced by Kim et al. in 2000.[Reference Kim, Kumta and Blomgren3] These alloys were made by high-energy ball milling Si and TiN powders in Ar(g). The cycling performance of Si(TiN)0.5 shown by Kim et al.[Reference Kim, Kumta and Blomgren3] (1100 Ah/L, 20 cycles, no fade) was impressive for the time, especially considering that no advanced binders or electrolyte additives were used. This alloy composition combines high volumetric capacity Si with TiN, which is a metallic conductor. We have recently shown that TiN is also remarkably inert towards reactions with the electrolyte at the negative electrode.[Reference Yan and Obrovac4] These properties of TiN may contribute to the good performance of Si-TiN alloys reported by Kim et al. in Ref. Reference Kim, Kumta and Blomgren3. TiN also has a high melting point (~3300°C),[Reference Price, Borland and Selbrede5] which may confer high thermal stability to Si-TiN alloys. This could make them compatible to carbon coating by chemical vapor deposition (CVD), which has been shown to enhance alloy cycle life.[Reference Kasukabe, Nishihara, Iwamura and Kyotani6] Unfortunately, industrial production of TiN is costly.[Reference Toth7] TiN is made industrially by nitriding titanium oxide in the presence of carbon, nitriding titanium halides or hydrides with H2(g)/N2(g) or NH3(g), or the direct nitriding of Ti metal with NH3(g).[Reference Price, Borland and Selbrede5, Reference Toth7, Reference Shin, Hong and Uhm8] All these reactions occur at high temperatures (>1000°C) and can use expensive precursors, making commercially produced TiN expensive.[Reference Shin, Hong and Uhm8] In addition, the capacities demonstrated by Kim et al. were low. Although a 1000 Ah/L volumetric capacity was claimed, their calculation did not include the volume expansion of Si.[Reference Kim, Kumta and Blomgren3] Taking volume expansion into account, only 860 Ah/L was achieved, which is likely too small to be of practical benefit in Li-ion cells.[Reference Obrovac and Chevrier1] Possibly for these reasons, Si-TiN alloys have received little attention since the publication of Kim et al. However, such alloys would be highly attractive if they could be made more economically and with a greater Si content, to increase their volumetric capacity.
In 1997, Chin and Peng reported that TiN powder could be made inexpensively by ball milling titanium powder in a nitrogen atmosphere.[Reference Chin and Perng9] This suggested to us that Si-TiN alloys might be made inexpensively by ball milling Ti with an excess of Si in N2(g). However, Si3N4 can also form when Si is ball milled in N2(g),[Reference Calka, Williams and Millet10] and TiSi2 is formed when Ti and excess Si are ball milled together.[Reference Wang, Cao, Kalinina, Zheng, Li, Zhu and Obrovac11, Reference Yan, Oehring and Bormann12] These past results suggest three competing reactions during ball milling Ti with an excess of Si in N2(g) (here, a Si:Ti 85:15 atomic ratio is used as an example):
 $$\hbox{Ti(s)}\buildrel {{\rm N}_2({\rm g})} \over \longrightarrow \hbox{TiN(s)}$$
 $$\hbox{Si(s)} \buildrel {{\rm N}_2({\rm g})} \over \longrightarrow \hbox{Si}_3\hbox{N}_4(\hbox{s})$$
 $$\hbox{85Si(s)} +\hbox{15Ti(s)} \buildrel {{\rm N}_2({\rm g})} \over \longrightarrow \hbox{55Si(s)} + \hbox{15TiSi}_2({\rm s})$$
According to the ternary N-Si-Ti phase diagram, as generated by the Materials Project[Reference Jain, Ong, Hautier, Chen, Richards, Dacek, Cholia, Gunter, Skinner, Ceder and Persson13–Reference Jain, Hautier, Ong, Moore, Fischer, Persson and Ceder15] and shown in Fig. S1, equilibrium compositions with excess Si should not form Si-TiN alloys. Instead, 3-phase Si3N4–TiSi2–Si coexistence exists in this region.
Here it will be shown that, contrary to thermodynamics, simply ball milling Ti and excess Si mixtures in nitrogen results in the formation of Si-TiN alloys with high Si content and high volumetric capacities. Moreover, TiSi2 ball milled in nitrogen was even found to decompose to form Si-TiN alloys. These alloys were found to have a finer microstructure, higher thermal stability, and superior performance in lithium batteries compared to alloys made by ball milling Si and TiN directly.
Experimental
To ball mill samples in N2(g), a high-energy ball mill (SPEX Model 8000-D, Spex CertiPrep, Metuchen, NJ) was placed in a N2-filled glove box. 65 mL hardened steel vials (also from Spex CertiPrep) were used in milling containers. All powders were loaded and all ball milling was conducted in the N2-filled glove box which contained the ball mill. Free access of ambient N2 gas into and out of the milling vial during the milling process was accomplished by removing the o-ring seal of the vial and drilling a 0.125 inch hole into the vial clamping ring, as shown in Fig. S2. Using this set-up, Si-Ti-N alloys were synthesized by ball milling under constant 1 bar pressure N2(g), 0.5 mL total (according to bulk densities) of various ratios of Si powder (Sigma Aldrich, 325 mesh, 99%) and Ti powder (−325 mesh, 99% metals basis from Alfa Aesar) with 180 g of 0.125″ stainless-steel balls. This powder and ball loading is optimized for rapid milling with little iron contamination.[Reference Hatchard, Genkin and Obrovac16] A sample was also made by ball milling 0.5 mL of TiSi2 powder (Alfa Aesar, 99%) in N2 gas under the same conditions. Unless otherwise stated, all alloys were ball milled for 16 h.
X-ray diffraction (XRD) patterns were measured using a Rigaku Ultima IV diffractometer equipped with a Cu Kα x-ray source and a graphite diffracted beam monochromator. Each XRD scan was collected from 10° to 60° 2-theta in 0.05° increments for 3 seconds per step. Single point BET measurements were conducted using a Micromeritics FlowSorb ΙΙ 2300 using a nitrogen/helium gas mixture (28.6% N2). Samples were degassed at 150°C for 30 min to remove moisture before the measurement. True sample densities were measured with He gas using a Micromeritics AccuPyc II 1340 gas pycnometer. Nitrogen and oxygen contents were determined by the LECO method (NSL Analytical Services, Inc, Cleveland, OH). Scanning electron microscope (SEM) images were measured using a TESCAN MIRA 3 LMU Variable Pressure Schottky field emission scanning electron microscope. Transmission electron microscopy (TEM) images were taken using a Philips CM30 TEM. TEM specimens were made by suspending sample powders in methanol, sonicating 10 min, and placing a drop onto a lacey carbon-coated TEM grid.
Electrode slurries were prepared by mixing Si-Ti-N alloys, carbon black (Imerys Graphite and Carbon, Super C65) and a 10 wt.% aqueous solution of lithium polyacrylate (LiPAA) with a volumetric ratio of 70/5/25 in distilled water. Slurries were mixed for 1 h using a Retsch PM200 planetary mill at 100 rpm with three 13 mm tungsten carbide balls, spread onto copper foil (Furukawa Electric, Japan) with a 0.004 inch gap coating bar, and dried in air for 1 h at 120°C. This resulted in a typical electrode loading of 1 mg of active alloy per square centimeter and an average coating thickness of 15 µm. Circular working electrodes, 1.35 cm2 in area were cut from the coated foils using a circular punch.
Electrodes were assembled in 2325-type coin cells with a lithium foil counter/reference electrode. Two layers of Celgard 2300 separator were used in each coin cell. 1 M LiPF6 (BASF) in a solution of ethylene carbonate, diethyl carbonate and monofluoroethylene carbonate (volume ratio 3:6:1, all from BASF) was used as electrolyte. Cell assembly was carried out in an Ar-filled glove box. Cells were cycled galvanostatically at 30.0 ± 0.1°C between 5 mV and 0.9 V using a Maccor Series 4000 Automated Test System at a C/20 rate for the 1st cycle and a C/5 rate for the following cycles. To simulate the “constant current constant voltage” (CCCV) cycling protocol used in commercial cells, after each discharge (lithiation) cells were held at 5 mV until the current dropped to a C/40 rate during the first cycle and to a C/20 rate during subsequent cycles prior to commencing the next charge step. Here, C-rate is the current required to fully charge or discharge cells in 1 h and was calculated based on the amount of Si in the alloy and its theoretical capacity of 3578 mAh/g.[Reference Obrovac and Christensen17] All specific capacities were calculated with respect to the weight of the Si-alloy in the electrode.
Results and discussion
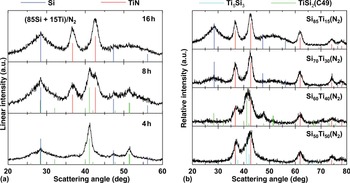
Figure 1(a) shows XRD patterns of Si and Ti ball milled in a 85:15 molar ratio under N2(g) for 4, 8, and 16 h. After milling 4 h, the XRD pattern is composed of amorphous Si and the C49 TiSi2 phase, which is a metastable phase of TiSi2 formed by ball milling.[Reference Wang, Cao, Kalinina, Zheng, Li, Zhu and Obrovac11] In addition, a small amount of intensity is present at about 37°, which is consistent with the (111) reflection of TiN. After 8 h milling, the TiSi2 peaks reduce in intensity and peaks from TiN increase in intensity. After 16 h milling only peaks from amorphous Si and nanocrystalline TiN are present. This sample is denoted here as Si85Ti15(N2). The TiN grain size of Si85Ti15(N2) is about 5 nm. This sample was found to contain 13 at.% nitrogen and 8 at.% oxygen, according to LECO analysis. This corresponds to a composition of Si67Ti12N13O8. The oxygen in Si85Ti15(N2) likely comes from the large oxygen impurity in the Si precursor powder, which was measured to be 8 at.%.[Reference Wang, Cao, Kalinina, Zheng, Li, Zhu and Obrovac11] The XRD pattern and the nearly equal amounts of nitrogen and titanium in the alloy suggest full reaction of the Ti with the ambient N2(g) during ball milling to form TiN. No evidence of Si3N4 is present in any of the XRD patterns. These results suggest that reaction (1) is kinetically favored during the milling process, resulting in the initial formation of TiSi2. With continued milling, the TiSi2 phase reacts with N2 accordingly to form TiN. Therefore, we believe the complete reaction of Si and Ti powders ball milled in N2(g) may be represented by
 $${\rm Step}\,\, 1\,\,: \,\,\hbox{85Si(s)} + \hbox{15Ti(s)} \buildrel {{\rm N}_2({\rm g})} \over \longrightarrow \,\,\hbox{55Si(s)} + \hbox{15TiSi}_2({\rm s})$$
 $${\rm Step}\,\,2\,\,: \hbox{55Si(s)} + \hbox{15TiSi}_2({\rm s}) \buildrel {{\rm N}_2({\rm g})} \over \longrightarrow \hbox{85Si(s)} +\hbox{15TiN(s)}$$
where again a 85:15 Si:Ti mole ratio is used as a representative example. This reaction is contrary to what is predicted by thermodynamics, as shown in Fig. S1. To confirm this reaction, TiSi2 powder was ball milled under N2(g) for 16 h. This also resulted in the formation of a phase-pure Si-TiN alloy with an identical XRD pattern, as shown in Fig. 1(a). These results emphasize the non-equilibrium character of the ball milling process. For comparison, a Si-TiN alloy was made by ball milling Si and TiN powders in a 85:15 molar ratio under Ar gas. This sample is denoted Si85(TiN)15(Ar). The XRD pattern of Si85(TiN)15(Ar) is shown in Fig. S3, and, similar to Si85(TiN)15(N2), the XRD pattern comprises amorphous Si and TiN, however the grain size of TiN is much larger (11.3 nm). This shows that under the same conditions, TiN may be made with a smaller grain size by forming it in-situ via the reaction of Ti and Si with N2(g) rather than ball milling TiN directly with Si.
(a) XRD patterns of Si and Ti powder in an 85:15 atomic ratio ball milled in N2(g) for 4, 8, and 16 h. (b) XRD patterns of different atomic ratios of Si and Ti powders after ball milling in N2(g) for 16 h.

Figure 1(b) shows XRD patterns of Si-Ti(N2) alloys made by ball milling different ratios of Si and Ti powders in N2(g) for 16 h. When the Si content is high (>60%), only amorphous Si and nanocrystalline TiN are apparent in the XRD pattern. Elemental analysis results in Table I show that these samples have a Ti:N ratio of nearly 1:1, confirming that they consist of Si and TiN phases. The XRD pattern of the Si60Ti40(N2) sample shown in Fig. 1(b) consists of Si, TiN and TiSi2 and the Ti:N atomic ratio is about 2:1, according to Table I. This indicates an incomplete reaction according to Eq. (3). We believe that a high content of ductile Ti during the initial stages of milling reduces the ball milling reaction kinetics, requiring long milling times. This will be further described in a subsequent publication. The XRD pattern of the Si60Ti40(N2) sample shown in Fig. 1(b) consists of TiN and some additional intensity near 42°. This peak appears at lower angle than the main peak of TiSi2. We speculate that this peak is from the formation of Ti5Si3. No XRD peaks are present for Si in this sample.
Compositions, specific surface areas and bulk densities of Si-Ti-N alloys made by ball milling different atomic ratios of Si and Ti powders in N2 for 16 h. The compositions are based on the initial Si and Ti content in the mill and the N and O contents as determined by LECO analysis.

Figure 2 shows SEM images of the alloys listed in Table I. As the Ti content increases, the average particle size increases from about 0.5 µm for Si85Ti15(N2) to large flakes up to 15 µm in extent for Si60Ti40(N2). The large Si60Ti40(N2) particle size results from the increased content of ductile Ti during the initial stages of milling. Commensurate with the increased particle size, the surface area reduces substantially from 18 m2/g for Si85Ti15(N2) to 4.43 m2/g for Si60Ti40(N2). Such low surface area could be advantageous for lowering the amount of surface reactions with electrolyte, when such alloys are used in Li cells.
SEM images of (a) Si85Ti15(N2), (b) Si70Ti30(N2), and (c) Si60Ti40(N2).

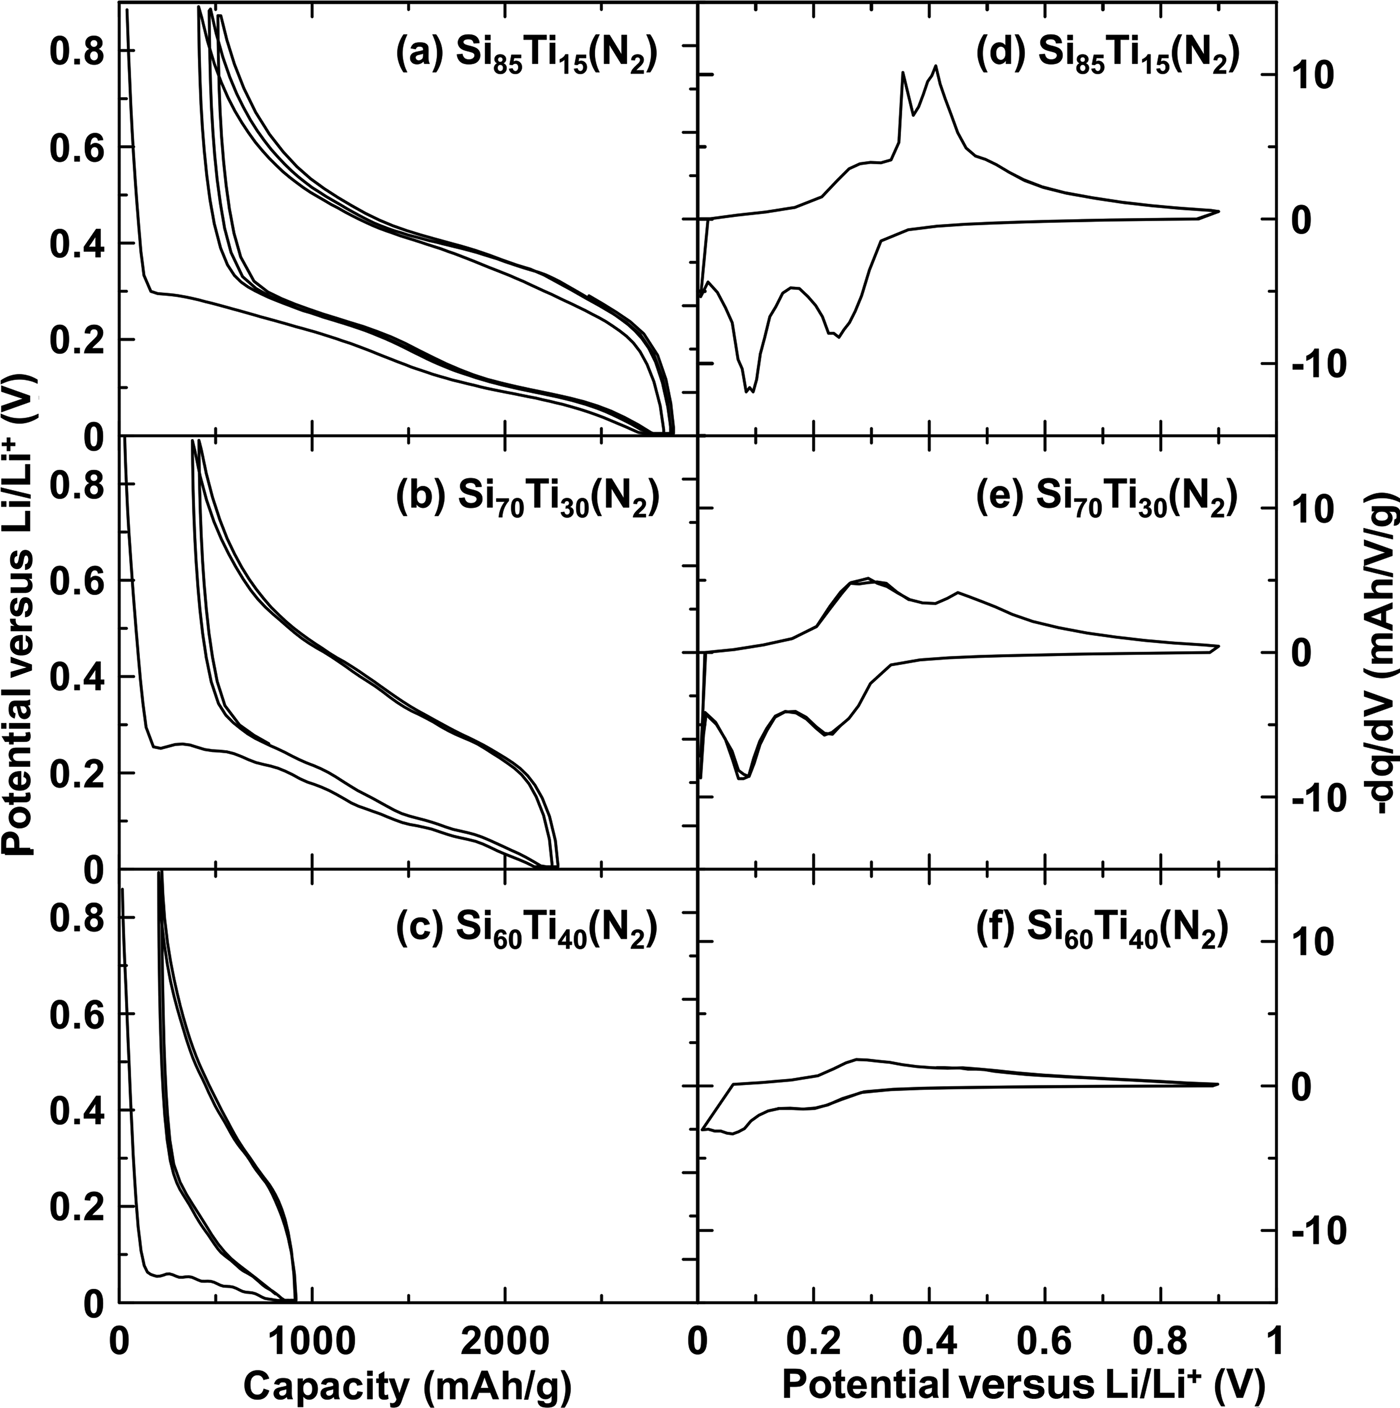
The potential versus capacity and differential capacity curves of Si-Ti(N2) alloys are shown in Fig. 3. Each is characteristic of Si-inactive alloys where the formation of Li15Si4 (which would be indicated by an anodic peak in the differential capacity at about 0.45 V) is suppressed by the presence of an inactive phase.[Reference Du, Hatchard, Dunlap and Obrovac18] Li15Si4 formation can only be detected in the differential capacity of the highest Si-containing alloy, Si85Ti15(N2), as the peaks near 0.45 V in Fig. 3(d). The reversible capacities of the Si85Ti15(N2) (2411 mAh/g) and Si70Ti30(N2) (1865 mAh/g) are close to what are predicted theoretically (2184 and 1678 mAh/g, respectively) for the compositions of these samples given in Table I, assuming that they consist of active Si (3578 mAh/g) and inactive SiO2 and TiN phases. These reversible capacities correspond to 2089 and 1957 Ah/L, respectively. The Si60Ti40(N2) sample has greatly reduced capacity because of its large inactive TiSi2 content, which removes active Si from the alloy. Nevertheless, the volumetric capacity of this sample is still high (1371 Ah/L). The Si50Ti50(N2) sample is not shown in Fig. 3 since it was found to have almost no capacity, consistent with is very low active Si content.
(a–c) Potential versus capacity curves and (d–f) associated differential capacity curves for Si-Ti(N2) alloys with different compositions, as indicated.

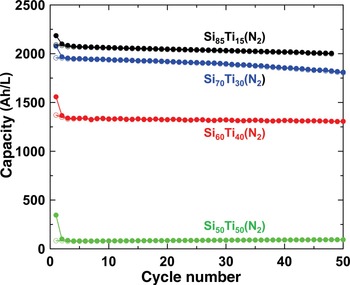
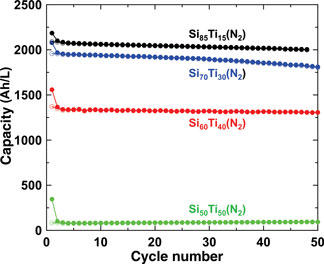
The cycling performance of these alloys are shown in Fig. 4 in terms of volumetric capacities. Here, the volumetric capacities were calculated at full alloy volume expansion as described in Ref.Reference Obrovac, Christensen, Le and Dahn19 using measured bulk densities, which are listed in Table I. Excellent cycling performance is shown over the 50 cycles for all the materials, although with some fade shown for the Si70Ti30(N2) sample. The initial coulombic efficiency (ICE) of these alloys is also impressive, ranging from 78% for Si70Ti30(N2) to 85% for Si85Ti15(N2). These samples have much higher capacities (more than double) than that demonstrated by Kim et al. in Ref.Reference Kim, Kumta and Blomgren3 (~300 mAh/g).
Cycling performance of Si-Ti(N2) alloys with different compositions, as indicated, in terms of volumetric capacity.

Figures S4(a)–S4(c) show the potential versus capacity curve, differential capacity and cycling performance of Si85(TiN)15(Ar), respectively. In contrast to the Si85Ti15(N2) sample, a large 0.45 V plateau is present in the Si85(TiN)15(Ar) potential versus capacity curve during delithiation, with a large corresponding peak in the differential capacity. This indicates that the inactive TiN phase is not effective in suppressing Li15Si4 formation in the sample milled in Ar(g). This is likely due to the larger grain size of the TiN phase in the Si85(TiN)15(Ar) sample, which may result in less contact area with active Si. Figure S4(c) shows that this sample undergoes severe fade during cycling, which is often synonymous with Li15Si4 formation.[Reference Obrovac and Chevrier1] This shows that ball milling Si and Ti in N2 is not only a much more convenient and less expensive way to make Si-TiN alloys, but also the method creates a microstructure that results in superior cycling performance than ball milling Si and TiN directly.
Conclusions
Si-TiN alloy powders have been shown to perform well as negative electrodes in Li cells, but have previously only been made by ball milling Si with expensive TiN powder. Here, it was shown that Si-TiN alloys with high Si content can surprisingly be made by simply ball milling Si and Ti powders in N2(g). The formation of TiSi2 was found to be a necessary intermediate in this reaction. This reaction is surprising, since a Si-TiSi2-Si3N4 3-phase region is expected for Si-excess alloys at thermodynamic equilibrium. The Si-TiN alloys made by ball milling Si and Ti powders in N2(g) were moreover found to have smaller TiN grain sizes and superior cycling performance in Li-ion cells than Si-TiN alloys made from ball milling Si and TiN directly. Good cycling was achieved for Si-TiN alloys with volumetric capacities up to 2000 Ah/L. These alloys are highly attractive, given their simple and low-cost synthesis and the high electronic conductivity, low electrolyte reactivity, and thermal stability of TiN.
Supplementary Material
The supplementary material for this article can be found at https://doi.org/10.1557/mrc.2018.178