Implications
Skeletal muscle is the primary tissue responsible for whole-body energy metabolism. In the current study, we designed the experiment to investigate the effect of lipopolysaccharide (LPS) treatment on muscle energy metabolism in pigs. The results indicated that LPS treatment significantly changed glycolysis level and mitochondrial function in the longissimus dorsi (LD) muscle of pigs, and increased calcium content induced by endoplasm reticulum stress was possibly involved. Understanding these underlying mechanisms may provide new therapeutic strategies for treating metabolic diseases induced by LPS in muscle.
Introduction
In modern intensive livestock production, pigs are easily threatened by different types of inflammation. Yet most of studies on inflammation in farm animals are focused on immune system and only few research pay attention to body metabolic changes (Maitra et al., Reference Maitra, Gestring, El-Maghrabi, Lang and Henry1999; Metzger et al., Reference Metzger, Nusair, Planer, Barash, Pappo, Shilyansky and Chajek-Shaul2004). In mice model, it has been reported that inflammation can insult many different metabolic pathways, ultimately affect the growth of animals (Joseph et al., Reference Joseph, Castrillo, Laffitte, Mangelsdorf and Tontonoz2003). Skeletal muscle as a major mass peripheral tissue accounts for 40% of total BW, and is the main product of animals for slaughter. Clarifying the metabolic changes especially glucose metabolism in skeletal muscle induced by inflammation is vital to further understand the inflammation influence on the metabolism of pigs.
For glucose metabolism, previous study showed that inflammation can induce glucose metabolic diseases such as hypoglycemia and hyperlactatemia through inhibition of the enzyme activity of mitochondrial phosphoenolpyruvate carboxykinase in a rat model (Caton et al., Reference Caton, Nayuni, Murch and Corder2009). Another study indicated that inflammation can lead to the inhibition of hepatic gluconeogenesis and hepatic glucose output (Maitra et al., Reference Maitra, Gestring, El-Maghrabi, Lang and Henry1999). Recent data demonstrated that infection could activate glycolysis in immune cells through activating the expression of hypoxia-inducible factor 1α (Liu et al., Reference Liu, Vachharajani, Yoza and McCall2012). All these results demonstrated that inflammation can affect cellular glucose metabolism. However, for skeletal muscle, which is the primary tissue responsible for whole-body insulin-stimulated glucose disposal, there is only few reports on glucose metabolism following inflammation in mice (Meng et al., Reference Meng, Wang, Xiao and Lin2014). The altered glucose metabolism in skeletal muscle in fattening pigs especially has the practical implication for meat quality, yet glucose metabolic changes in skeletal muscle after inflammation in pigs are largely unclear.
There are two processes by which glucose can be catabolized to produce ATP: glycolysis (mainly in the cytoplasm) and the aerobic oxidation of glucose (mainly in mitochondria). If tissues have too little oxygen, glycolysis is mainly used to produce ATP, although it is inefficient. In recent years, reports show that lipopolysaccharide (LPS) can induce mitochondrial metabolism dysfunction. Noh et al. found that mitochondrial complex II/III activities increased in mouse brains without any alterations in cellular ATP levels 3 h after LPS challenge (Noh et al., Reference Noh, Jeon and Seo2014). Suliman et al. found that LPS administration decreased mtDNA copy numbers and mtDNA gene transcription in rat hearts and caused a corresponding decrease in the activity of complexes I, IV and V 24 h after LPS treatment (Suliman et al., Reference Suliman, Welty-Wolf, Carraway, Tatro and Piantadosi2004). However, the influence of inflammation on mitochondrial function in porcine skeletal muscle is unknown.
Therefore, in the present study, growing pigs were challenged with LPS and used to investigate the glucose metabolism changes and the possible mechanism in the LD muscle of pigs following inflammation. The study will further clarify the muscle metabolic changes after LPS treatment and unravels the relationship between inflammation and glucose metabolism in pigs.
Material and methods
Ethics statement
All animal procedures were approved by the Institutional Animal Care and Use Committee (IACUC) of Nanjing Agricultural University. The study protocol was reviewed and approved specifically with the project number 2012CB124703. The slaughter and sampling procedures strictly followed the ‘Guidelines on Ethical Treatment of Experimental Animals’ (2006) No. 398 set by the Ministry of Science and Technology, China and the ‘Regulation Regarding the Management and Treatment of Experimental Animals’ (2008) No. 45 set by the Jiangsu Provincial People’s Government.
Animals and sample collection
Twelve male growing piglets (Duroc×Landrace×Large White) were assigned randomly into a control group and a LPS-treated group. Each group consisted of six pigs with an average BW of 12±0.5 kg, housed in individual cage for each pig. The room temperature was around 20°C to 25°C on average in the day time, and 10°C to 15°C in the evening. They were adapted for 7 days with ad libitum and free access to water. The ratio of ingredients in diet formula included 65% corn, 24% soybean meal, 5% bran, 2% fish meal, 4% premix and the nutrition content included 18% crude protein and 3.4 Mcal/kg digestion energy, respectively. Before the LPS injection the pigs were fasted for 2 h. The control group animals were each injected with 2 ml of saline, and the treatment group animals were each injected intramuscularly (i.m.) into the inner part of left thigh with 2 ml of LPS at 15 µg/kg BW at 0900 h. The LPS from Escherichiacoli serotype K-235 (phenolextracted) (Sigma-Aldrich Ireland Ltd, Dublin, Ireland), was dissolved in 0.9% NaCl solution. Six hours after LPS injection, the pigs were slaughtered following electric shock. We collected a 10 ml blood sample from the jugular vein. After 2 h at room temperature, the blood samples were centrifuged and the serum was stored at −70°C until analysis. LD muscle on the sixth to seventh vertebral column was quickly collected after slaughter and immediately frozen in liquid nitrogen; it was then stored at −70°C until RNA isolation.
RNA isolation, cDNA synthesis and real-time PCR
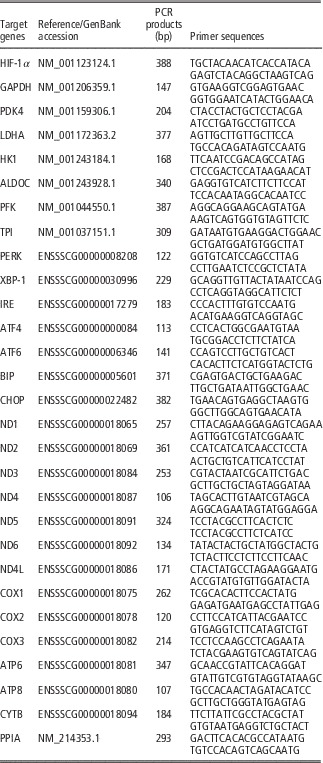
Total RNA was isolated from the LD muscle samples using TRIzol Reagent (15596026; Invitrogen Life Technologies, USA) according to the manufacturer’s instructions. One microgram of RNA was reverse transcribed with the PrimeScript 1st Strand cDNA Synthesis Kit (D6110A; Takara, Japan). The PCR analysis was performed with Mx3000P (Stratagene, USA), and two technical replicates were analyzed for each biological replicate. Peptidylprolyl isomerase A mRNA was used as the internal loading control. The primers were designed and synthesized by Takara Biotechnology (Table 1). Mock RT and no template controls were set to monitor the possible contamination of genomic and exogenous DNA both at RT and PCR. The specificity of amplification was determined by melting curve analysis and PCR product sequencing. The amplification efficiency of designed primer is between 90% and 110% in the present study. Hypoxia-inducible factor 1α (HIF-1α) is a transcription regulator of glycolysis. Hexokinase-1 (HK1), pyruvate kinase (PK) and phosphofructokinase (PFK) encoded proteins are key rate-limiting enzyme involved in glycolysis. PKR-like eukaryotic initiation factor 2α kinase (PERK), inositol requiring enzyme 1 (IRE1) and activating transcription factor 6 (ATF6) are ER membrane-associated proteins, which can monitor ER lumen and signaling. GRP78/bip and CHOP (C/EBP-homologous protein) are marker genes of ER stress. ND1-4L (mitochondrially encoded NADH dehydrogenase 1–4L), COX1-3 (mitochondrially encoded cytochrome c oxidase 1–3), ATP6-8 (mitochondrially encoded ATP synthase 6–8) and CYTB (mitochondrially encoded cytochrome b) are all mitochondria self-coded genes, which represent the function of mitochondria.
PCR primer sequences for target genes

HIF-1α=hypoxia inducible factor 1α; GAPDH=glyceraldehyde 3 phosphate dehydrogenase; PDK4=pyruvate dehydrogenase kinase 4; LDHA=lactate dehydrogenase A; HK1=hexokinase 1; ALDOC=aldolase C; PFK=phosphofructo kinase; TPI=triosephosphate isomerase; PERK=PRKR-like endoplasmic reticulum kinase; XBP-1=X-box-binding protein 1; IRE=inositol requiring enzyme; ATF4-6=activating transcription factor 4–6; BIP=heat shock protein 5 (glucose-regulated protein, 78 kDa); CHOP=C/EBP-homologous protein; ND1-4L=mitochondrially encoded NADH dehydrogenase 1–4 L; COX1-3=mitochondrially encoded cytochrome c oxidase 1–3; ATP6-8=mitochondrially encoded ATP synthase 6–8; CYTB=mitochondrially encoded cytochrome b; PPIA=peptidylpropyl isomerase A.
Tissue protein extraction and Western blot analysis
The muscle tissue protein concentration was measured using a Pierce bicinchoninic acid (BCA) protein assay kit (Thermo Scientific, USA) and then diluted to a concentration of 4 µg/µl. The diluted samples were mixed with loading buffer at a ratio of 1 : 1, denatured by boiling for 5 min, and loaded onto a 7.5% to 12.5% SDS polyacrylamide gel. After electrophoresis, the proteins were transferred to nitrocellulose membranes and blocked with 3% bovine serum albumin (BSA) powder for 120 min at room temperature. After repeated washing with 1X Tween-Tris-buffered saline, the membranes were incubated with specific antibodies. The primary antibodies included anti-GRP78/bip (BS6479, 1:500; Bioworld, USA), anti-CHOP (BS1136, 1:500; Bioworld), and anti-UCP3 (BS2849, 1:500; Bioworld). And anti-β-actin (AP0060, 1:10000; Bioworld) antibody was used as housekeeper. The specific signals from the membranes were detected by chemiluminescence using the LumiGLO substrate (SuperSignal West-Pico Trial Kit; Pierce, USA). A VersaDoc 4000 MP Imaging System (Bio-Rad, USA) was used to analyze the densities of the protein bands.
Detection of serum glucose and lactic acid contents
The analysis of the serum biochemical parameters including glucose and lactic acid was performed using an automatic biochemical analyzer (OLYMPUS AU2700; Olympus, Japan) in the Nanjing General Hospital of Nanjing Military Command, Jiangsu, China. The kits for glucose and lactic acid were purchased from Wako Pure Chemical Industries, Ltd.
Measurement of ATP, ADP, AMP, NAD and NADH levels in longissimus dorsi muscle
The measurement of AMP, ADP, ATP, NAD and NADH concentrations in muscle were performed as previously described (Jia et al., Reference Jia, Li, Cong, Yang, Sun, Parvizi and Zhao2013). A total of 50 μg of frozen muscle sample were extracted using 1 ml lysate which containing 0.6 M perchloric acid and 1 mM EDTA. The extracts were centrifuged at 10 000×g for 10 min at 4°C. About 700 µl supernatants were mixed with 200 µl 1 M KOH and centrifuged again. The standards for ATP (FLAAS), ADP (A5285), AMP (01930), NAD (N7004) and NADH (N8129) were purchased from Sigma. A reverse-phase column (99603, C18, 5 mm, 25 064.6 mm; Dikma Technologies Inc., USA) was used in HPLC with a column temperature set at 25°C.
Mitochondrial complex I, IV and V activity and mitochondrial ATP concentration
Muscle mitochondria were isolated according to a previously described protocol with some modifications (Frezza et al., Reference Frezza, Cipolat and Scorrano2007). A total of 100μg of frozen muscle sample was homogenized in a Dounce homogenizer with 20 strokes using isolation buffer 1 (w : v=1 : 5) containing 1 M Tris/HCL, 0.1 M EGTA/Tris, 10% BSA and 1 M sucrose; a protease inhibitor cocktail (11697498001; Roche) was also added to the isolation buffer. The homogenates were centrifuged at 700×g for 10 min at 4°C. The supernatant was collected and then centrifuged at 8000×g for 10 min at 4°C. The supernatant was discarded, and the pellet was resuspended in isolation buffer 2 containing 1 M KCL, 1 M Tris/MOPS and 0.1 M EGTA/Tris (pH 7.4). The suspensions were centrifuged at 8000×g for 10 min at 4°C. The final washed mitochondrial pellet was dispersed with the isolation buffer and stored at −70°C until testing. All operations were carried out on ice. Mitochondrial protein concentration was measured using a BCA protein assay kit (23225; Pierce). The enzyme activities of mitochondrial complexes I (catalogue number GMS50007; Genmed, Shanghai, China), IV (catalogue number GMS50010; Genmed), and V (catalogue number GMS50083; Genmed), as well as the mitochondrial ATP concentrations (catalogue number GMS10475; Genmed), were performed using a kit purchased from Shanghai Genmed Biomedical Science and Technology Co. Ltd.
Muscle tissue and mitochondrial calcium concentrations
Muscle tissue and mitochondrial calcium concentrations were measured through OCPC colorimetric method, the detection range is from 0.05 to 4 mmol. The kit (catalogue number GMS50097; Genmed) were purchased from Shanghai Genmed Biomedical Science and Technology Co. Ltd. We calculated the calcium concentration in muscle tissue and mitochondria as mmol/g protein.
Statistical analysis
Numerical data are expressed as the means±standard errors (SE). The statistical analyses were performed using the Statistical Program for Social Sciences (SPSS) software 20.0 for Windows (SPSS Inc., Chicago, IL, USA). The
 $${\rm 2}^{{{\minus}\Delta \Delta C_{t} }} $$
method was applied to analyze real-time PCR data. The differences were tested with an ANOVA used LPS treatment as main factor, and a t-test was used for the independent samples. Differences were considered significant at P<0.05.
Results
Serum glucose and lactic acid and inflammatory gene expression in longissimus dorsi muscle
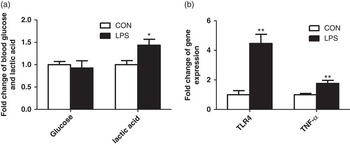
Though serum glucose showed no significant difference, serum lactic acid significantly increased compared with the control group (P<0.05) at 6 h after LPS challenge (Figure 1a). TLR4 and TNF-α gene expression (P<0.01) significantly increased in LD muscle after LPS challenge (Figure 1b).
The effect of LPS injection on serum glucose, lactic acid and inflammatory gene expression in the LD muscle of pigs. (a) The blood glucose and blood lactic acid content. (b) The expression of inflammatory genes. CON, control group; LPS, lipopolysaccharide treatment group. The data are presented as mean±SEM. *P<0.05, **P<0.01.

ATP, ADP, AMP, NAD and NADH content in longissimus dorsi muscle
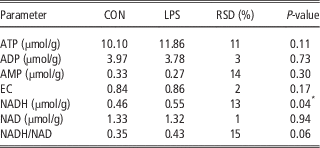
We detected energy metabolism parameters in LD muscle 6 h after LPS treatment using high-pressure liquid chromatography. As shown in Table 2, there is no significant difference in ATP, ADP and AMP content between the two groups. However, LPS caused a significant increase in NADH content in LD muscle (P<0.05), and there is a trend toward an increased NADH/NAD ratio (P=0.06). These results suggested that the redox state in muscle has been changed.
ATP, ADP, AMP, NAD and NADH content in longissimus dorsi muscle of pigs

EC=([ATP]+1/2[ADP])/([ATP]+[ADP]+[AMP]). n=6.
CON=control; LPS=lipopolysaccharide; RSD, residual standard deviation; EC=energy charge.
*P<0.05.
Glycolysis-related gene expression and enzymatic activity in longissimus dorsi muscle
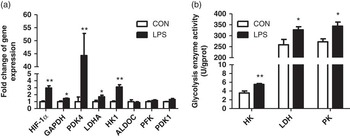
Glycolysis-related gene mRNA levels were measured. As shown in Figure 2a, HIF-1α which is a transcription regulator of glycolysis, significantly increased (P<0.01). Consistently, most glycolysis related genes significantly increased compared to the control group, including GAPDH (glyceraldehyde-3-phosphate dehydrogenase), PDK4 (pyruvate dehydrogenase kinase isozyme 4), LDHA (lactate dehydrogenase A), and HK1 (P<0.05). There was also an increase trend in the expression of the PDK1 gene (P=0.09). No distinct changes were observed in the expression of aldolase C (ALDOC) and PFK. We further measured the key enzymatic activities of glycolysis. The results showed that HK, PK and lactic dehydrogenase (LDH) activity all significantly increased compared with the control group (Figure 2b).
The effect of LPS injection on glycolysis in the LD muscle of pigs. (a) Expression of genes related to glycolysis. (b) HK, LDH and PK enzymatic activities. CON, control group; LPS, lipopolysaccharide treatment group. The data are presented as mean±SEM. *P<0.05, **P<0.01.

Gene expression and enzymatic activity related to mitochondrial metabolism
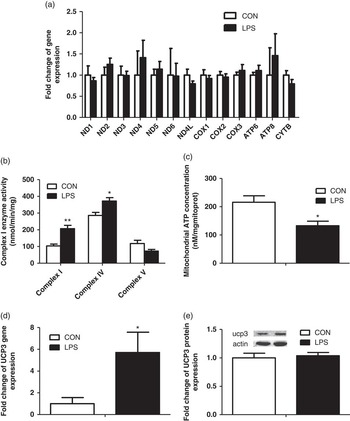
The mRNA levels of 13 genes encoded by mitochondria were detected by real-time PCR, and no difference was observed in their gene expression levels (Figure 3a). Although mitochondrial complex I and IV activities were significantly enhanced (P<0.05) compared with the control group (Figure 3b), a trend for decreased activity by the mitochondrial complex V was observed (P=0.10). Meanwhile, we found a significant decrease in the concentration of mitochondrial ATP (Figure 3c). We measured uncoupling protein 3 (UCP3) expression. Although we observed a significant increase in its gene expression levels, we did not find any alterations in its protein levels (Figure 3d and e).
The effect of LPS injection on mitochondrial function in the LD muscle of pigs. (a) Expression of genes related to mitochondria. (b) Enzymatic activities of mitochondrial complexes I, IV and V. (c) Mitochondrial ATP concentrations. (d) Expression of the UCP3 gene. (e) Expression of the UCP3 protein. CON, control group; LPS, lipopolysaccharide treatment group. The data are presented as mean±SEM. *P<0.05, **P<0.01.

Calcium content and ER stress in longissimus dorsi muscle
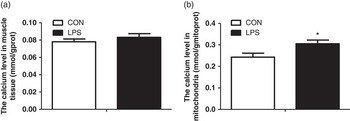
We measured the calcium level in muscle tissue and isolated mitochondria. The results showed that there were no obvious changes in the muscle tissue (Figure 4a); however, a significant increase (P<0.05) in mitochondrial calcium levels was observed (Figure 4b). These results suggested that the alteration of mitochondrial function may be related to the calcium level.
The effect of LPS injection on calcium concentrations in muscle tissue and isolated muscle mitochondria of pigs. (a) The calcium concentrations in muscle tissue. (b) The calcium concentrations in isolated muscle mitochondria. CON, control group; LPS, lipopolysaccharide treatment group. The data are presented as mean±SEM. *P<0.05, **P<0.01.

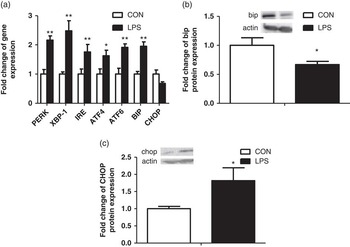
As shown in Figure 5a, the gene expression in three classical unfolded protein response (UPR) pathways significantly increased after LPS treatment. The chaperone GRP78/bip (P<0.05) protein content significantly decreased, although its mRNA expression increased compared with the control group (P<0.01) (Figure 5b). The CHOP protein (P<0.05) showed a significant increase compared with the control group (Figure 5c). These results suggested that LPS treatment caused the dysfunction of endoplasmic reticulum which can further induce calcium fluxes disbalance.
The effect of LPS injection on ER stress in the LD muscle of pigs. (a) Expression of genes related to ER stress. (b) Expression of the bip/GRP78 protein. (c) Expression of the CHOP protein. CON, control group; LPS, lipopolysaccharide treatment group. The data are presented as mean±SEM. *P<0.05, **P<0.01.

Discussion
LPS is a well-known trigger of the innate immune response. Until now, most studies on LPS effects in pigs focused on the animal’s immune response. With regards to body metabolism, the influence of LPS on the liver has been shown (Maitra et al., Reference Maitra, Gestring, El-Maghrabi, Lang and Henry1999; Metzger et al., Reference Metzger, Nusair, Planer, Barash, Pappo, Shilyansky and Chajek-Shaul2004). For skeletal muscle, which is an important tissue responsible for whole-body glucose disposal and the main product of meat animals, it is largely unclear how its metabolism is affected by inflammation. Our results showed that LPS treatment caused an energy dysfunction in the muscle of pigs.
It has been demonstrated that LPS induces an increase in lactate level of muscle and reduces lactate disposal in the liver of mice (McCallum and Berry, Reference McCallum and Berry1973; Metzger et al., Reference Metzger, Nusair, Planer, Barash, Pappo, Shilyansky and Chajek-Shaul2004), and the accumulation of lactate can lead to acidic blood. Although serum glucose did not show significant changes in the present study, serum lactic acid content significantly increased after LPS challenge. The results demonstrate that glycolysis may happen in skeletal muscle during inflammation. After LPS challenge, the body’s immune response has been described in our previous study (Huang et al., Reference Huang, Liu, Yin, Ci, Zhao and Yang2014). In the present study, the significantly increased TLR4 and TNF-α gene expression demonstrated the local inflammation in LD muscle following systemic inflammation.
Reduced form of NADH is an important intermediate product in energy metabolism. Most catabolic pathways can produce NADH, and NADH is the primary electron donor in the electron transport chain (ETC) (Bravo-Sagua et al., Reference Bravo-Sagua, Rodriguez, Kuzmicic, Gutierrez, Lopez-Crisosto, Quiroga, Díaz-Elizondo, Chiong, Gillette, Rothermel and Lavandero2013). Elevated NADH levels indicate that the catabolism in muscle has been enhanced and can facilitate the ETC process, which can further cause oxidative stress (Kussmaul and Hirst, Reference Kussmaul and Hirst2006). A high ratio of NADH/NAD is desirable in an anaerobic tissue, which is usually caused by the production of reactive oxygen species in an aerobic tissue that inhibits the tricarboxylic acid cycle and fatty acid oxidation (Ritov et al., Reference Ritov, Menshikova, Azuma, Wood, Toledo, Goodpaster, Ruderman and Kelley2010; James et al., Reference James, Collins, Logan and Murphy2012). The present results showed that LPS treatment caused an increased tendency in the ratio of NADH/NAD. The results suggest that LPS treatment may cause excessive oxygen consumption in muscle. However, the total ATP, ADP, AMP and EC demonstrated no significant difference between the two groups.
To further understand glucose metabolism in muscle following LPS challenge, we analyzed the gene expression and enzyme activity involved in the glycolysis pathway. The results showed that most gene expression, including GAPDH, PDK4, LDHA and HK1, was significantly increased after LPS treatment. The key enzyme activities responsible for glycolysis, such as PK, LDH and HK, were significantly higher in the LPS-treated group compared with the control group. These results demonstrate that LPS treatment causes a significant increase in glycolysis metabolism in muscle. The increased blood lactate content also confirmed this. Glycolysis is a common catabolic pathway for most of life, especially for anaerobic bacteria and cancer cells. However, it is not an efficient pathway to generate ATP, and excessive glycolysis can cause a huge waste of glucose in tissue (Lenzen, Reference Lenzen2014). In addition, the lactic acid product also causes damage for animals.
Why did glycolysis in muscle increase dramatically after LPS challenge? One possibility is the dysfunction of mitochondria, which are the primary site for ATP production under normal conditions. Therefore, we measured the function of mitochondria. We analyzed the ATP content in mitochondria, and the results showed that it significantly decreased. Mitochondrial DNA encodes 13 genes, but their gene expression exhibited no obvious changes after LPS challenge. The proteins encoded by the 13 mitochondrial genes are incorporated into respiratory complexes I, IV and V (Minocherhomji et al., Reference Minocherhomji, Tollefsbol and Singh2012). We further investigated the activities of these complexes. The results showed that mitochondrial complexes I and IV increased compared with the control group. A similar report demonstrated that LPS challenge can increase mitochondrial complex II/III activities without any effect on the level of ATP in mouse brain (Noh et al., Reference Noh, Jeon and Seo2014). However, mitochondrial complex V in the present study showed a trend toward decreased activity. Mitochondrial complexes I and IV are part of the active electron transport chain, whereas complex V is the site of the final step in oxidative phosphorylation and uses the proton gradient across the inner mitochondrial membrane for the production of ATP. The decreased complex V activity suggested that LPS treatment may uncouple mitochondrial oxidation and phosphorylation, with the oxidation process becoming activated and the phosphorylation process becoming blocked (García-Martinez et al., Reference García-Martinez, Sibille, Solanes, Darimont, Macé, Villarroya and Gómez-Foix2001; De Marchi et al., Reference De Marchi, Castelbou and Demaurex2011). This uncoupled process causes an excessive consumption of oxygen, which can exacerbate the anaerobic environment in muscle without producing much ATP. We also measured the level of UCP3, which catalyzes a proton leak across the inner mitochondrial membrane to uncouple oxidative phosphorylation. Although there is no obvious alteration in protein level, a significant increase in UCP3 gene expression was observed. All together, our results demonstrate that LPS treatment can induce mitochondrial disorder in muscle.
It has been shown that calcium ions can regulate many cellular ATP-consuming reactions, ATP hydrolysis and synthesis (Glancy and Balaban, Reference Glancy and Balaban2012). Appropriate calcium levels can enhance mitochondrial function; however, excessive levels of calcium disturb the electrochemical gradient in mitochondria (Pizzo et al., Reference Pizzo, Drago, Filadi and Pozzan2012) and can induce mitochondrial apoptosis (Keinan et al., Reference Keinan, Pahima, Ben-Hail and Shoshan-Barmatz2013). To further understand mitochondrial metabolism during inflammation, we measured the calcium content both in muscle and isolated mitochondria, and found mitochondrial calcium content was significantly increased. The results showed that LPS challenge disrupts mitochondrial function which might partly induced by the increased calcium content.
ER is the main organelles to store the calcium. Approximately 20% of the outer mitochondrial membrane has close contact with the ER, which is also called the mitochondrial-associated ER membrane (Bravo-Sagua et al., Reference Bravo-Sagua, Rodriguez, Kuzmicic, Gutierrez, Lopez-Crisosto, Quiroga, Díaz-Elizondo, Chiong, Gillette, Rothermel and Lavandero2013). Previously study has demonstrated that there is extensive communication and coordination between the ER and mitochondria (Perreault et al., Reference Perreault, Bousquet, Lauzon, Paiement and Leclerc2009). A focal point for this communication is the close contact between the two organelles, especially via calcium exchange. De Marchi et al. (Reference De Marchi, Castelbou and Demaurex2011) found that UCP3 can decrease mitochondrial ATP production by modulating calcium levels between the ER and mitochondria. One consequence of ER stress is serious calcium runoff from the ER to the cytoplasm or other organelles (Hotamisligil, Reference Hotamisligil2010; Isomura et al., Reference Isomura, Kotake, Masuda, Miyara, Okuda, Samizo, Sanoh, Hosoi, Ozawa and Ohta2013). Therefore, we analysis the genes related to ER stress. All three major UPR pathways in ER stress are engaged with glucose (Oyadomari et al., Reference Oyadomari, Harding, Zhang, Oyadomari and Ron2008) and lipid (Bobrovnikova-Marjon et al., Reference Bobrovnikova-Marjon, Hatzivassiliou, Grigoriadou, Romero, Cavener, Thompson and Diehl2008; Lee et al., Reference Lee, Scapa, Cohen and Glimcher2008; Rutkowski et al., Reference Rutkowski, Wu, Back, Callaghan, Ferris, Iqbal, Clark, Miao, Hassler, Fornek, Katze, Hussain, Song, Swathirajan, Wang, Yau and Kaufman2008) metabolism. Our results showed that most genes involved in ER stress significantly increased with LPS treatment, and the CHOP protein also significantly increased, which is consistent with most ER stress reports (Kaplowitz et al., Reference Kaplowitz, Than, Shinohara and Ji2007; Kozlov et al., Reference Kozlov, Duvigneau, Miller, Nürnberger, Gesslbauer, Kungl, Ohlinger, Hartl, Gille, Staniek, Gregor, Haindl and Redl2009; Kim et al., Reference Kim, Kim, Kang, Lee, Park, Jeong and Lee2013). The GRP78/bip protein significantly decreased, rather than increased, which may suggest that ER stress cannot be resolved because this requires an increase in functional UPR responsive proteins, especially GRP78/bip (Kozlov et al., Reference Kozlov, Duvigneau, Miller, Nürnberger, Gesslbauer, Kungl, Ohlinger, Hartl, Gille, Staniek, Gregor, Haindl and Redl2009).
Conclusions
Taken together, our results demonstrate that LPS treatment causes glucose disorder, as shown by increased glycolysis and dysfunction of mitochondrial metabolism in skeletal muscle, which may be partially caused by ER stress. Understanding these underlying mechanisms may provide new therapeutic strategies for treating metabolic diseases induced by LPS in muscle.
Acknowledgments
This study was supported by the National Natural Science Foundation of China (31572482), the National Basic Research Program of China (2012CB124703), the Program for New Century Excellent Talents in University (NCET-12-0889), and the Priority Academic Program Development of Jiangsu Higher Education Institutions.