

1 Introduction
Bubble-laden flow appears in a variety of natural (Clift, Grace & Weber Reference Clift, Grace and Weber1978; Gonnermann & Manga Reference Gonnermann and Manga2007) and industrial (Deckwer Reference Deckwer1992) processes. The presence of bubbles dramatically alters the transport properties of a flow (Mudde Reference Mudde2005; Ceccio Reference Ceccio2010; Biferale et al. Reference Biferale, Perlekar, Sbragaglia and Toschi2012; Pandit et al. Reference Pandit2017; Risso Reference Risso2018; Alméras et al. Reference Alméras, Mathai, Sun and Lohse2019; Elghobashi Reference Elghobashi2019; Mathai, Lohse & Sun Reference Mathai, Lohse and Sun2020). A single bubble of diameter  $d$, because of buoyancy, rises under gravity. Its trajectory and the wake flow depend on the density and viscosity contrast with the ambient fluid, as well as the surface tension (Clift et al. Reference Clift, Grace and Weber1978; Bhaga & Weber Reference Bhaga and Weber1981; Tripathi, Sahu & Govindarajan Reference Tripathi, Sahu and Govindarajan2015). A suspension of such bubbles at moderate volume fractions generates complex spatiotemporal flow patterns that are often referred to as pseudo-turbulence or bubble-induced agitation (Mudde Reference Mudde2005; Risso Reference Risso2018).
Experiments have made significant progress in characterizing velocity fluctuations of the fluid phase in pseudo-turbulence. A key observation is the robust power-law scaling in the energy spectrum, with an exponent of  $-3$ either in frequency
 $\unicode[STIX]{x1D708}$ or the wavenumber
 $k$ space (Mercado et al. Reference Mercado, Gómez, Gils, Sun and Lohse2010; Riboux, Risso & Legendre Reference Riboux, Risso and Legendre2010; Mendez-Diaz et al. Reference Mendez-Diaz, Serrano-Garcia, Zenit and Hernández-Cordero2013). The scaling range, however, remains controversial. Riboux et al. (Reference Riboux, Risso and Legendre2010) investigated turbulence in the wake of a bubble swarm and found
 $k^{-3}$ scaling for length scales larger than the bubble diameter
 $d$ (i.e.
 $k<2\unicode[STIX]{x03C0}/d$), whereas Mercado et al. (Reference Mercado, Gómez, Gils, Sun and Lohse2010) and Prakash et al. (Reference Prakash, Mercado, van Wijngaarden, Mancilla, Tagawa, Lohse and Sun2016) observed this scaling for scales smaller than
 $d$ in a steady-state bubble suspension. Experiments on buoyancy-driven bubbly flows in the presence of grid turbulence (Lance & Bataille Reference Lance and Bataille1991; Prakash et al. Reference Prakash, Mercado, van Wijngaarden, Mancilla, Tagawa, Lohse and Sun2016; Alméras et al. Reference Alméras, Mathai, Lohse and Sun2017) observe Kolmogorov scaling for scales larger than the bubble diameter and smaller than the forcing scale, and a much steeper
 $k^{-3}$ scaling for scales smaller than the bubble diameter and larger than the dissipation scale. Lance & Bataille (Reference Lance and Bataille1991) argued that, assuming production because of wakes to be local in spectral space, balance of production with viscous dissipation leads to the observed
 $k^{-3}$ scaling.
Fully resolved numerical simulations of three-dimensional bubbly flows for a range of Reynolds number  $O(10)<Re<O(10^{3})$ (Bunner & Tryggvason Reference Bunner and Tryggvason2002a,Reference Bunner and Tryggvasonb; Roghair et al. Reference Roghair, Mercado, Annaland, Kuipers, Sun and Lohse2011) found
 $k^{-3}$ scaling for length scales smaller than
 $d$ (
 $k>2\unicode[STIX]{x03C0}/d$), and attributed it to the balance between viscous dissipation and energy production by the wakes (Lance & Bataille Reference Lance and Bataille1991).
Two mechanisms proposed to explain the observed scaling behaviour in experiments are: (i) superposition of velocity fluctuations generated in the vicinity of the bubbles (Risso Reference Risso2011) and (ii) at high  $Re$, instabilities in the flow through bubble swarms (Lance & Bataille Reference Lance and Bataille1991; Mudde Reference Mudde2005; Risso Reference Risso2018). In an experiment or a simulation, it is difficult to disentangle these two mechanisms.
In classical turbulence, a constant flux of energy is maintained between the injection and dissipation scales (Frisch Reference Frisch1997; Pandit, Perlekar & Ray Reference Pandit, Perlekar and Ray2009). In pseudo-turbulence, on the other hand, it is not clear how the energy injected by buoyancy is transferred between different scales. In particular, the following key questions remain unanswered: (i) How do liquid velocity fluctuations and the pseudo-turbulence spectrum depend on the Reynolds number ( $Re$)? (ii) What is the energy budget and the dominant balances? (iii) Is there an energy cascade (a non-zero energy flux)?
In this paper, we address all of the above questions for experimentally relevant Reynolds ( $Re$) and Atwood (
 $At$) numbers. We first investigate the dynamics of an isolated bubble and show that the wake flow behind the bubble is in agreement with earlier experiments and simulations. Next, for a bubbly suspension we show that the liquid velocity fluctuations are in quantitative agreement with the experiments of Riboux et al. (Reference Riboux, Risso and Legendre2010) and the bubble velocity fluctuations are in quantitative agreement with the simulations of Roghair et al. (Reference Roghair, Mercado, Annaland, Kuipers, Sun and Lohse2011). We then proceed to derive the scale-by-scale energy budget equation and investigate the dominant balances for different
 $Re$ and
 $At$. We find that for scales smaller than the bubble diameter, viscous dissipation balances net nonlinear transfer of energy because of advection and the surface tension to give a
 $k^{-3}$ pseudo-turbulence spectrum. The dominant balances are robust and do not depend on the density contrast (
 $At$).
2 Model and numerical details
We study the dynamics of bubbly flow by using Navier–Stokes (NS) equations with a surface-tension force due to bubbles:
 $$\begin{eqnarray}\displaystyle & \displaystyle \unicode[STIX]{x1D70C}\text{D}_{t}\boldsymbol{u}=\unicode[STIX]{x1D735}\boldsymbol{\cdot }[2\unicode[STIX]{x1D707}\unicode[STIX]{x1D64E}]-\unicode[STIX]{x1D735}p+\boldsymbol{F}^{\unicode[STIX]{x1D70E}}+\boldsymbol{F}^{g}, & \displaystyle\end{eqnarray}$$
 $$\begin{eqnarray}\displaystyle & \displaystyle \unicode[STIX]{x1D735}\boldsymbol{\cdot }\boldsymbol{u}=0. & \displaystyle\end{eqnarray}$$
Here,  $\text{D}_{t}=\unicode[STIX]{x2202}_{t}+(\boldsymbol{u}\boldsymbol{\cdot }\unicode[STIX]{x1D735})$ is the material derivative,
 $\boldsymbol{u}=(u_{x},u_{y},u_{z})$ is the hydrodynamic velocity,
 $p$ is the pressure,
 $\unicode[STIX]{x1D64E}\equiv (\unicode[STIX]{x1D735}\boldsymbol{u}+\unicode[STIX]{x1D735}\boldsymbol{u}^{\text{T}})/2$ is the rate of deformation tensor,
 $\unicode[STIX]{x1D70C}\equiv \unicode[STIX]{x1D70C}_{f}c+\unicode[STIX]{x1D70C}_{b}(1-c)$ is the density,
 $\unicode[STIX]{x1D707}\equiv \unicode[STIX]{x1D707}_{f}c+\unicode[STIX]{x1D707}_{b}(1-c)$ is the viscosity,
 $\unicode[STIX]{x1D70C}_{f}$ (
 $\unicode[STIX]{x1D70C}_{b}$) is the fluid (bubble) density and
 $\unicode[STIX]{x1D707}_{b}$ (
 $\unicode[STIX]{x1D707}_{f}$) is the bubble (fluid) viscosity. The value of the indicator function
 $c$ is equal to zero in the bubble phase and unity in the fluid phase. The surface-tension force is
 $\boldsymbol{F}^{\unicode[STIX]{x1D70E}}\equiv \unicode[STIX]{x1D70E}\unicode[STIX]{x1D705}\hat{\boldsymbol{n}}$, where
 $\unicode[STIX]{x1D70E}$ is the coefficient of surface tension,
 $\unicode[STIX]{x1D705}$ is the curvature and
 $\hat{\boldsymbol{n}}$ is the normal to the bubble interface.
 $\boldsymbol{F}^{g}\equiv [\unicode[STIX]{x1D70C}_{a}-\unicode[STIX]{x1D70C}]g\hat{\boldsymbol{z}}$ is the buoyancy force, where
 $g$ is the acceleration due to gravity and
 $\unicode[STIX]{x1D70C}_{a}\equiv [\int \unicode[STIX]{x1D70C}(c)\,\text{d}\boldsymbol{x}]/L^{3}$ is the average density. For small Atwood numbers, we employ the Boussinesq approximation, whereby
 $\unicode[STIX]{x1D70C}$ on the left-hand side of (2.1a) is replaced by the average density
 $\unicode[STIX]{x1D70C}_{a}$. Note that low Atwood numbers can be experimentally realized in near-critical binary fluids as well as mixtures of oil (Perlekar Reference Perlekar2019; Shukla et al. Reference Shukla, Kofman, Balestra, Zhu and Gallaire2019).
We solve the Boussinesq-approximated NS using a pseudo-spectral method (Canuto et al. Reference Canuto, Hussaini, Quarteroni and Zang2012) coupled to a front-tracking algorithm (Tryggvason et al. Reference Tryggvason, Bunner, Esmaeeli, Juric, Al-Rawahi, Tauber, Han, Nas and Jan2001; Aniszewski et al. Reference Aniszewski2019) for bubble dynamics. Time marching is done using a second-order Adams–Bashforth scheme. For the non-Boussinesq NS, we use the open source finite-volume-front-tracking solver PARIS (Aniszewski et al. Reference Aniszewski2019).
We use a cubic periodic box of volume  $L^{3}$ and discretize it with
 $N^{3}$ collocation points. We initialize the velocity field
 $\boldsymbol{u}=0$ and place the centres of
 $N_{b}$ bubbles at random locations such that no two bubbles overlap. The Reynolds number
 $Re$, Bond number
 $Bo$ and bubble volume fraction
 $\unicode[STIX]{x1D719}\equiv [\int (1-c)\,\text{d}\boldsymbol{x}]/L^{3}$ that we use (see table 1) are comparable to the experiments (Riboux et al. Reference Riboux, Risso and Legendre2010; Mendez-Diaz et al. Reference Mendez-Diaz, Serrano-Garcia, Zenit and Hernández-Cordero2013).
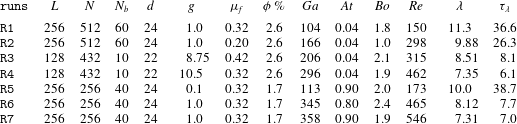
Table of parameters used in our DNS. Here,  $\unicode[STIX]{x1D6FF}\unicode[STIX]{x1D70C}\equiv \unicode[STIX]{x1D70C}_{f}-\unicode[STIX]{x1D70C}_{b}$ is the density difference,
 $Ga\equiv \sqrt{\unicode[STIX]{x1D70C}_{f}\unicode[STIX]{x1D6FF}\unicode[STIX]{x1D70C}gd^{3}}/\unicode[STIX]{x1D707}_{f}$ is the Galilei number,
 $Bo\equiv \unicode[STIX]{x1D6FF}\unicode[STIX]{x1D70C}gd^{2}/\unicode[STIX]{x1D70E}$ is the Bond number,
 $At=\unicode[STIX]{x1D6FF}\unicode[STIX]{x1D70C}/(\unicode[STIX]{x1D70C}_{f}+\unicode[STIX]{x1D70C}_{b})$ is the Atwood number, and
 $Re\equiv \unicode[STIX]{x1D70C}_{f}V_{0}d/\unicode[STIX]{x1D707}_{f}$ is the bubble Reynolds number, where
 $V_{0}$ is the rise velocity of an isolated bubble,
 $\unicode[STIX]{x1D706}\equiv \sqrt{10\unicode[STIX]{x1D707}_{f}E/\unicode[STIX]{x1D70C}_{f}\unicode[STIX]{x1D716}_{\unicode[STIX]{x1D707}}}$ is the integral length scale, and
 $\unicode[STIX]{x1D70F}_{\unicode[STIX]{x1D706}}\equiv \unicode[STIX]{x1D706}/\sqrt{2E/3\unicode[STIX]{x1D70C}_{f}}$ is the integral time scale.

3 Results
In subsequent sections, we investigate the statistical properties of stationary pseudo-turbulence generated in buoyancy-driven bubbly flows. Table 1 lists the parameters used in our simulations. Our parameters are chosen such that the Reynolds number, Bond number and volume fraction are comparable to those used in earlier experiments (Riboux et al. Reference Riboux, Risso and Legendre2010; Mendez-Diaz et al. Reference Mendez-Diaz, Serrano-Garcia, Zenit and Hernández-Cordero2013; Risso Reference Risso2018). We conduct simulations at both low and high  $At$ numbers to investigate the role of density differences on the statistics of pseudo-turbulence. The rest of the paper is organized as follows. In § 3.1, we study the trajectory of an isolated bubble and, consistent with the experiments, show that the bubble shape is ellipsoidal. In §§ 3.2 and 3.3, we investigate the total kinetic energy budget and the fluid and bubble centre-of-mass velocity fluctuations, then make quantitative comparisons with the experiments. In § 3.4, we study the kinetic energy spectrum and scale-by-scale energy budget. In § 3.5, we investigate the length scale of pseudo-turbulence and, in § 3.6, we investigate the clustering of bubbles. We present our conclusions in § 4.
3.1 Single bubble dynamics
In this section, we study the dynamics of an initially spherical bubble as it rises because of buoyancy. The seminal work of Bhaga & Weber (Reference Bhaga and Weber1981), Wu & Gharib (Reference Wu and Gharib2002) and Tchoufag, Magnaudet & Fabre (Reference Tchoufag, Magnaudet and Fabre2014) characterized the shape and trajectory of an isolated bubble in terms of the Reynolds and Bond numbers. Experiments on turbulent bubbly flows (Lance & Bataille Reference Lance and Bataille1991; Prakash et al. Reference Prakash, Mercado, van Wijngaarden, Mancilla, Tagawa, Lohse and Sun2016; Mathai et al. Reference Mathai, Huisman, Sun, Lohse and Bourgoin2018) observe ellipsoidal bubbles. In the following, we characterize the dynamics of an isolated bubble for the parameters used in our simulations.
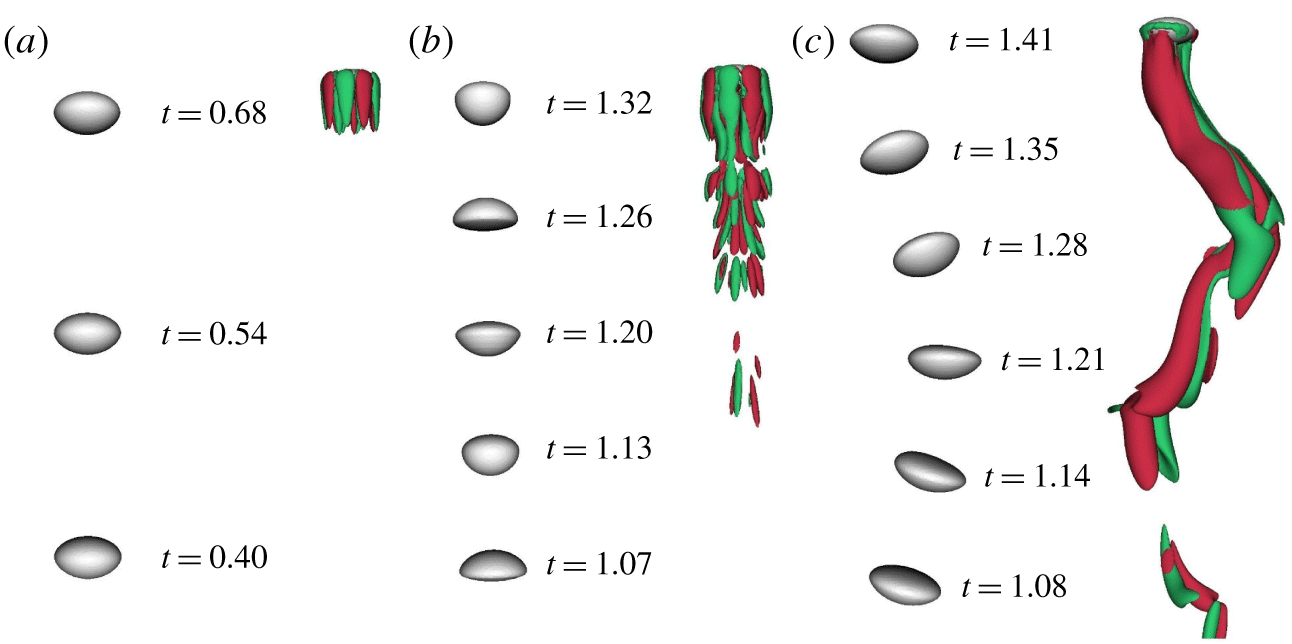
To avoid the interaction of the bubble with its own wake, we use a vertically elongated cuboidal domain of dimension  $5d\times 5d\times 21d$. After the bubble rise velocity attains steady state, figure 1(a–c) shows the bubble shape and the vertical component of the vorticity
 $\unicode[STIX]{x1D714}_{z}=(\unicode[STIX]{x1D735}\times \boldsymbol{u})\boldsymbol{\cdot }\hat{\boldsymbol{z}}$. For
 $Re=150$ and
 $At=0.04$ (run R1), the bubble shape is an oblate ellipsoid and rises in a rectilinear trajectory. On increasing to
 $Re=462$ (run R4), the bubble pulsates while rising and sheds varicose vortices similar to Pivello et al. (Reference Pivello, Villar, Serfaty, Roma and Silveira-Neto2014). Finally, for high
 $At=0.80$ and
 $Re=465$ (run R6), similar to region III of Tripathi et al. (Reference Tripathi, Sahu and Govindarajan2015), we find that the bubble shape is an oblate ellipsoid and follows a zigzag trajectory.
Bubble positions at different times (in units of  $\unicode[STIX]{x1D70F}_{s}\equiv L/\sqrt{\unicode[STIX]{x1D6FF}\unicode[STIX]{x1D70C}gd/\unicode[STIX]{x1D70C}_{f}}$) and the
 $z$-component of the vorticity (
 $\unicode[STIX]{x1D714}_{z}=\unicode[STIX]{x2202}_{x}u_{y}-\unicode[STIX]{x2202}_{y}u_{x}$) for the case of a single bubble rising under gravity. The non-dimensional parameters in representative cases are taken the same as run
 $\mathtt{R1}$ in (a), run
 $\mathtt{R4}$ in (b) and run
 $\mathtt{R6}$ in (c). Green regions correspond to
 $\unicode[STIX]{x1D714}_{z}<0$, whereas red regions correspond to
 $\unicode[STIX]{x1D714}_{z}>0$. We plot iso-contours corresponding to
 $|\unicode[STIX]{x1D714}_{z}|=\pm 10^{-3}$ in (a),
 $|\unicode[STIX]{x1D714}_{z}|=\pm 10^{-2}$ in (b) and
 $|\unicode[STIX]{x1D714}_{z}|=\pm 10^{-1}$ in (c).

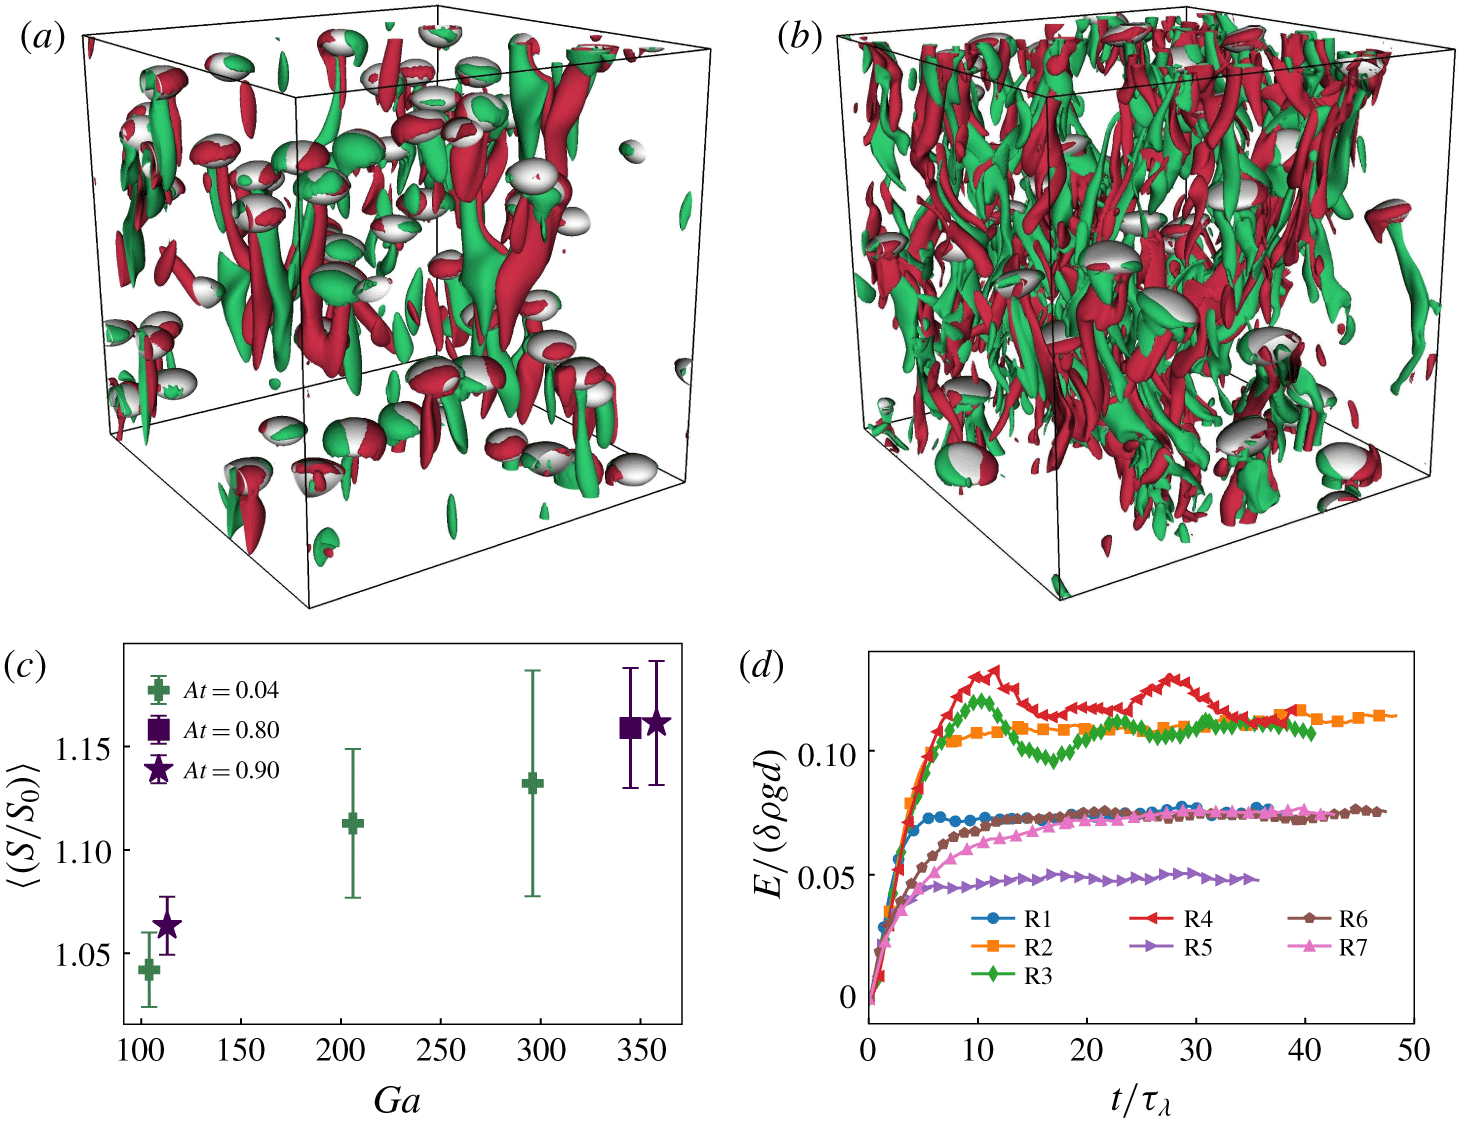
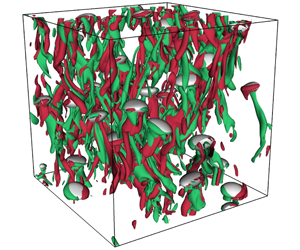
Representative steady-state snapshot of the bubbles overlaid on the iso-contour plots of the  $z$-component of the vorticity field
 $\unicode[STIX]{x1D714}_{z}\equiv [\unicode[STIX]{x1D735}\times \boldsymbol{u}]\boldsymbol{\cdot }\hat{\boldsymbol{z}}$ for
 $Re=150$,
 $At=0.04$ (a) and for
 $Re=465$,
 $At=0.8$ (b). Regions with
 $\unicode[STIX]{x1D714}_{z}=2\unicode[STIX]{x1D70E}_{\unicode[STIX]{x1D714}}(-2\unicode[STIX]{x1D70E}_{\unicode[STIX]{x1D714}})$ are shown in red (green), where
 $\unicode[STIX]{x1D70E}_{\unicode[STIX]{x1D714}}$ is the standard deviation of
 $\unicode[STIX]{x1D714}_{z}$. As expected, bubble–wake interactions become more intense on increasing
 $Re$. (c) Average bubble deformation
 $\langle \langle S(t)/S(0)\rangle \rangle$ versus
 $Ga$ for low and high
 $At$ numbers. (d) Kinetic energy evolution for the runs given in table 1.

3.2 Bubble suspension and kinetic energy budget
The plots in figure 2(a,b) show the representative steady-state iso-vorticity contours of the  $z$-component of the vorticity along with the bubble interface position for our bubbly flow configurations. As expected from our isolated bubble study in the previous section, we observe rising ellipsoidal bubbles and their wakes, which interact to generate pseudo-turbulence. The individual bubbles in the suspension show shape undulations which are similar to their isolated bubble counterparts (see movies available in the supplementary material at https://doi.org/10.1017/jfm.2019.991). Furthermore, for comparable
 $Bo\approx 2$, the average bubble deformation
 $\langle \langle S(t)/S(0)\rangle \rangle$ increases with increasing
 $Re$ (figure 2c). Here,
 $\langle \langle \cdot \rangle \rangle$ denotes temporal averaging over bubble trajectories in the statistically steady state,
 $S(t)$ is the surface area of the bubble and
 $S(0)=\unicode[STIX]{x03C0}d^{2}$.
The time evolution of the kinetic energy  $E=\langle \unicode[STIX]{x1D70C}u^{2}/2\rangle$ for runs R1–R7 is shown in figure 2(d). A statistically steady state is attained close to
 $t\approx 20\unicode[STIX]{x1D70F}_{\unicode[STIX]{x1D706}}$, where
 $\unicode[STIX]{x1D70F}_{\unicode[STIX]{x1D706}}$ is the integral time scale (see table 1). Using (2.1a), we obtain the balance equation for the total kinetic energy
 $E$ as
 $$\begin{eqnarray}\unicode[STIX]{x2202}_{t}\underbrace{\left\langle \frac{\unicode[STIX]{x1D70C}\boldsymbol{u}^{2}}{2}\right\rangle }_{E}=-\underbrace{2\langle \unicode[STIX]{x1D707}(c)\unicode[STIX]{x1D64E}\boldsymbol{ : }\unicode[STIX]{x1D64E}\rangle }_{\unicode[STIX]{x1D716}_{\unicode[STIX]{x1D707}}}+\underbrace{\langle [\unicode[STIX]{x1D70C}_{a}-\unicode[STIX]{x1D70C}(c)]u_{y}g\rangle }_{\unicode[STIX]{x1D716}_{inj}}+\underbrace{\langle \boldsymbol{F}^{\unicode[STIX]{x1D70E}}\boldsymbol{\cdot }\boldsymbol{u}\rangle }_{\unicode[STIX]{x1D716}_{\unicode[STIX]{x1D70E}}},\end{eqnarray}$$
where  $\langle \cdot \rangle$ represents spatial averaging. In steady state, the energy injected by buoyancy
 $\unicode[STIX]{x1D716}_{inj}$ is balanced by viscous dissipation
 $\unicode[STIX]{x1D716}_{\unicode[STIX]{x1D707}}$. The energy injected by buoyancy
 $\unicode[STIX]{x1D716}_{inj}\approx (\unicode[STIX]{x1D70C}_{f}-\unicode[STIX]{x1D70C}_{b})\unicode[STIX]{x1D719}g\langle U\rangle$, where
 $\langle U\rangle$ is the average bubble rise velocity. Note that
 $\unicode[STIX]{x1D716}_{\unicode[STIX]{x1D70E}}=-\unicode[STIX]{x2202}_{t}\int \unicode[STIX]{x1D70E}\,\text{d}s$ (Joseph Reference Joseph1976), where
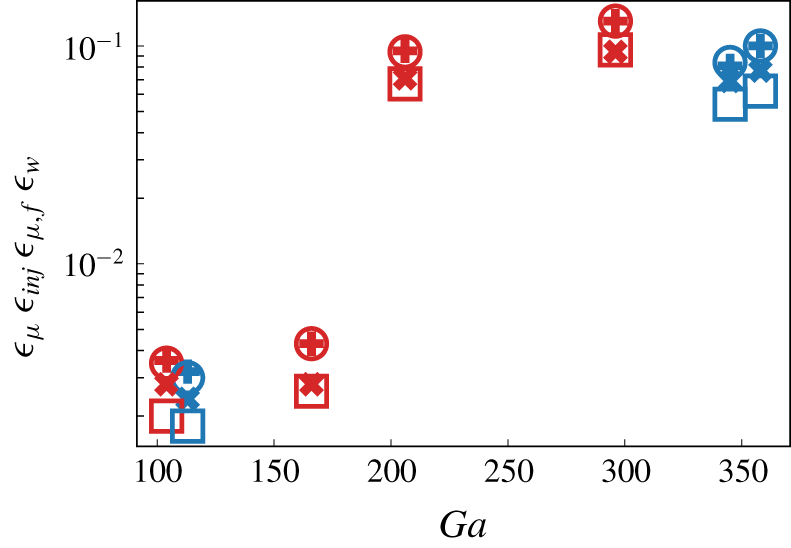
 $\text{d}s$ is the bubble surface element, and its contribution is zero in the steady state. The excellent agreement between steady-state values of
 $\unicode[STIX]{x1D716}_{\unicode[STIX]{x1D707}}$ and
 $\unicode[STIX]{x1D716}_{inj}$ is evident from figure 3.
Lance & Bataille (Reference Lance and Bataille1991) argued that the energy injected by the buoyancy is dissipated in the wakes on the bubble. The energy dissipation in the wakes can be estimated as  $\unicode[STIX]{x1D716}_{w}=C_{d}\unicode[STIX]{x1D719}((\unicode[STIX]{x1D6FF}\unicode[STIX]{x1D70C}/\unicode[STIX]{x1D70C}_{f})gd)^{3/2}/d$, where
 $C_{d}$ is the drag coefficient. Assuming
 $C_{d}=O(1)$, we find that
 $\unicode[STIX]{x1D716}_{w}$ is indeed comparable to the viscous dissipation in the fluid phase
 $\unicode[STIX]{x1D716}_{\unicode[STIX]{x1D707},f}$ (see figure 3).
Energy dissipation rate  $\unicode[STIX]{x1D716}_{\unicode[STIX]{x1D707}}$ (filled plus), estimation of the liquid dissipation rate
 $\unicode[STIX]{x1D716}_{w}\equiv \unicode[STIX]{x1D719}(\unicode[STIX]{x1D6FF}\unicode[STIX]{x1D70C}gd/\unicode[STIX]{x1D70C}_{f})^{3/2}/d$ (empty squares) because of the bubble wakes (Lance & Bataille Reference Lance and Bataille1991), dissipation rate in the fluid
 $\unicode[STIX]{x1D716}_{\unicode[STIX]{x1D707},f}$ (filled cross) and energy injection rate
 $\unicode[STIX]{x1D716}_{inj}$ (empty circles) for runs
 $\mathtt{R1}{-}\mathtt{R7}$. The low-
 $At$ runs are marked in red and the high-
 $At$ runs are marked in blue.

3.3 Probability distribution function of the fluid and bubble velocity fluctuations
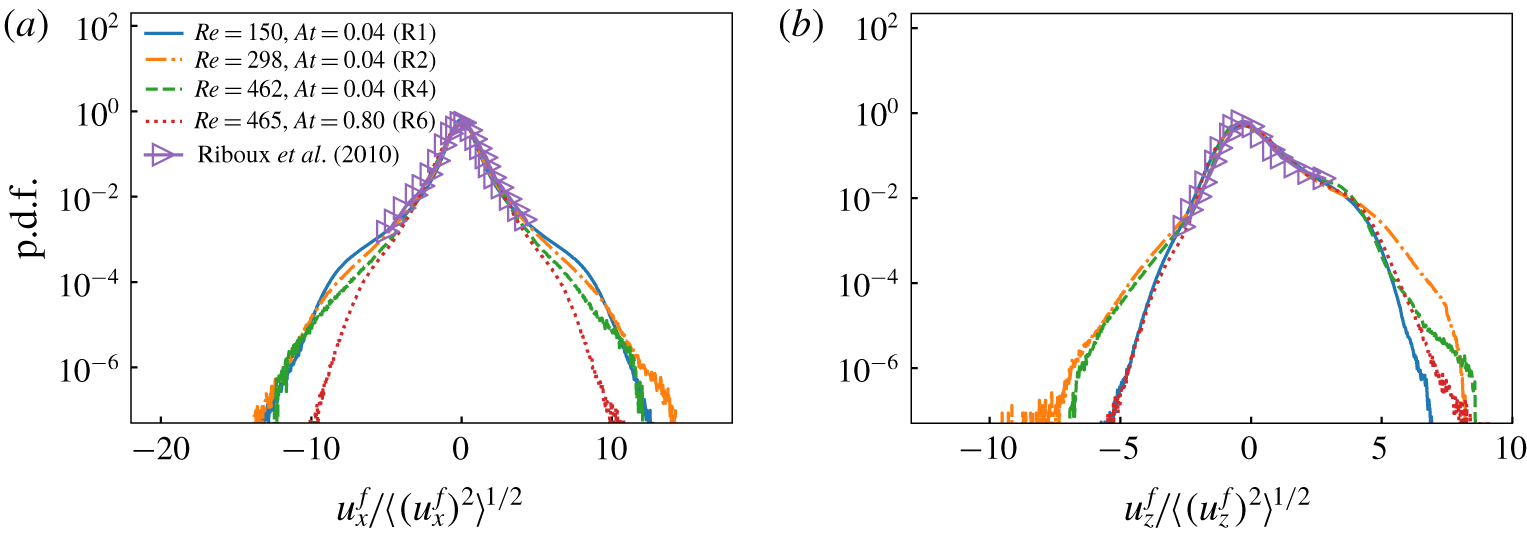
In figure 4(a,b) we plot the probability distribution function (p.d.f.) of the fluid velocity fluctuations  $\boldsymbol{u}^{f}\equiv \boldsymbol{u}[c=1]$. Both the horizontal and vertical velocity p.d.f.s are in quantitative agreement with the experimental data of Riboux et al. (Reference Riboux, Risso and Legendre2010) and Risso (Reference Risso2018). The p.d.f. of the velocity fluctuations of the horizontal velocity components are symmetric about the origin and have stretched exponential tails, whereas the vertical velocity fluctuations are positively skewed (Riboux et al. Reference Riboux, Risso and Legendre2010; Prakash et al. Reference Prakash, Mercado, van Wijngaarden, Mancilla, Tagawa, Lohse and Sun2016; Alméras et al. Reference Alméras, Mathai, Lohse and Sun2017). Our results are consistent with the recently proposed stochastic model of Risso (Reference Risso2016), which suggests that the potential flow disturbance around bubbles, bubble wakes and the turbulent agitation because of flow instabilities, together lead to the observed velocity distributions. We believe that the deviation in the tail of the distributions arises because of the differences in the wake flow for different
 $Re$ and
 $At$ (see figure 1). Note that positive skewness in the vertical velocity has also been observed in thermal convection with bubbles (Biferale et al. Reference Biferale, Perlekar, Sbragaglia and Toschi2012).
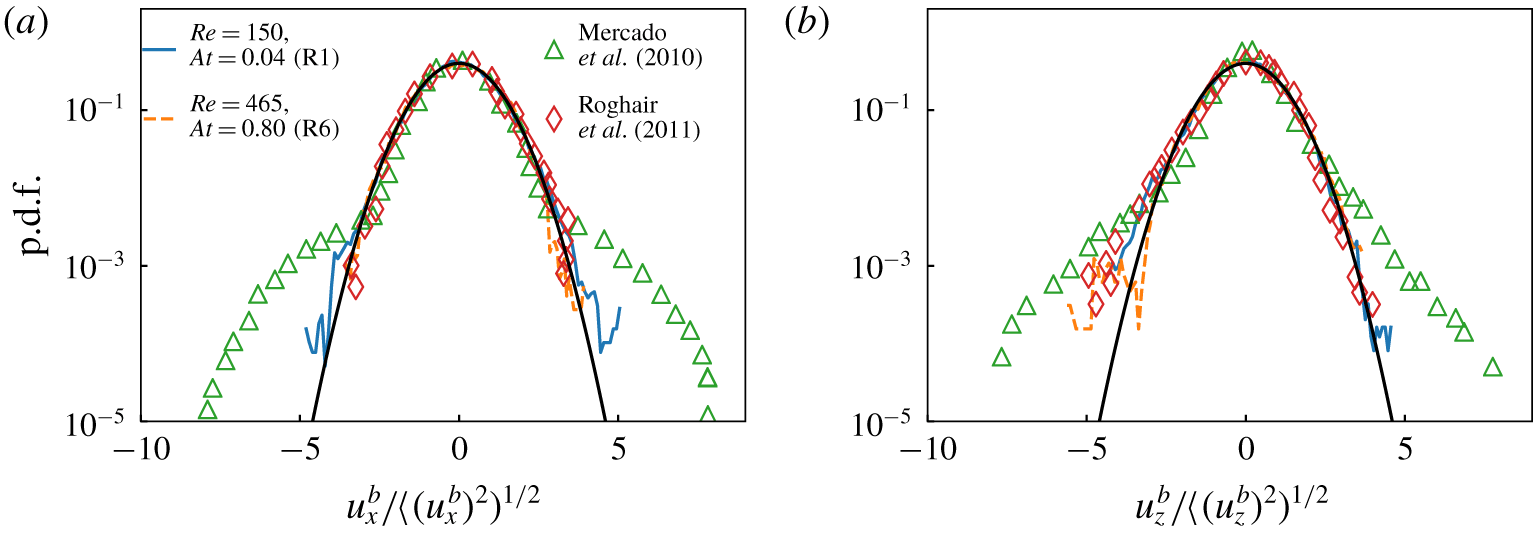
By tracking the individual bubble trajectories we obtain their centre-of-mass velocity  $\boldsymbol{u}^{b}$. In agreement with the earlier simulations of Roghair et al. (Reference Roghair, Mercado, Annaland, Kuipers, Sun and Lohse2011), the p.d.f.s of the bubble velocity fluctuation are Gaussian (see figure 5). The departure in the tail of the distribution is most probably because of the presence of large-scale structures observed in experiments that are absent in simulations with periodic boundaries (Roghair et al. Reference Roghair, Mercado, Annaland, Kuipers, Sun and Lohse2011).
The probability distribution function of the (a) horizontal component and (b) vertical component of the liquid velocity fluctuations for runs given in table 1. The p.d.f.s obtained from our DNS are in excellent agreement with the experimental data of Riboux et al. (Reference Riboux, Risso and Legendre2010) (data extracted using Engauge https://markummitchell.github.io/engauge-digitizer/).

The probability distribution function of (a) the horizontal and (b) the vertical component of the bubble velocity fluctuations for runs  $\mathtt{R1}$ and
 $\mathtt{R6}$ (see table 1). The experimental data of Mercado et al. (Reference Mercado, Gómez, Gils, Sun and Lohse2010) and numerical results of Roghair et al. (Reference Roghair, Mercado, Annaland, Kuipers, Sun and Lohse2011) are also shown for comparison. The black continuous line represents a Gaussian distribution.

3.4 Energy spectra and scale-by-scale budget
In the following, we study the energy spectrum
 $$\begin{eqnarray}\displaystyle E_{k}^{uu}\equiv \mathop{\sum }_{k-1/2<m<k+1/2}|\hat{\boldsymbol{u}}_{m}|^{2}, & & \displaystyle\end{eqnarray}$$
the co-spectrum
 $$\begin{eqnarray}\displaystyle E_{k}^{\unicode[STIX]{x1D70C}uu}\equiv \mathop{\sum }_{k-1/2<m<k+1/2}\Re [\hat{(\unicode[STIX]{x1D70C}\boldsymbol{u})}_{-m}\hat{\boldsymbol{u}}_{m}]\equiv \text{d}\mathscr{E}/\text{d}k, & & \displaystyle\end{eqnarray}$$
and the scale-by-scale energy budget. Our derivation of the energy budget is similar to Frisch (Reference Frisch1997) and Pope (Reference Pope2012). For a general field  $f(\boldsymbol{x})$, we define a corresponding coarse-grained field (Frisch Reference Frisch1997)
 $f_{k}^{{<}}(\boldsymbol{x})\equiv \sum _{m\leqslant k}f_{\boldsymbol{m}}\exp (\text{i}\boldsymbol{m}\boldsymbol{\cdot }\boldsymbol{x})$ with the filtering length scale
 $\ell =2\unicode[STIX]{x03C0}/k$. Using the above definitions in (2.1a), we get the energy budget equation
 $$\begin{eqnarray}\unicode[STIX]{x2202}_{t}\mathscr{E}_{k}+\unicode[STIX]{x1D6F1}_{k}+\mathscr{F}_{k}^{\unicode[STIX]{x1D70E}}=\mathscr{P}_{k}-\mathscr{D}_{k}+\mathscr{F}_{k}^{g}.\end{eqnarray}$$
Here,  $2\mathscr{E}_{k}=\langle \boldsymbol{u}_{k}^{{<}}\boldsymbol{\cdot }(\unicode[STIX]{x1D70C}\boldsymbol{u})_{k}^{{<}}\rangle$ is the cumulative energy up to wavenumber
 $k$,
 $2\unicode[STIX]{x1D6F1}_{k}=\langle (\unicode[STIX]{x1D70C}\boldsymbol{u})_{k}^{{<}}\boldsymbol{\cdot }(\boldsymbol{u}\boldsymbol{\cdot }\unicode[STIX]{x1D735}\boldsymbol{u})_{k}^{{<}}\rangle +\langle \boldsymbol{u}_{k}^{{<}}\boldsymbol{\cdot }(\boldsymbol{u}\boldsymbol{\cdot }\unicode[STIX]{x1D735}\unicode[STIX]{x1D70C}\boldsymbol{u})_{k}^{{<}}\rangle$ is the energy flux through wavenumber
 $k$,
 $2\mathscr{D}_{k}=-[\langle (\unicode[STIX]{x1D70C}\boldsymbol{u})_{k}^{{<}}\boldsymbol{\cdot }(\unicode[STIX]{x1D735}\boldsymbol{\cdot }[2\unicode[STIX]{x1D707}\unicode[STIX]{x1D64E}]/\unicode[STIX]{x1D70C})_{k}^{{<}}\rangle +\langle \boldsymbol{u}_{k}^{{<}}\boldsymbol{\cdot }(\unicode[STIX]{x1D735}\boldsymbol{\cdot }[2\unicode[STIX]{x1D707}\unicode[STIX]{x1D64E}])_{k}^{{<}}\rangle ]$ is the cumulative energy dissipated up to
 $k$,
 $2\mathscr{F}_{k}^{\unicode[STIX]{x1D70E}}=-[\langle (\unicode[STIX]{x1D70C}\boldsymbol{u})_{k}^{{<}}\boldsymbol{\cdot }(\boldsymbol{F}^{\unicode[STIX]{x1D70E}}/\unicode[STIX]{x1D70C})_{k}^{{<}}\rangle +\langle \boldsymbol{u}_{k}^{{<}}\boldsymbol{\cdot }(\boldsymbol{F}^{\unicode[STIX]{x1D70E}})_{k}^{{<}}\rangle ]$ is the cumulative energy transferred from the bubble surface tension to the fluid up to
 $k$, and
 $2\mathscr{F}_{k}^{g}=\langle (\unicode[STIX]{x1D70C}\boldsymbol{u})_{k}^{{<}}\boldsymbol{\cdot }(\boldsymbol{F}^{g}/\unicode[STIX]{x1D70C})_{k}^{{<}}\rangle +\langle \boldsymbol{u}_{k}^{{<}}\boldsymbol{\cdot }(\boldsymbol{F}^{g})_{k}^{{<}}\rangle$ is cumulative energy injected by buoyancy up to
 $k$. In a crucial departure from the uniform density flows, we find a non-zero cumulative pressure contribution
 $2\mathscr{P}_{k}=\langle (\unicode[STIX]{x1D70C}\boldsymbol{u})_{k}^{{<}}\boldsymbol{\cdot }(\unicode[STIX]{x1D735}p/\unicode[STIX]{x1D70C})_{k}^{{<}}\rangle$.
In the Boussinesq regime (small  $At$), the individual terms in the scale-by-scale budget simplify to their uniform density analogues:
 $\mathscr{E}_{k}=\unicode[STIX]{x1D70C}_{a}\langle \boldsymbol{u}_{k}^{{<}}\boldsymbol{\cdot }\boldsymbol{u}_{k}^{{<}}\rangle /2$,
 $\unicode[STIX]{x1D6F1}_{k}=\unicode[STIX]{x1D70C}_{a}\langle \boldsymbol{u}_{k}^{{<}}\boldsymbol{\cdot }(\boldsymbol{u}\boldsymbol{\cdot }\unicode[STIX]{x1D735}\boldsymbol{u})_{k}^{{<}}\rangle$,
 $\mathscr{D}_{k}=-\unicode[STIX]{x1D707}\langle |\unicode[STIX]{x1D735}\boldsymbol{u}_{k}^{{<}}|^{2}\rangle$,
 $\mathscr{F}_{k}^{\unicode[STIX]{x1D70E}}=-\langle \boldsymbol{u}_{k}^{{<}}\boldsymbol{\cdot }(\boldsymbol{F}^{\unicode[STIX]{x1D70E}})_{k}^{{<}}\rangle$,
 $\mathscr{F}_{k}^{g}=\langle \boldsymbol{u}_{k}^{{<}}\boldsymbol{\cdot }(\boldsymbol{F}^{g})_{k}^{{<}}\rangle$, and
 $\mathscr{P}_{k}=0$.
3.4.1 Low- $At$ (runs $\mathtt{R1}{-}\mathtt{R4}$)


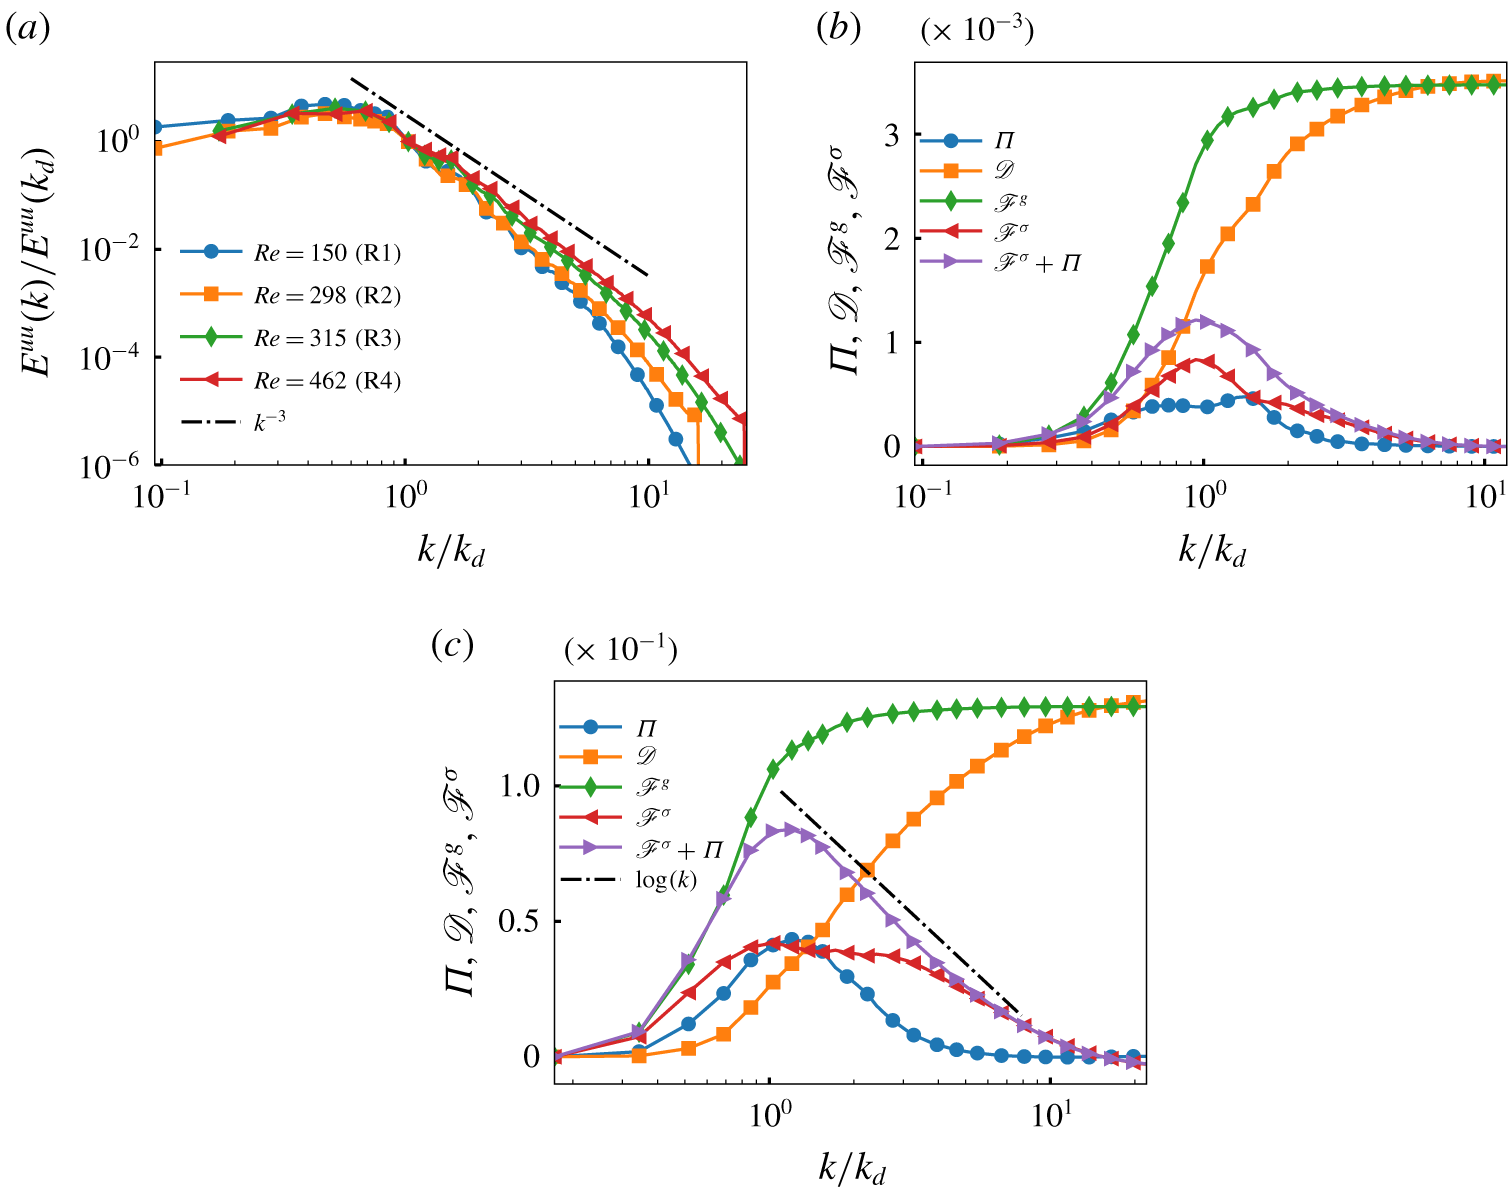
We first discuss the results for the Boussinesq regime (low  $At$). For scales smaller than the bubble diameter (
 $k>k_{d}$), the energy spectrum (figure 6a) shows a power-law behaviour
 $E(k)\sim k^{-\unicode[STIX]{x1D6FD}}$ for different
 $Re$. The exponent
 $\unicode[STIX]{x1D6FD}=4$ for
 $Re=150$ – it decreases on increasing
 $Re$ and becomes close to
 $\unicode[STIX]{x1D6FD}=3$ for the largest value
 $Re=462$.
We now investigate the dominant balances using the scale-by-scale energy budget analysis. In the statistically steady state  $\unicode[STIX]{x2202}_{t}\mathscr{E}_{k}=0$ and
 $\unicode[STIX]{x1D6F1}_{k}+\mathscr{F}_{k}^{\unicode[STIX]{x1D70E}}=-\mathscr{D}_{k}+\mathscr{F}_{k}^{g}$ (note that
 $\mathscr{P}_{k}=0$ for low
 $At$). In figures 6(b) and 6(c) we plot different contributions to the cumulative energy budget for
 $Re=150$ and
 $Re=462$ and make the following observations:
(i) The cumulative energy injected by buoyancy
$\mathscr{F}_{k}^{g}$ saturates around $k\approx k_{d}$. Thus buoyancy injects energy at scales comparable to and larger than the bubble diameter.(ii) The energy flux
$\unicode[STIX]{x1D6F1}_{k}>0$ around $k\approx k_{d}$ and vanishes for $k\gg k_{d}$.(iii) Especially for scales smaller than the bubble diameter, the cumulative energy transfer from the bubble surface tension to the fluid is the dominant energy transfer mechanism.
(iv) Consistent with the earlier predictions (Riboux et al. Reference Riboux, Risso and Legendre2010), for our highest
$Re=462$, simulation provides direct evidence that the balance of total production $\text{d}(\unicode[STIX]{x1D6F1}_{k}+\mathscr{F}_{k}^{\unicode[STIX]{x1D70E}})/\text{d}k\sim k^{-1}$ with viscous dissipation [$\text{d}\mathscr{D}_{k}/\text{d}k=\unicode[STIX]{x1D708}k^{2}E(k)$] gives the pseudo-turbulence spectra $E(k)\sim k^{-3}$ (Lance & Bataille Reference Lance and Bataille1991; Riboux et al. Reference Riboux, Risso and Legendre2010; Roghair et al. Reference Roghair, Mercado, Annaland, Kuipers, Sun and Lohse2011).


Our scale-by-scale analysis, therefore, suggests the following mechanism of pseudo-turbulence. Buoyancy injects energy at scales comparable to and larger than the bubble size. A part of the energy injected by buoyancy is absorbed in stretching and deformation of the bubbles and another fraction is transferred via wakes to scales comparable to the bubble diameter. Similar to polymers in turbulent flows Perlekar, Mitra & Pandit (Reference Perlekar, Mitra and Pandit2006, Reference Perlekar, Mitra and Pandit2010), Valente, da Silva & Pinho (Reference Valente, da Silva and Pinho2014), the relaxation of the bubbles leads to injection of energy at scales smaller than the bubble diameter.
Note that for low  $At$, Boussinesq regime
 $\unicode[STIX]{x1D70C}=\unicode[STIX]{x1D70C}_{a}$, there is no distinction between a droplet and a bubble. Therefore, our results for low-
 $At$ buoyancy-driven bubbly flows are equally valid for a suspension of sedimenting droplets.
(a) The log–log plot of the energy spectra  $E_{k}^{uu}$ versus
 $k/k_{d}$ for our high-
 $Re$, low-
 $At$ runs
 $\mathtt{R1}$–
 $\mathtt{R4}$. Dash-dotted line indicates
 $k^{-3}$ scaling. (b, c) Cumulative contribution of viscous dissipation
 $\mathscr{D}_{k}$, energy injected because of buoyancy
 $\mathscr{F}_{k}^{g}$ and the surface tension contribution
 $\mathscr{F}_{k}^{\unicode[STIX]{x1D70E}}$ versus
 $k/k_{d}$ for (b) run
 $\mathtt{R1}$ and (c) run
 $\mathtt{R4}$. Note that, for
 $k>k_{d}$, the balance between
 $\text{d}\mathscr{F}_{k}^{\unicode[STIX]{x1D70E}}/\text{d}k$ and
 $\text{d}\mathscr{D}_{k}/\text{d}k$ is more prominent in (c) compared to (b).

3.4.2 High-$At$ (runs $\mathtt{R5}{-}\mathtt{R7}$)


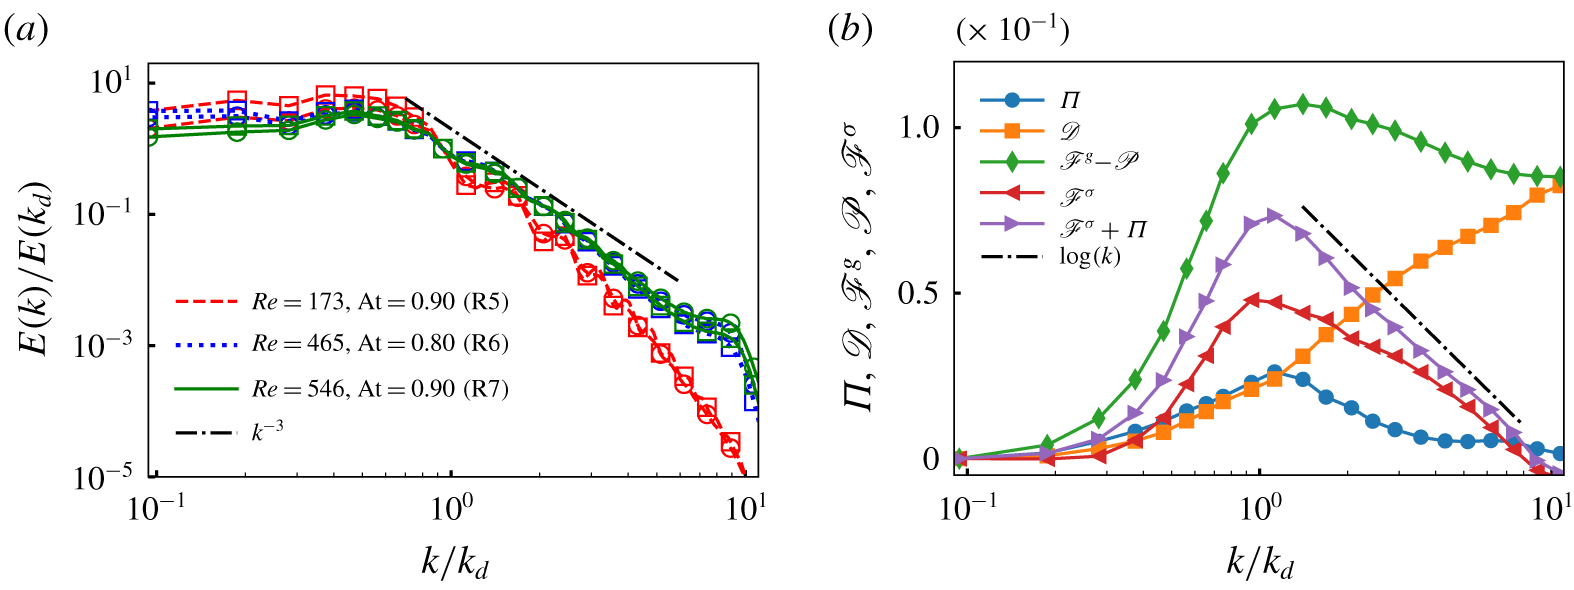
Similar to the earlier section, here also the energy spectrum and the co-spectrum show a scaling of  $k^{-3}$ at high
 $Re=546$ (Roghair et al. Reference Roghair, Mercado, Annaland, Kuipers, Sun and Lohse2011) and the spectrum becomes steeper
 $E(k)\sim k^{-3.6}$ (Bunner & Tryggvason Reference Bunner and Tryggvason2002b) on decreasing to
 $Re=173$ (figure 7a). However, because of density variations, the scale-by-scale energy budget becomes more complex. Now, in the statistically steady state,
 $\unicode[STIX]{x1D6F1}_{k}+\mathscr{F}_{k}^{\unicode[STIX]{x1D70E}}=\mathscr{P}_{k}-\mathscr{D}_{k}+\mathscr{F}_{k}^{g}$.
In figure 7(b) we plot the scale-by-scale energy budget for our high- $At$ run
 $\mathtt{R6}$. We find that the cumulative energy injected by buoyancy and the pressure contribution
 $\mathscr{F}_{k}^{g}+\mathscr{P}_{k}$ reaches a peak around
 $k\approx k_{d}$ and then decrease mildly to
 $\unicode[STIX]{x1D716}_{inj}$. Similar to the low-
 $At$ case, we find a non-zero energy flux for
 $k\approx k_{d}$ and a dominant surface-tension contribution to the energy budget for
 $k\gg k_{d}$. Finally, similar to the previous section, for
 $k>k_{d}$ the net production
 $\text{d}(\unicode[STIX]{x1D6F1}+\mathscr{F}^{\unicode[STIX]{x1D70E}})/\text{d}k\sim k^{-1}$ balances the viscous dissipation
 $\unicode[STIX]{x1D708}k^{2}E(k)$ to give
 $E(k)\sim k^{-3}$.
(a) The log–log plot of the energy spectra (○)  $E_{k}^{uu}$ and co-spectrum (▫)
 $E_{k}^{\unicode[STIX]{x1D70C}uu}$ versus
 $k/k_{d}$ for our high-
 $Re$, high-
 $At$ runs
 $\mathtt{R5}$–
 $\mathtt{R7}$. Dash-dotted line indicates
 $k^{-3}$ scaling. (b) Cumulative contribution of the viscous dissipation
 $\mathscr{D}_{k}$, the contribution due to buoyancy and pressure
 $\mathscr{F}_{k}^{g}{-}\mathscr{P}_{k}$, the energy flux
 $\unicode[STIX]{x1D6F1}_{k}$ and the surface-tension contribution
 $\mathscr{F}_{k}^{\unicode[STIX]{x1D70E}}$ versus
 $k/k_{d}$ for run
 $\mathtt{R6}$.

3.4.3 Frequency spectrum of pseudo-turbulence
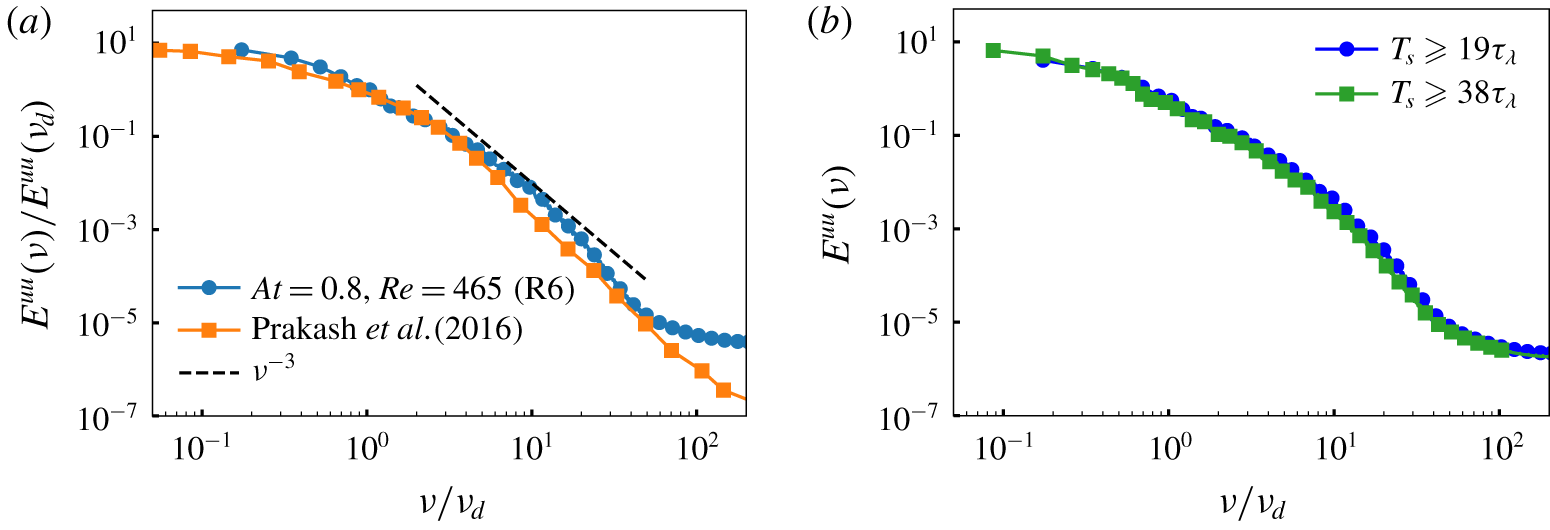
To investigate the frequency spectrum of pseudo-turbulence, we now conduct a time-series analysis similar to Roghair et al. (Reference Roghair, Mercado, Annaland, Kuipers, Sun and Lohse2011) and Prakash et al. (Reference Prakash, Mercado, van Wijngaarden, Mancilla, Tagawa, Lohse and Sun2016) for our high  $At=0.8$, high
 $Re=465$ run
 $\mathtt{R6}$. We monitor the time evolution of the three components of the velocity and the density
 $\unicode[STIX]{x1D70C}$ for time
 $T=90\unicode[STIX]{x1D70F}_{\unicode[STIX]{x1D706}}$, with sampling time
 $8\times 10^{-3}\unicode[STIX]{x1D70F}_{\unicode[STIX]{x1D706}}$, on 323 equally spaced Eulerian points within our simulation domain. From these signals, we select continuous segments of liquid velocity fluctuations of size
 $T_{s}\geqslant 19\unicode[STIX]{x1D70F}_{\unicode[STIX]{x1D706}}$ and ignore regions where
 $\unicode[STIX]{x1D70C}=\unicode[STIX]{x1D70C}_{b}$. We then use the Welch method, with Hamming windows, to obtain the energy spectrum (Welch Reference Welch1967; Prakash et al. Reference Prakash, Mercado, van Wijngaarden, Mancilla, Tagawa, Lohse and Sun2016). In figure 8(a) we plot the liquid velocity spectrum
 $E(\unicode[STIX]{x1D708})$ versus
 $\unicode[STIX]{x1D708}/\unicode[STIX]{x1D708}_{d}$ and find it to be in excellent agreement with the experiments of Prakash et al. (Reference Prakash, Mercado, van Wijngaarden, Mancilla, Tagawa, Lohse and Sun2016). In figure 8(b) we show that the normalized energy spectrum is not modified on doubling
 $T_{s}\geqslant 38\unicode[STIX]{x1D70F}_{\unicode[STIX]{x1D706}}$. Similar to Roghair et al. (Reference Roghair, Mercado, Annaland, Kuipers, Sun and Lohse2011), Prakash et al. (Reference Prakash, Mercado, van Wijngaarden, Mancilla, Tagawa, Lohse and Sun2016) and Alméras et al. (Reference Alméras, Mathai, Lohse and Sun2017) we find that
 $E(\unicode[STIX]{x1D708})\sim \unicode[STIX]{x1D708}^{-3}$ for frequencies
 $\unicode[STIX]{x1D708}>\unicode[STIX]{x1D708}_{d}$, where
 $\unicode[STIX]{x1D708}_{d}=\langle U\rangle /2\unicode[STIX]{x03C0}d$ (Prakash et al. Reference Prakash, Mercado, van Wijngaarden, Mancilla, Tagawa, Lohse and Sun2016).
(a) Kinetic energy spectrum of the liquid velocity fluctuations  $E(\unicode[STIX]{x1D708})$ versus
 $\unicode[STIX]{x1D708}/\unicode[STIX]{x1D708}_{d}$ for our run
 $\mathtt{R6}$. We also overlay the spectrum obtained from the experiments of Prakash et al. (Reference Prakash, Mercado, van Wijngaarden, Mancilla, Tagawa, Lohse and Sun2016) and find it to be in excellent agreement with our numerical simulation. (b) Comparison of the normalized energy spectrum obtained from liquid velocity segments of length
 $T_{s}\geqslant 19\unicode[STIX]{x1D70F}_{\unicode[STIX]{x1D706}}$ (
 $1.9\times 10^{4}$ trajectories) and
 $38\unicode[STIX]{x1D70F}_{\unicode[STIX]{x1D706}}$ (
 $5\times 10^{3}$ trajectories).

3.5 Length scales of pseudo-turbulence
We have used bubble diameter as a relevant scale of pseudo-turbulence (Mendez-Diaz et al. Reference Mendez-Diaz, Serrano-Garcia, Zenit and Hernández-Cordero2013; Prakash et al. Reference Prakash, Mercado, van Wijngaarden, Mancilla, Tagawa, Lohse and Sun2016). Riboux et al. (Reference Riboux, Risso and Legendre2010) proposed an alternative length scale  $\unicode[STIX]{x1D6EC}\propto V_{0}^{2}/g=4\unicode[STIX]{x1D6FF}\unicode[STIX]{x1D70C}d/(3\unicode[STIX]{x1D70C}_{f}C_{d0})$, where
 $V_{0}$ is the single bubble rise velocity and
 $C_{d0}$ is the drag coefficient of an isolated bubble. Note that for large
 $At$,
 $\unicode[STIX]{x1D6FF}\unicode[STIX]{x1D70C}/\unicode[STIX]{x1D70C}_{f}\approx 1$. In table 2 we present values of
 $d$ and
 $\unicode[STIX]{x1D6EC}$ obtained from our numerical simulations
 $\mathtt{R1}{-}\mathtt{R7}$. For our large-
 $At$ runs, we find that bubble diameter is comparable to
 $\unicode[STIX]{x1D6EC}$ (
 $d/\unicode[STIX]{x1D6EC}\approx 0.4{-}0.6$). On the other hand, for our small-
 $At$ runs,
 $d/\unicode[STIX]{x1D6EC}\approx 4{-}6$, indicating that
 $k_{\unicode[STIX]{x1D6EC}}/k_{d}$ lies near the end of the
 $k^{-3}$ scaling range. Thus
 $\unicode[STIX]{x1D6EC}$ does not capture the beginning of the
 $k^{-3}$ scaling for our low-
 $At$ runs.
Length scale  $\unicode[STIX]{x1D6EC}\propto V_{0}^{2}/g=4\unicode[STIX]{x1D6FF}\unicode[STIX]{x1D70C}d/(3\unicode[STIX]{x1D70C}_{f}C_{d0})$ and the ratio
 $d/\unicode[STIX]{x1D6EC}$ for our runs R1–R7.

3.6 Clustering of bubbles
Using Voronoi analysis, Tagawa et al. (Reference Tagawa, Roghair, Prakash, van Sint Annaland, Kuipers, Sun and Lohse2013) investigated clustering in bubbly flows with varying  $Re$, surface tension
 $\unicode[STIX]{x1D70E}$ and
 $d/L$ for
 $\unicode[STIX]{x1D719}=5\,\%{-}40\,\%$. They observed that the clustering depends on the deformability of the bubbles. To investigate clustering in our numerical study on dilute bubbly flows (
 $\unicode[STIX]{x1D719}=1.7\,\%{-}2.6\,\%$), we repeated the analysis of Tagawa et al. (Reference Tagawa, Roghair, Prakash, van Sint Annaland, Kuipers, Sun and Lohse2013) for our runs
 $\mathtt{R1}{-}\mathtt{R7}$. From the bubble centre-of-mass positions, we construct Voronoi tesselations using the Voro++ library (Rycroft Reference Rycroft2009). We then evaluate the standard deviation
 $\unicode[STIX]{x1D6F4}$ of the Voronoi volumes obtained from the steady-state bubble configurations. We also generate 200 configurations of randomly positioned, non-overlapping,
 $N_{b}$ bubbles of diameter
 $d$ in a box of length
 $L$. Using the Voronoi tesselation of these random configurations, we evaluate the standard deviation
 $\unicode[STIX]{x1D6F4}_{rnd}$. The ratio
 ${\mathcal{C}}\equiv \unicode[STIX]{x1D6F4}/\unicode[STIX]{x1D6F4}_{rnd}$ gives an indication of the bubble clustering. Note that
 ${\mathcal{C}}<1$ for a regular lattice arrangement,
 ${\mathcal{C}}=1$ for a random arrangement, and
 ${\mathcal{C}}>1$ for irregular clustering (Tagawa et al. Reference Tagawa, Roghair, Prakash, van Sint Annaland, Kuipers, Sun and Lohse2013). We observe random or weakly irregular clustering for our runs
 $\mathtt{R1}{-}\mathtt{R6}$ (see table 3). For our high-
 $Re$, high-
 $At$ run R7,
 ${\mathcal{C}}=0.9$, which indicates a weakly regular lattice arrangement of bubbles. Therefore, for our simulations with
 $\unicode[STIX]{x1D719}=1.7\,\%{-}2.6\,\%$, we do not observe any systematic effect of clustering on the energy spectrum.
The clustering indicator  ${\mathcal{C}}$ for our runs R1–R7.

4 Conclusion
To conclude, we have investigated the statistical properties of velocity fluctuations in pseudo-turbulence generated by buoyancy-driven bubbly flows. The  $Re$ values that we have explored are consistent with the range
 $Re\sim [300{-}1000]$ used in the experiments (Riboux et al. Reference Riboux, Risso and Legendre2010; Mendez-Diaz et al. Reference Mendez-Diaz, Serrano-Garcia, Zenit and Hernández-Cordero2013; Prakash et al. Reference Prakash, Mercado, van Wijngaarden, Mancilla, Tagawa, Lohse and Sun2016). Our numerical simulations show that the shape of the p.d.f. of the velocity fluctuations is consistent with experiments over a wide range of
 $Re$ and
 $At$ numbers. For large
 $Re$, and for low as well as high
 $At$, the energy spectrum shows a
 $E(k)\sim k^{-3}$ scaling (Roghair et al. Reference Roghair, Mercado, Annaland, Kuipers, Sun and Lohse2011). However, on reducing
 $Re$, the spectrum becomes steeper
 $E(k)\sim k^{-4}$ (Bunner & Tryggvason Reference Bunner and Tryggvason2002b). We observe a non-zero positive energy flux for scales comparable to the bubble diameter. Our scale-by-scale energy budget validates the theoretical prediction that the net production balances viscous dissipation to give
 $E(k)\sim k^{-3}$.
Experiments on pseudo-turbulence have investigated the liquid velocity fluctuations either within the bubble swarm (Larue De Tournemine Reference Larue De Tournemine2001; Mercado et al. Reference Mercado, Gómez, Gils, Sun and Lohse2010; Mendez-Diaz et al. Reference Mendez-Diaz, Serrano-Garcia, Zenit and Hernández-Cordero2013; Prakash et al. Reference Prakash, Mercado, van Wijngaarden, Mancilla, Tagawa, Lohse and Sun2016) or in the wake of the bubble swarm (Riboux et al. Reference Riboux, Risso and Legendre2010). All these experiments show a robust  $-3$ spectrum. However, Riboux et al. (Reference Riboux, Risso and Legendre2010) also observed that the
 $-3$ spectrum is followed by nearly half a decade of
 $-5/3$ spectrum. A similar observation, albeit for a much smaller scaling range, was also made by Mendez-Diaz et al. (Reference Mendez-Diaz, Serrano-Garcia, Zenit and Hernández-Cordero2013). Consistent with bubble swarm experiments (Larue De Tournemine Reference Larue De Tournemine2001; Mercado et al. Reference Mercado, Gómez, Gils, Sun and Lohse2010; Prakash et al. Reference Prakash, Mercado, van Wijngaarden, Mancilla, Tagawa, Lohse and Sun2016), we do not observe a
 $-5/3$ spectrum. A plausible reason for the observed discrepancy, as indicated by Riboux et al. (Reference Riboux, Risso and Legendre2010), could be that strong flows generated in the vicinity of the bubbles are absent in the wake of the bubble swarm.
Acknowledgements
We thank D. Mitra and S. Banerjee for discussions. This work was supported by research grant no. ECR/2018/001135 from SERB, DST (India).
Supplementary movies
Supplementary movies are available at https://doi.org/10.1017/jfm.2019.991.