Implications
Higher lipid deposition (LD) rather than decreased protein deposition (PD) seems to be the origin of increased fatness and reduced feed efficiency of immunocastrated (IC) pigs as compared with entire males (EM). After IC, dietary energy content should be reduced to conserve the advantage of EM for lean meat percentage. In addition, dietary CP content could be decreased after IC to reduce N emissions.
Introduction
Surgical castration without pain relief, traditionally used in fattening male pigs to prevent development of boar taint, is being questioned from an ethical, welfare and also economical point of view (Bonneau, Reference Bonneau1998). To replace current practice, IC could be used. It stimulates natural immune system of the pig to produce antibodies against gonadotropin-releasing hormone (GnRH) and by that blocks hypothalamic–pituitary–gonadal axis and further sexual development (Caraty and Bonneau, Reference Caraty and Bonneau1986). After administering two doses of vaccine, containing an incomplete analogue of GnRH conjugated to a carrier protein, at least 4 weeks apart, testicular steroids drop sharply and physiological effects of IC are expressed in the week following revaccination (V2) (Claus et al., Reference Claus, Lacorn, Danowski, Pearce and Bauer2007). This transition from EM to castrate-like status after IC, leads to major changes in the performances of the pigs. As demonstrated in recently published meta-analyses (Batorek et al., Reference Batorek, Čandek-Potokar, Bonneau and van Milgen2012; Dunshea at al., Reference de Lange, van Milgen, Noblet, Dubois and Birkett2013), the most pronounced effect is an increase in feed intake associated with a faster growth, increased LD and reduced feed efficiency. This would indicate that IC does not affect daily PD, but only increases daily LD. Therefore, the objective of the present study was to modify lipid metabolism of male pigs from two perspectives: (i) to evaluate the changes following IC (due to combined effects of IC, age and increased feed intake of IC pigs), and (ii) to test if a high lipid diet further stimulates LD in IC pigs. For that purpose, N and energy balance techniques were used to determine the partitioning of retained energy (RE) between PD and LD, on the same pigs before and after V2 with Improvac®.
Material and methods
The experiment was supervised by E. Labussière (authorization no. 35-110) and performed in accordance with French laws on animal experimentation.
Experimental design
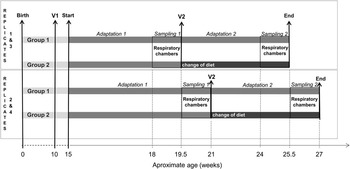
Eight cross-bred IC male pigs (Piétrain×(Large White×Landrace)) from INRA experimental herd (Saint-Gilles, France) were used in this study. The experiment was designed to evaluate the effect of IC in combination with two dietary lipid contents on PD, LD and heat production (HP) in male pigs. This study was carried out in four replicates, each composed of two littermates which were divided in groups 1 and 2 to be fed low-fat (LF) or high-fat diet (HF) after IC, respectively (Figure 1). The measurements were performed in two successive stages: before (stage 1) and after V2 (i.e. effective IC; stage 2) with Improvac® (Zoetis Florham Park, NJ, USA). Each stage consisted of an adaptation period (3 to 5 weeks) followed by 9 days of N and energy balance measurements. At the end of each measurement period, pigs were fasted for 1 day to measure their fasting HP. Individual measurements of littermates were recorded simultaneously in two 12 m3 open-circuit respiration chambers described by van Milgen et al. (Reference van Milgen, Noblet and Dubois1997). In the respiration chamber, each pig was kept in an individual metabolic cage; the trough was placed on a load cell to measure the time, size and duration of each meal and water was freely available from low-pressure water nipple drinkers. The cage was additionally equipped with force sensors to record physical activity of the pig (Quiniou et al., Reference Quiniou, Noblet, van Milgen and Dubois2001). The temperature (24°C) and relative humidity (70%) were kept constant and light was switched on between 0800 and 2000 h.
Experimental design showing start and end of the experiment performed in four replicates divided into two adaptation periods (Adaptation 1 and Adaptation 2), each followed by 9 days of measurements in respiratory chambers (Sampling 1 and Sampling 2), first (V1) and second (V2) vaccination with Improvac®, two experimental groups (group 1 and group 2) and change of diet in group 2 after V2.

Vaccination with Improvac® was performed according to the producer’s instructions (2 ml, s.c.). The first dose was administered before the start of the experiment (at the age of 10 weeks) and the second dose 4 to 5 weeks before starting the measurements of stage 2 (in replicates 1 and 3 at the age of 19 weeks and in replicates 2 and 4 at the age of 21 weeks).
Experimental diets and feed allowance
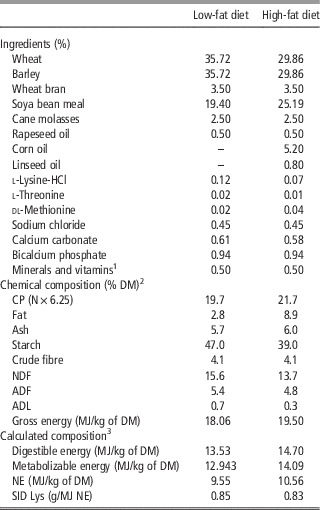
The LF diet was prepared with 0.5% rapeseed oil, resulting in a dietary fat content of 2.8% of dry matter (DM), whereas the HF diet was composed of the same basic ingredients but with 8.9% lipid content/DM achieved by addition of corn oil and linseed oil to have a C18:3 : C18:2 ratio equal to 0.16 in both diets. During stage 1, all pigs received the LF diet. Thereafter, a 7-day feed transition to the HF diet was applied in group 2. In both stages, pigs were restricted to 90% of predicted ad libitum net energy (NE) intake for growing pigs (adapted to BW and sex) that was estimated using InraPorc® model (van Milgen et al., Reference van Milgen, Valancogne, Dubois, Dourmad, Sève and Noblet2008). Individual daily feed allowances were prepared and feed was offered twice daily during the adaptation period or four times per day (at 0900, 1200, 1500 and 1800 h) during the measurement period. Water was provided ad libitum.
Measurements and sampling procedures
Pigs were weighed before they entered the respiration chambers and on the morning of the fasting day. During each measurement period, a sample of each diet was collected during the preparation of daily feed allowances for determination of DM content. The samples of each feed were subsequently pooled for each stage and stored at 4°C until further analyses. During the measurement period, feed refusals of each pig were collected daily, cumulated over the measurement period and analysed for their DM content. Faeces were collected daily, pooled per pig for the entire measurement period and stored at 4°C. Urine was collected daily in 10 l plastic tanks containing 120 ml of 10% sulphuric acid, weighed each morning and representative samples (2%) were taken, accumulated in plastic bottles and stored at 4°C until further laboratory analyses. At the end of each measurement period, total collected faeces were weighed, homogenized and three representative samples were taken; two of them were used for DM determination and the third sample was freeze-dried, ground and stored at 4°C until further laboratory analyses. To collect ammonia evaporated in the respiration chambers from urine, condensed water from the air conditioning system of the respiration chambers was collected in plastic tanks containing 120 ml of 10% sulphuric acid; a quantified aliquot of the outgoing air was also bubbled in a sulphuric acid solution during the entire balance period. Condensed water and bubbling solution were weighed, analysed for ammonia content and ammonia evaporation was calculated as described by Noblet et al. (Reference Noblet, Gilbert, Jaguelin-Peyraud and Lebrun1987). Feed consumption (using load cell placed under the trough), physical activity (using force sensors and IR barriers), gas concentrations (CO2, O2 and CH4) of outgoing air, ventilation rate and physical characteristics of the air in the respiration chambers (atmospheric pressure, temperature, relative humidity) were measured continuously (60 times/s), averaged over 10 s intervals and recorded for further calculations (van Milgen et al., Reference van Milgen, Noblet and Dubois1997).
Chemical analyses
Pooled diet samples of each stage were analysed for DM, ash, N, starch, crude fibre, crude fat with prior acid hydrolysis and gross energy (GE) according to Association of Official Analytical Chemistry (1990). The NDF, ADF and ADL contents of pooled diet samples were analysed according to van Soest et al. (Reference van Soest, Robertson and Lewis1991). Samples of faeces were analysed for DM, ash, N, crude fat with prior acid hydrolysis and GE contents according to the same methods as for diets. Fresh samples of urine were analysed for N content, whereas GE content was measured after freeze-drying 30 ml of urine in polyethylene bags. The ammonia contents in bubbling solution and condensed water were determined using an enzymatic method (EnzytecTM Fluid Ammonia; Thermo Fisher Scientific Oy, Vantaa, Finland). Assuming a converting factor of 6.25, CP content was calculated from N content.
Calculations
Average daily gain (ADG) for the balance period was calculated using BW on the morning of the 1st day in respiration chambers and BW on the morning of the fasting day. DM intake and apparent digestibility coefficients of organic matter, N, GE and fat were calculated according to standard procedures. N retention was calculated as the difference between N intake and N losses in faeces and urine (including N losses as ammonia in condensed water and outgoing air of the respiration chambers). Respiratory quotient was the ratio between CO2 production and O2 consumption. Total HP was calculated according to Brouwer (Reference Brouwer1965) from O2 consumption, CO2 and CH4 production, and urinary N losses calculated as the sum of N recovered in the urine and evaporated as ammonia. The 1st day in the respiration chambers was considered as an adaptation day and was not included in the calculation of HP and nutrient balance. Total RE during the balance period was calculated as the difference between GE intake and energy losses in faeces, urine, methane and HP. With regard to RE as protein, it was calculated from N balance taking into account that energy in PD (N retention×6.25) equals 23.6 kJ/g. Energy retained as LD was calculated as the difference between total RE and RE as protein; LD (g) calculation assumed that the energy content of LD equals 39.7 kJ/g. Oxidation of nutrients and their contribution to LD were calculated according to Chwalibog et al. (Reference Chwalibog, Jakobsen, Henckel and Thorbek1992) from N excreted in urine (oxidation of proteins) or from gas exchange measurements (oxidation of carbohydrate and fat). The values obtained for the oxidation of carbohydrates and fat were interpreted as ‘apparent values’, corrected for apparent oxidation of lipids, because the respiratory quotient unrelated to protein oxidation was above 1.0, which caused oxidation of fat to be negative. The RE as fat originating from dietary carbohydrates, proteins and fats was expressed in percentage of total LD and subsequently recalculated in kJ/kg of BW0.60 per day. The model of van Milgen et al. (Reference van Milgen, Noblet and Dubois1997) was used to calculate the components of HP using data from gas exchange, signals of force sensors and feed intake (time and ingested quantity of each meal) in respiration chambers. The HP due to physical activity, feed intake (short-term thermic effect of feeding), resting metabolism and fasting HP were calculated according to the formula of Brouwer (Reference Brouwer1965) from the respective volumes of O2 and CO2, which were determined by mathematical modelling of gas exchanges. The difference between HP due to resting and fasting was considered as long-term thermic effect of feeding. Total thermic effect of feeding was calculated as the sum of short- and long-term thermic effect of feeding. In addition, HP and its components were corrected for differences in physical activity among animals in each replicate (assuming constant ratio between activity HP and metabolizable energy (ME) throughout the experiment) as described by Labussière et al. (Reference Labussière, Dubois, van Milgen and Noblet2011). NE was calculated as the sum of total RE and fasting HP. All energy measurements were expressed relative to BW0.60 (Noblet et al., Reference Noblet, Henry and Dubois1999).
Statistical analyses
In the present study, measurements of N and energy balances, respiratory quotient, nutrient deposition and BW gain composition were taken on the same experimental subject (pig, n=8) over time (stage, n=2). To present least squares means the ANOVA was performed using mixed model procedure of SAS (PROC MIXED; SAS Institute, Cary, NC, USA) with nested design including fixed effects of stage and group within stage and the random effect of pig. Due to the fact that both experimental groups received the same treatment in stage 1, and thus the absence of difference between groups 1 and 2 in stage 1, the results (least squares means) for this stage are presented as their average values. To determine the changes between stage 1 and stage 2 due to combined effects of IC, growth and increased feed intake (IC/growth), the pigs on LF diet were compared in stage 1 and 2 (group 1 in stage 1 was contrasted to group 1 in stage 2). A contrast analysis was also used for evaluating the effect of HF diet by comparing group 1 and group 2 in stage 2.
Results
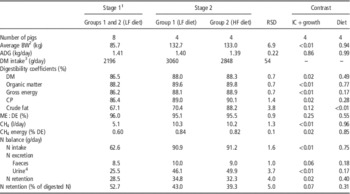
There were no major difficulties during the experiment. The chemical composition of the diets corroborated with the predicted one (Table 1). Experimental pigs increased their BW (P<0.01) over the experiment (i.e. with IC/growth), but their ADG during the balance periods did not differ between stages and diets and it averaged 1.40 kg/day (Table 2). According to the protocol, DM intake increased with stage, from 2196 g/day in stage 1 to 3060 and 2848 g/day for group 1 (LF diet) and group 2 (HF diet) in stage 2, respectively (Table 2).
Composition of experimental diets

DM=dry matter; NE=net energy; SID Lys=standardized ileal digestible lysine.
1 The mineral and vitamin mixture provided the following (/kg of diet): vitamin A, 5000 IU; vitamin D3, 1000 IU; vitamin E, 20 IU; vitamin B1, 2 mg; vitamin B2, 4 mg; pantothenic acid, 10 mg; vitamin B6, 1 mg; vitamin B12, 0.02 mg; niacin, 15 mg; vitamin K3, 2 mg; folic acid, 1 mg; biotin, 0.2 mg; choline chloride, 500 mg; Fe, 80 mg; Cu, 10 mg; Zn, 100 mg; Mg, 40 mg; Co, 0.1 mg; I, 0.2 mg; Se, 0.15 mg.
2 As-measured.
3 Values were calculated according to Sauvant et al. (Reference Sauvant, Perez and Tran2004) and subsequently adjusted for 89% DM content of the diet.
Digestive and metabolic utilization of energy and nutrients in male pigs before (stage 1; 7 days) and after (stage 2; 7 days) second vaccination with Improvac® according to dietary fat level

LF diet=low-fat diet; HF diet=high-fat diet; IC=immunocastration; IC+growth=effect evaluated as the difference between group 1 in stage 1 and group 1 in stage 2; Diet=effect evaluated as the difference between group 1 and group 2 in stage 2; ADG=average daily gain; DM=dry matter; ME=metabolizable energy; DE=digestible energy
For diet composition see Table 1.
1 Values were tested for effects of stage and group within stage (group (stage)); results are least squares (LS) means. Due to the absence of significant difference between groups 1 and 2 in stage 1, the LS means for this stage are presented as their averaged value.
2 Average of the BW taken in the morning of the 1st day and the morning of the fasting day.
3 According to experimental design, the DM intake increased between stage 1 and 2 to mimic the increase in voluntary feed intake after second vaccination reported for IC pigs.
4 Including ammonia evaporation.
Digestive utilization of nutrients and energy
Apparent digestibility coefficients of nutrients and GE were higher in stage 2 (Table 2). As demonstrated by contrast analysis, in the case of DM, organic matter, GE and CP, this increase due to IC/growth was in the range of 1.4 to 2.6 points (P⩽0.02). On the other hand, the difference in apparent digestibility of crude fat was not significant for IC/growth effect (3.3 points; P=0.12). Although methane emissions and subsequently energy loss as methane increased markedly with stage due to IC/growth (5.1 v. 10.3 l/day and 0.60% v. 0.84% of digestible energy (DE) in stage 1 and stage 2, respectively; P⩽0.02), ME : DE ratio averaged 95.6% (P=0.25).
Within stage 2, diet affected only crude fat digestibility (increase of 18 points; P<0.01; Table 2), whereas no effect of diet (P>0.10) was noted neither on the digestibility coefficients of DM, organic matter, GE or CP nor on methane emissions or ME : DE ratio.
Nitrogen and energy balance
An effect of IC/growth was noted on N balance data, resulting in higher N retention (28.5 v. 34.8 g/day in stages 1 and 2; P=0.04; Table 2); however, the relative N retention in stage 2 was lower (52.7% v. 43.0% of digested N in stages 1 and 2; P=0.07; Table 2).
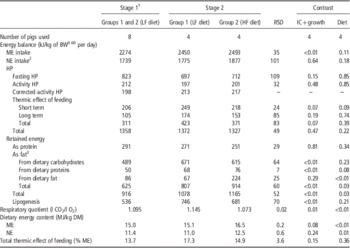
In agreement with the design of the study, the ME intake increased from 2274 to 2450 kJ/kg of BW0.60 per day between stages 1 and 2 to mimic IC/growth effect. On the other hand, NE intake did not differ between stage and group and it averaged 1757 kJ/kg of BW0.60 per day in stages 1 and 2 (P>0.05; Table 3). Despite the difference in ME intake, total HP remained similar in both stages (1365 kJ/kg of BW0.60 per day; P=0.47 for IC/growth effect; Table 3) in connection with numerically lower fasting HP that counterbalanced the higher thermic effect of feeding. As shown by contrast analysis, total thermic effect of feeding tended to increase (from 311 to 423 kJ/kg BW0.60 per day between stages 1 and 2; P=0.07; Table 3). The total thermic effect of feeding expressed as percentage of ME was similar regardless of IC/growth effect (15.5% of ME; P=0.15; Table 3) and the HP related to physical activity was also unchanged between stages (8% to 9% of ME intake; Table 3). As a consequence, total RE increased with stage due to IC/growth (from 916 to 1078 kJ/kg of BW0.60 per day; P<0.01; Table 3) that benefited exclusively to a higher RE as fat (from 625 to 807 kJ/kg BW0.60 per day; P<0.01; Table 3); RE as protein averaged 281 kJ/kg BW0.60 per day in stages 1 and 2 (P>0.10; Table 3). The origin of RE as fat increase with IC/growth was mainly from carbohydrates (from 489 to 671 kJ/kg BW0.60 per day; P<0.01; Table 3) and to a much lower extent from proteins (from 50 to 68 kJ/kg BW0.60 per day; P<0.01; Table 3). Accordingly, an increase with stage due to IC/growth was noted for lipogenesis (from 536 to 746 kJ/kg BW0.60 per day; P<0.01; Table 3) and the associated respiratory quotient (from 1.095 to 1.145 l CO2/l O2; P=0.01; Table 3) as shown by contrasts.
Effects of stage and experimental group of pigs on energy metabolism in male pigs prior (stage 1; 7 days) and after (stage 2; 7 days) second vaccination with Improvac® according to dietary fat level

LF diet=low-fat diet; HF diet=high-fat diet; IC=immunocastration; IC+growth=effect evaluated as the difference between group 1 in stage 1 and group 1 in stage 2; Diet=effect evaluated as the difference between group 1 and group 2 in stage 2; ME=metabolizable energy; NE=net energy; HP=heat production; corrected activity HP=activity of HP corrected for the difference in physical activity among animals (assuming a constant 8.7% activity HP:ME through experiment) according to Labussière et al. (Reference Labussière, Dubois, van Milgen and Noblet2011); DM=dry matter.
For diet composition see Table 1.
1 Values were tested for effects of stage and group within stage (group (stage)); results are least squares (LS) means. Due to the absence of significant difference between groups 1 and 2 in stage 1, the LS means for this stage are presented as their averaged value.
2 NE was calculated as the sum of total retained energy and fasting HP.
3 Oxidation of nutrients and their contribution to lipid deposition were calculated according to Chwalibog et al. (Reference Chwalibog, Jakobsen, Henckel and Thorbek1992).
Neither ME intake nor NE intake were influenced by dietary treatment within stage 2 (average of 2472 and 1826 kJ/kg BW0.60 per day, respectively; Table 3), whereas the HF diet increased total RE (from 1078 to 1165 kJ/kg BW0.60 per day; P=0.03; Table 3) and RE as fat (from 807 to 914 kJ/kg BW0.60 per day; P=0.03; Table 3). The higher RE as fat originated mainly from deposition of dietary fat (67 v. 224 for LF and HF diet; P<0.01; Table 3). Consequently, lipogenesis was not altered by dietary treatment within stage 2 (average of 714 kJ/kg BW0.60 per day; P=0.21, Table 3), whereas respiratory quotient decreased in the HF diet (from 1.145 to 1.073 l CO2/l O2; P<0.01; Table 3). Finally, the components of HP were not affected by diet composition in stage 2, except a numerically lower thermic effect of feeding with the HF diet.
Components of BW gain
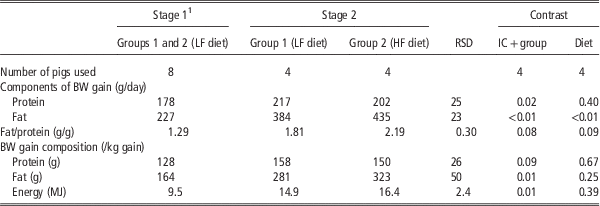
Both protein gain (from 178 to 217 g/day; P=0.02; Table 4) and fat gain (from 227 to 384 g/day; P<0.01; Table 4) increased due to IC/growth, but the difference in nutrient deposition resulted in a slightly increased fat : protein ratio in BW gain (1.29 v. 1.80 in stages 1 and 2, respectively; P=0.08; Table 4). Protein gain relative to BW only tended to be affected by IC/growth (P=0.09; Table 4), whereas fat and energy gain increased with IC/growth (from 164 to 281 g and from 9.5 to 14.9 MJ/kg, respectively; P=0.01; Table 4). Feeding HF diet within stage 2 increased fat gain (from 384 to 435 g/day; P<0.01; Table 4) and tended to increase fat : protein ratio (from 1.80 to 2.19 g/g; P=0.09; Table 4), whereas BW gain composition (in kg of gain) was not altered by dietary treatment (P>0.10).
Effects of stage and experimental group of pigs on BW, protein, fat and energy gain in male pigs before (stage 1; 7 days) and after (stage 2; 7 days) second vaccination with Improvac® according to dietary fat level

LF diet=low-fat diet; HF diet=high-fat diet; IC=immunocastration; IC+growth=effect evaluated as the difference between group 1 in stage 1 and group 1 in stage 2; Diet=effect evaluated as the difference between group 1 and group 2 in stage 2.
For diet composition see Table 1.
1 Values were tested for effects of stage and group within stage (group (stage)); results are least squares (LS) means. Due to the absence of significant difference between groups 1 and 2 in stage 1, the LS means for this stage are presented as their averaged value.
Discussion
In the course of the experiment (with BW gain i.e. growth), digestibility of nutrients and GE increased. This agrees with literature data showing continuous and linear increase of digestibility coefficients with BW (Le Goff and Noblet, Reference Huber, Squires and de Lange2001; Noblet et al., Reference Noblet2013) as a consequence of better degradation and absorption of nutrients, especially dietary fibre fractions in the hindgut of heavier or more mature pigs (Noblet and Shi, Reference Noblet and Shi1993). Higher apparent digestibility coefficient of crude fat observed on fat-enriched diet in the present study also fully agrees with literature data (Le Goff and Noblet, Reference Huber, Squires and de Lange2001). The result can be attributed to the dilution of the inevitable endogenous fat faecal losses by higher amounts of undigested dietary fat (Shi and Noblet, Reference Shi and Noblet1994). According to previous results (Noblet and Shi, Reference Noblet and Shi1993), the higher methane losses (% DE) in the present study associated with IC/growth effect are caused by a lower rate of passage due to a larger volume of hindgut (Noblet and Le Goff, Reference Noblet and Perez2001). Nevertheless, this only contributes to a low extent of the decreased ME : DE ratio with stage (i.e. IC/growth) in the present study (only for 20% of the difference). At a given stage of growth (or production), the ratio ME : DE is linearly related to dietary protein content (Noblet and Perez, Reference Noblet and Le Goff1993) and reflects the variation of N excretion in the urine with variation of N intake. Similarly, the decreased ME : DE ratio with IC/growth is related to increase feed intake and apparent digestibility coefficients of CP that resulted in higher N absorption, whereas PD remained constant. The exceeding N was then oxidized, increasing urinary N excretion and thus urinary energy (Noblet, Reference Noblet, Karege, Dubois and van Milgen2007). Moreover, higher N losses with urine observed in the present study due to IC/growth effect as a consequence of higher feed (and N) intake at similar daily N gain indicate that daily N or protein content in the diet should be reduced with growth and IC. In agreement, plasma urea N concentrations was shown to increase in IC pigs within the 1st week after V2 (Claus et al., Reference Claus, Lacorn, Danowski, Pearce and Bauer2007; Bauer et al., Reference Bauer, Lacorn and Claus2009) or shortly after (Huber et al., Reference Dunshea, Allison, Bertram, Boler, Brossard, Campbell, Crane, Hennessy, Huber, de Lange, Ferguson, Matzat, McKeith, Moraes, Mullan, Noblet, Quiniou and Tokach2013) indicating increased amino-acid catabolism. These results confirm that CP content of the diet for IC could be decreased after V2 to reduce unnecessary N emissions. Similar recommendations were given by Dunshea et al. (Reference de Lange, van Milgen, Noblet, Dubois and Birkett2013) based on a meta-analysis.
In the present experiment, ME intake (per kg metabolic BW) was increased in stage 2 to mimic IC effect, but it was not accompanied by any difference in total HP. Likewise, higher ME intake at stage 2 was not associated with an increased fasting HP as observed by de Lange et al. (Reference Le Goff and Noblet2006) in pigs of a given BW. A numerical decrease in fasting HP was even noted, which illustrates the important changes in the physiology and metabolism due to IC. Higher body fatness (van Milgen et al., Reference van Milgen, Bernier, Lecozler, Dubois and Noblet1998) and changed hormonal status after IC (castrate v. male, Labussière et al., Reference Labussière, van Milgen, de Lange and Noblet2013) have both been associated with decreased basal metabolic rate. In the present study, there was also no effect of IC/growth on total thermic effect of feeding (as % ME). Consequently, energy gain after V2 was more pronounced than expected from ME intake change only. Nevertheless, Labussière et al. (Reference Labussière, van Milgen, de Lange and Noblet2013) have shown that IC pigs have higher total thermic effect of feeding than EM due to higher feed intake and because more dietary protein is used as a source of energy with a low energetic efficiency for lipogenesis (van Milgen et al., Reference van Milgen, Noblet, Dubois and Bernier2001). The latter may have been counterbalanced by the age-related effect on thermic effect of feeding (Barea et al., Reference Barea, Dubois, Gilbert, Sellier, van Milgen and Noblet2010).
In addition to the stimulation of fat metabolism by IC, the effect of a dietary stimulation of fat metabolism was investigated in the present study. The increased dietary fat after V2 additionally stimulated retention of energy in the form of fat. However, the contribution of lipogenesis to RE as fat was reduced, because additional dietary fat was deposited in carcass as such without oxidation of dietary fat and de novo synthesis (Chwalibog et al., Reference Chwalibog, Jakobsen, Henckel and Thorbek1992; Bruininx et al., Reference Bruininx, van den Borne, van Heugten, van Milgen, Verstegen and Gerrits2011). Indeed, a lower intensity of lipogenesis from carbohydrate in pigs consuming HF diet was confirmed by a reduced respiratory quotient in the present study. Moreover, additional fat ingested in pigs on HF diet was associated with a numerical decrease of thermic effect of feeding (% ME). However, this reduction is much lower than the one observed by van Milgen et al. (Reference van Milgen, Noblet, Dubois and Bernier2001) using barrows (0.017% v. 0.024%/g of digested fat, respectively). In view of the presented results, feeding strategy of IC pigs should be based on energy limitation after V2.
In the present study, PD and LD were increased in IC pigs after V2. However, it is difficult to discriminate between IC and growth effect. Comparing with the literature, it can be hypothesized that PD was likely increased due to growth, but not affected by IC, as Labussière et al. (Reference Labussière, van Milgen, de Lange and Noblet2013) showed similar PD in IC and EM pigs 5 weeks after V2 (and superior to barrows). On the other hand, LD seems to be increased not only with growth, but also due to IC. The increase in lipid content of BW gain after IC is consistent with reported differences in carcass composition between IC and EM pigs (thicker backfat resulting in lower carcass lean meat percentage; Batorek et al., Reference Batorek, Čandek-Potokar, Bonneau and van Milgen2012). Moreover, the increased dietary fat after V2 was associated with a considerable increase in daily LD, which fully agrees with previous studies in barrows (van Milgen et al., Reference van Milgen, Noblet, Dubois and Bernier2001; Bruininx et al., Reference Bruininx, van den Borne, van Heugten, van Milgen, Verstegen and Gerrits2011). However, it is worth noting that our results point out that the increased fatness of IC pigs is a result of increased daily LD that is caused by higher energy intake together with improved energy retention and not by decreased daily PD. Consequently, due to increased LD stimulated by higher feed intake, and an increased protein catabolism with low efficiency, IC pigs are less feed efficient than EM. However, if dietary composition after IC would be optimized in energy and protein content, feed efficiency might be improved substantially.
In conclusion, the energy balance results indicate that dynamics of HP, assumed to be the major factor contributing to the differences in feed efficiency among pigs, is changed after IC. Additional energy retained because of higher feed intake is directed towards LD. Increased fatness of IC pigs is a result of increased daily LD caused by higher energy intake and improved energy retention. Hence, dietary energy intake should be limited after IC. Moreover, according to the results of the N balance study, dietary CP content could be decreased after IC. However, the patterns of tissue deposition rates following changes in energy metabolism after IC should be further explored to establish exact nutrient requirements of IC pigs and develop a feeding strategy that would allow maximizing their growth potential and minimizing the N losses.
Acknowledgements
The present study was performed at INRA, UMR 1348 Pegase, Saint-Gilles, France. Financial support was provided by Slovenian Research Agency (PhD scholarship of N. B.-L., project L4-5521 and programme P4-0133), Rennes Metropole and Slovenian human resources developments and scholarship fund (PhD student mobility scholarship of N. B.-L.). The authors would like to thank J. Delamarre, Y. Jaguelin, R. Janvier, V. Piedvache, P. Roger and A. Starck for their assistance in animal care and laboratory analysis.