I. INTRODUCTION
Equal channel angular pressing (ECAP) is one of effective methods to produce bulk materials with submicrometer or nanometer level grains through severe plastic deformation (SPD). It was originally proposed by Segal and has attracted worldwide attention, and it has become the preferred process for structure study of ultrafine grains. Reference Segal1–Reference Sun, Hashimoto, Keawprak, Ma, Li and Barsoum5 The deformation mechanism and process technique have been widely studied for Al, Ti, Mg, Cu, and their alloys. Reference Miyamoto, Fushimi, Mimaki, Vinogradov and Hashimoto6–Reference Du, Yin, Liu, Wang and Guo9 Moreover, ECAP has great potential for industrial application. Reference Chaudhury, Cherukuri and Srinivasan10–Reference Valiev, Islamgaliev and Semenova12 Current studies are mainly focused on small sample with square or circular cross-section. Reference Salem, Langdon, Mcnelley, Kalidindi and Semiatin13–Reference Lapovok, Tóth, Winkler and Semiatin18 However, those small samples made in laboratory cannot be used directly to industry because materials with plate dimension are generally required for industrial application. For instance, sputtering target, as the raw materials for film preparation in integrated circuit industry, has strict specification for microstructure and composition homogeneity. The popular wafer size is 6–8 inches, which need disc sputter target size with 152–203 mm in diameter and 22 mm in thick. ECAP is an effective method to refine the grains of high purity aluminum (HPA). So it is necessary to study the HPA plate with ECAP.
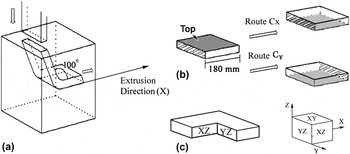
Many studies have indicated that different pressing routes introduce different shearing actions and then different refining effects. Sample with square or circular cross-section usually can be processed by four available ECAP routes: A, BA, BC, and C. Reference Chakkingal, Suriadi and Thomson19–Reference Mishin, Bowen and Lathabai22 In the route A, the material is not rotated along its longitudinal axis between consecutive pressings; in the route BA, rotations are alternately +90 and −90 deg. The rotation is always 90 deg in the same sense between passes of the route BC and 180 deg in the same sense for the route C. Kamachi Reference Kamachi, Furukawa, Horita and Langdon23 et al. reported the various shearing patterns associated with plate sample and the similar approach was followed in the present analysis. Similarly, plate samples also have A, B, and C three type routes, in detail, including A; BAZ , BCZ ; C X , C Y , C Z . For instance of the route C X , C indicates a rotation by 180° and the subscript ‘X’ denotes a rotation of the x-axis. Various combinations of these routes are also possible, but in practice the experimental evidence obtained to date suggest that more complex combinations cannot lead to additional improvement in the refinement effect.
The effect of deformation route on microstructure evolution is still not totally clear. For example, the experimental studies for pure Al using a 90 deg die revealed that the route BC was more effective than the route C and the route A. Reference Langdon24 By contrast, experiments using a 120 deg die showed that the route A was most effective. Reference Prangnell, Gholinia, Markushev, Lowe and Valiev25 However in these studies, they only selected a small area from the most center zone to do observation, which is lack of homogeneity message for the whole material. Some numerical studies have suggested that severe deformation during ECAP happened around the inner angle of the channel (reflected near the top surface of the sample) and weak deformation occurred around the outer angle show (reflected near the bottom surface), which is due to the existing curvature angle and wall friction. Reference Jing, Ke-shi, Hwai-Chung and Mei-hua26–Reference Kawasaki, Horita and Langdon30 As deformation from a single ECAP pass is inhomogeneous, repetitive pressing without any rotation between two neighboring passes is unable to improve structure homogeneity, such as the route A. Although experiments in conventional ECAP have identified the route BC as the optimum procedure for rods or bars samples, the horizontal plane (XY plane) is always rectangle for plate-shaped samples used in industrial. Thus, the route BAZ and BCZ are not available any more. In fact, the route B type routes may not useful even XY plane is square because the plate will be sheared into a parallelogram, which need extra machining and complex process. Therefore, only the route C has practical significance. Considering the route C Z (180 deg rotation around z-axis), the top and bottom surfaces are not swapped and deformation still remains on upper surface, which is similar to the route A and is not beneficial to homogeneity of the whole sample. Therefore, only the route C X and C Y are worth to study.
On the other hand, if sample size is too small, it is difficult to show ECAP deformation inhomogeneity. Therefore, for industrial applications, it is necessary to use samples with industrial scale to evaluate the deformation accumulation and structure homogeneity by different ECAP routes. In this work, big size ECAP was carried out using a self-made die (cross section 180.2 × 22.2 mm), and a special inner angle of 100 deg instead of conventional 90 deg and outer angle of 30 deg were adopted to investigate the influence of pressing routes (C X and C Y ) on structure homogeneity of ECAP plate materials.
II. EXPERIMENTAL
A. Sample preparation
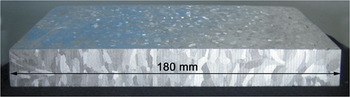
High purity aluminum (99.999 wt%) was chosen for this study. To simplify the experiment, graphite mold with cavity size of 180 × 180 × 22 mm was adopted. Aluminum ingot was directly cast into plate in size of 180 × 180 × 22 mm after remelting. These plates were annealed at 473 K for 1 h to produce an initial grain size of 3–4 mm as shown in Fig. 1. The ECAP process was carried out at room temperature up to 4 passes using the route C X and C Y . A diagram of the ECAP die and routes is shown in Fig. 2. Molybdenum disulfide (MoS2) was applied to reduce friction.
Macrostructural of cast sample.

Schematic diagram of (a) ECAP die, (b) pressing routes, and (c) coordinate axis.

B. Characterization
Plates were slivered using a wire cutting facility. The cutting faces [XZ-section and YZ-section, see Fig. 1(c)] were chosen to do further analysis. After grinding and polishing, these sections were etched using a solution of 1% HF. Canon Digital IXUS 120 IS digital camera (Canon Inc., Tokyo, Japan) was used to analyze the macrostructures of 45 mm × 22 mm center area on XZ and YZ planes. Using a field emission gun scanning electron microscope (NOVA NanoSEM 230, FEI Company, Hillsboro, Oregon), EBSD method was used to investigate the specimen pressed by the route C Y after 4 passes for detailed information on the degree of homogeneity. The measurements were taken in three zones of XZ-section along depth direction of the plate (z-axis), labeled A, B, and C. While the top surface is set as 0 mm, A, B, and C zones were 3, 11, and 19 mm away from upper surface, respectively [see Fig. 3(e)]. Samples for EBSD were electropolished using a solution of 10% HClO4 + 20% CH3OH + 70% C2H5OH at a temperature of 275 K with a DC voltage of 23 V. The grain orientation maps and pole figures were then obtained by the CHANNEL 5 software package produced by HKL technology. Orientation of each grain is colored in orientation triangle according to their different orientations. In this study, misorientation between neighboring grains are greater than 3 deg, and thin white line and bold black line were used to describe the grain boundary between 3 and 15 deg and others over 15 deg, respectively. Grain size is described as a diameter of equivalent area circle.
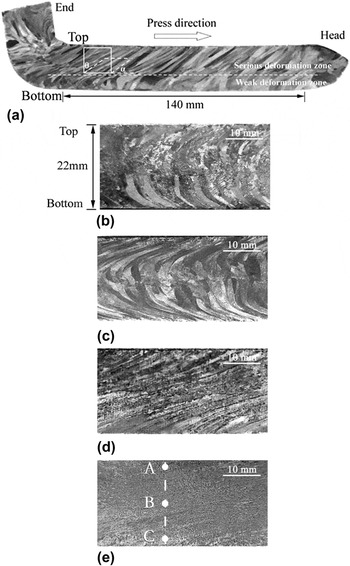
The macrostructure homogeneity of XZ plane: (a) after one pass; (b) after two passes by route C X ; (c) after four passes by route C X ; (d) after two passes by route C Y ; (e) after four passes by route C Y .

C. Mechanical properties
402SXV digital micro Vickers hardness tester (Shanghai ShangCai Testermachine Co. Ltd., Shanghai, China) was adopted to measure Vickers microhardness (H V) of the plates before and after 4 passes. The values of H V were tested along depth direction of the plate (z-axis) on the XZ-section using a load of 300 gf applied for 15 s. These measurements were taken at positions from 1 mm of the top surface and incremental depths of 2 mm down to the bottom surface, giving a total of 11 sets of H V through the z-axis of the plate. Each value of H V was averaged from 15 individual readings recorded in 2 mm increments along x-axis.
Measurements were taken to determine the tensile and yield strength in tension. Tensile specimens were machined from the central part of the XZ plane with the tensile axes parallel to x-axis. These specimens were pulled to failure at room temperature with an initial strain rate of 3.3 × 10⁻⁴ s−1.
III. RESULTS AND DISCUSSION
A. Macrostructure analysis
The macrostructure of XZ plane after one ECAP pass is shown in Fig. 3(a). It can be seen that the grains are elongated along the shear direction. However, the deformation of grains is inhomogeneous along depth direction (z-axis). A dotted line was drawn to divide the cross section into two parts, which is named severe deformation zone and weak deformation zone, respectively. The severe deformation zone near the top surface accounts for 2/3 of the cross section, and the weak deformation zone accounts for the remaining 1/3 of the section. According to the lattice model, the rotation angle α between elongated grains and x-axis can be determined. After pressing deformation, square grid was stretched to parallelogram along pressing direction and show an angle with original grid, which is called shearing angle and satisfies following relationship Reference Segal1 :
 $$\eqalign{ &\!\!\!\!\!\!\!\!\! \tan \theta = \gamma = \sqrt 3 {\varepsilon _N} \cr &\!\!\! {\varepsilon _N} = {N \over {\sqrt 3 }}\left[ {2\cot \left( {{\Psi \over 2} + {\varphi \over 2}} \right)} \right] \cr & \alpha = {\pi \over 2} - \theta \cr}$$
where γ, ε, φ, ψ, α, and N is corresponding to shear stain, equivalent strain, inner angle, outer angle of die, tilt angle, and ECAP passes, respectively. In this study, ε1 = 0.87, θ = 56.4°, α = 33.6° can be determined using φ = 100° and ψ = 30°, which is consistent with the observation shown in Fig. 3(a).
The deformation inhomogeneity of single ECAP pass has been discussed. Reference Lee, Phan, Levine, Tischler, Geantil, Huang, Langdon and Kassner31–Reference Xu, Furukawa, Horita and Langdon34 Multi-pass extrusion by changing the extrusion direction is an effective method to obtain homogenous structure. Reference El-Danaf16,Reference Kammers, Wongsa-Ngam, Langdon and Daly35,Reference Hoseini, Meratian, Toroghinejad and Szpunar36 In this work, two different routes (C X and C Y ) were evaluated. After large plate samples were extruded along C X and C Y for two and four times, morphologies along vertical section (XZ plane) are shown in Figs. 3(b)–3(e). After 2 passes extrusion by the route C X , the deformation is more severe at the edges where the grains are obviously elongated, while the deformation in the center is inconspicuous. In addition, the deformation directions in upper and lower parts of the plate are different. Grain boundaries are rotated clockwise or counterclockwise and formed an angel close to 68 deg. After 4 passes extrusion [Fig. 3(c)], the edge deformation is further aggravated, while the shape and size of the grains in the center of the section change slightly, still keeping the original coarse structure. By comparison, after 2 passes extrusion by the route C Y [Fig. 3(d)], the plate cross section shows better deformation consistency. Continuous flow lines can be observed from top to bottom. After 4 passes [Fig. 3(e)], grains and flow lines has become less obvious and the whole section is relatively uniform.
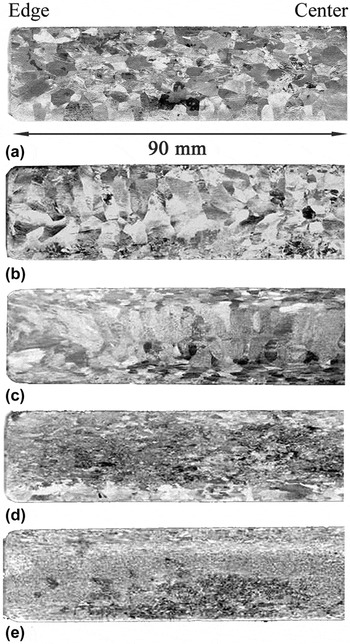
Figure 4 shows the macrostructure of transversal section (YZ plane). From Fig. 4(a), it can be found that the grain size decreased after one ECAP pass, which is due to the elongated effect along extrusion direction [see Fig. 3(a)]. After 2 or 4 passes by the route C X [Figs. 4(b)–4(c)], grains near the edge were refined obviously, but the grain size in the center does not change much. This indicates that it is difficult to refine the middle part of the plate using the route C X . The plates using the route C Y show a better refinement effect [see Figs. 4(d)–4(e)]. After 4 passes extrusion [see Fig. 4(e)], the grain size decreases greatly and it is very homogenous throughout the whole section, which corresponds to the observations of XZ plane.
The macrostructure homogeneity of YZ plane: (a) after one pass; (b) after two passes by route C X ; (c) after four passes by route C X ; (d) after two passes by route C Y ; (e) after four passes by route C Y .

B. Microstructure analysis
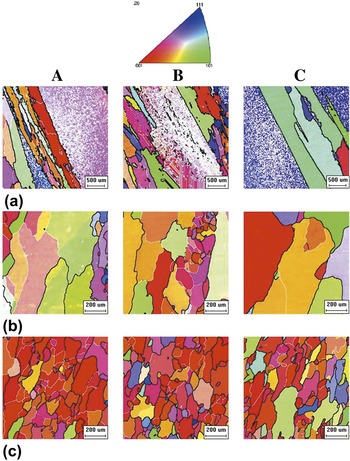
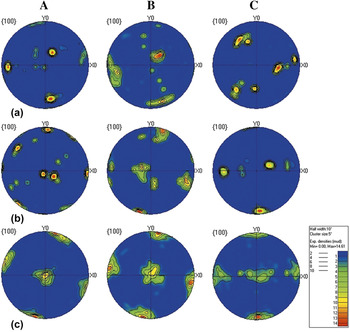
Macro photos help to see the structure of the whole section, but it cannot give the information of individual grains especially for the route C Y . To further investigate the microstructure and homogeneity by the route C Y , EBSD was carried out to analyze different depth along z-axis on XZ plane after one, two and four passes. Sampling positions are shown in Fig. 3(e) and labeled as A, B, and C, and orientation maps and pole figures are listed in Figs. 5 and 6. It can be seen that after one ECAP pass, the grains are still coarse but elongated along shearing direction, and large straight boundaries (bold black line) encapsulates lots of pile-up small grain boundaries (thin white line). Grain size clearly decreases after two extrusions. And grains are further refined to equiaxed grains or nearly equiaxed grains after four extrusions, most of which consist of large angle grain boundaries as marked with bold black lines. The grain size in area A, B, and C is 69.3 μm, 66 μm, 70.5 μm, respectively, and the average grain size over three areas is 68.6 μm. Besides, after four passes, misorientation among grains is negligible and most of the grains are oriented close to 〈001〉 orientation. Figure 6 reveals a general evolution of texture with increasing number of passes with a strong oblique cube texture after four extrusions. Moreover, the cube texture is rotated clockwise along the y-axis. A similar cube texture has been reported by W. Skrotzki et al. Reference Skrotzki, Scheerbaum, Oertel, Brokmeier, Suwas and Tóth37 They obtained cube texture in small samples by the route A and explained the formation mechanism. We found that the route C Y is an effective way to form such texture in large plate and to obtain a homogeneous structure.
Grain orientation maps in top, middle, and bottom part of the plate, respectively: (a) after one pass; (b) after two passes by route C Y ; (c) after four passes by route C Y [three locations labeled as A, B, and C corresponding to those marked in Fig. 3(e)].

Pole figures in top, middle, and bottom part of the plate, respectively: (a) after one pass; (b) after two passes by route C Y ; (c) after four passes by route C Y [three locations labeled as A, B, and C corresponding to those marked in Fig. 3(e)].

C. Hardness analysis
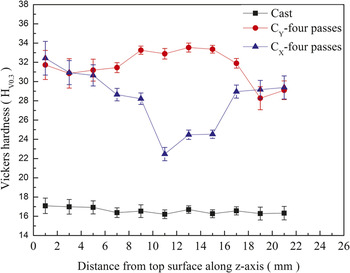
Figure 7 shows hardness distribution on XZ plane of the plate after four passes extrusion by the route C X and C Y . The hardness of the plate without extrusion is also listed for comparison. It can be seen that the results are consistent with the structural observations. The hardness of the plate by the route C X is higher at the edge and lower in the center. The level of working hardness further indicates that the deformation along depth direction (z-axis) is inhomogeneous. In contrast, for the plate extruded by the route C Y , the hardness is enhanced generally along the depth direction, indicating that the working hardness and deformation are homogeneous across the whole section.
Hardness distribution along depth direction (z-axis) of the cast plate, pressed after four passes by route C X plate and pressed after 4 passes by route C Y plate detected on XZ plane.

D. Tensile properties
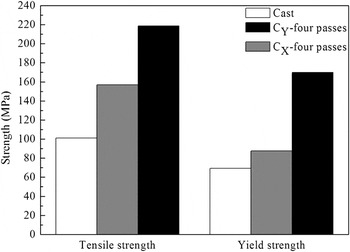
Figure 8 shows the tensile and yield strength tested on XZ plane. It can be seen that materials strength after four extrusions by two routes are clearly higher than that before extrusion. Especially for the route C Y , the tensile strength and yield strength increase by a factor of more than two, corresponding to an increase from 101.2 MPa to 218.6 MPa and from 69.2 MPa to 169.7 MPa, respectively. Based on Hall–Petch equation, it is clear that the grain refinement by ECAP contribute to this strength enhancement. The results of mechanical tests further illustrate the route C Y shows better refinement than the route C X , meaning small and uniform structures within whole material are easier to be obtained from the route C Y .
Tensile and yield strength of the cast plate, pressed after four passes by route C X plate and pressed after 4 passes by route C Y plate detected on XZ plane.

E. Influence of extrusion routes
As shown above, the ECAP pressing routes do have great influence on the structure evolution and homogeneity of large plate due to the different interaction of strain under different routes. According to the macrostructure characteristic after ECAP (see Figs. 3 and 4), a sketch map of grain evolution on XZ plane was drawn (see Fig. 9). The weak deformation zone, accounting for about 1/3 of the section after the first ECAP pass, is turned over to the upper surface in both routes before the second ECAP pass. For the plate by the route C X , the weak deformation zone becomes new severe deformation zone in the second ECAP pass. However, as severe deformation can cover 2/3 thickness of the plate [see Fig. 3(a)], the middle part of the plate (marked blue), which also belongs to the severe deformation zone of the previous pass, will experience another severe deformation. Because the deformation directions between neighboring passes of the route C X are crossed for the grains in this zone, the grain deformation cannot accumulate and is even offset. Since bottom region become new weak deformation zone, the impact to the deformation condition from previous pass is negligible. In contrast, for the plate by the route C Y , as the deformation direction is consistent between neighboring passes, the weak deformation zone on the upper surface can be efficiently strengthened and the severe deformation zone in center and bottom cannot be significantly affected in the second pass, which leads to a consistent deformation. This consistency of deformation direction finally results in the formation of a strong cube texture (001) [100] after four passes.
Sketch map of the XZ-plane showing the deformation process in different routes (the fine lines means the main direction of grain boundaries).

IV. CONCLUSIONS
In this study, plate samples of high purity (99.999%) aluminum with large dimension (180 × 180 × 22 mm) was successfully processed with grain refinement by two different routes using a big size ECAP die. Based on the study of deformation routes and refining homogeneity, the conclusions are as follows:
-
(1) Better structure homogeneity was found from the route C Y between two optional ECAP routes when we consider rectangle plate samples commonly used in industry. The deformation direction between neighboring passes shows the most important influence on refining homogeneity in material.
-
(2) After the plate samples were pressed four passes by the route C Y , the original columnar grains with size of 3–4 mm can be refined to nearly equiaxed grains with average size of 68.6 micrometer and forms a strong cube texture, and corresponding mechanical properties increases by a factor compared to as-cast plate.
ACKNOWLEDGMENTS
This work was funded by the National Natural Science Foundation of China (Nos. 51374143 and 51504150), the National Basic Research Program of China (No. 2012CB619505).