I. INTRODUCTION
Semiconductor photocatalysis usually have low reaction temperatures and stable chemical properties. They also can translate organic compounds into harmless products. Thus, it can be seen as a promising process for degradation pollutants and environmental pollution. Reference Karthikeyan, Sivaranjani, Dhanavel, Gupta, Narayanan and Stephen1–Reference Chen, He, Liu, Chen, Au and Yin4 In particular, the heterogeneous photocatalysis has received much attention, which has potential to solve the energy problems. Reference Li, Yu and Jaroniec5 However, the preparation and cyclic utilization of the semiconductor photocatalysts still face a major problem hindering practical application in industrial processes. In recent years, the Bi-containing photocatalysts have been receiving tremendous attention, and their advancement has been already summarized systematically Reference He, Cao, Zhou and Yu6 because of their broad photo absorption regions and excellent photocatalytic activities. Reference Li, Wang, Yao, Dang and Li7–Reference Yu, Chen, Wang, Jia, Tang and Lv9 Meanwhile, the potential of the Ta5d orbit of the conduction bands (CBs) of tantalates is more negative than that of titanates and niobates. Reference Zhang, Ming, Yu, Zhang, Huang and Yu10 Therefore, great attention has been given to Bi- and Ta-based compounds due to their high photocatalytic properties. Typically, BiTaO4 can degrade organic contaminants under the irradiation of visible light, which can be attributed to the presence of the Bi3+ lone-pair electrons and TaO6 octahedral. Reference Shimada, Izawa and Watanabe11,Reference Zou, Ye, Sayama and Arakawa12 Besides, the Bi3TaO7 of excellent photocatalytic activity has been reported. Reference Luo, Xu, Di, Wu, Wu, Shi and Min13 Bi7Ta3O18, as the similar material, the latest reference related to the dielectric properties, Reference Chon, Tan, Khaw, Zainal, Taufiq Yap, Chen and Tan14 and the photocatalytic activity hardly was mentioned. Therefore, it can be considered to be the new photocatalyst.
There are some reports that the localized surface plasmon resonance (LSPR) of noble metals on photocatalyst can promote separation between the electrons and holes in the semiconductor. Reference Wen, Xie, Chen and Li15,Reference Wu and Xu16 The local electromagnetic field caused by LSPR is more intense for Ag compared with Au or Pt. Reference Liu, Liang, Lu, Li, Hu and Yu17 Recently, abundant researches about the Ag/composites photocatalyst have been discussed. Reference Li, Fang, Yu, Zhou, Zhu and Xie18 Such as Ag/ZnO, Reference Han, Ren, Cui, Chen, Pan and Chen19,Reference Liu, Hua, Zhang, Liu, Jia and Xu20 Ag/TiO2, Reference Wu, Hu, Fan, Liu, Sun, Kang, Hou, Zhu and Liu21–Reference Li, Tao, Li, Liu and Zhang23 Ag/AgBr composites, Reference Dai, Lu, Dong, Ji, Zhu, Liu, Liu, Zhang, Li and Liang24 and others. Ag/heterojunction composites also have been used to enhance photocatalytic acitivity, including Ag/AgCl/La, Reference Xiao, Zhang, Yu, Sun, Zhang and Dong25 Ag/AgCl/TiO2, Reference Li, Han and Zhao26 Ag/AgCl/Fe3O4, Reference Zhong, Jiang, Han, Liu, Zhang and Lu27 Ag/AgBr/Bi5O7I, Reference Zhao, Wang, Yang, Fang, Zhang, Zhu, Tang and Huang2 Ag/AgBr/TiO2, Reference Seo, Jeon, Dembereldorj, Lee and Joo28 Ag/TiO2/reduced graphene oxide, Reference Vasilakia, Georgaki, Vernardou, Vamvakaki and Katsarakis29 and so on. So far, no article has reported about the preparation of the Ag/Bi7Ta3O18 visible-light-driven photocatalyst.
For this paper, we fabricated a series of Ag/Bi7Ta3O18 photocatalysts to observe the photocatalytic acitivity. The products’ microstructure and morphology were analyzed using frequently-used techniques, and the photocatalytic properties of products were investigated by the RhB degradation by visible-light irradiation. The Ag/Bi7Ta3O18 (h) composite exhibited excellent photocatalytic degradation efficiencies compared with Bi7Ta3O18 (h), which are attributed to the larger surface area. Among these samples, the 0.06 Ag/Bi7Ta3O18 (h) samples showed the best photocatalytic activity. Furthermore, the reaction mechanism was discussed in depth.
II. EXPERIMENTAL SECTION
A. Sample preparation
The analytical grade reagents were used as received without further purification. The Bi7Ta3O18 was prepared by the hydrothermal-route. Typically, 3.3955 g Bi(NO3)3·5H2O (99%), and 1.0746 g TaCl5 (99.99%) were added into 10 mL glycol, and the mixture was dispersed in an ultrasonic bath for 15 min to get a homogeneous solution. At the same time, 7.84 g KOH was added into 20 mL deionized water, and an appropriate amount of KOH (99.99%) solution was slowly added to the homogeneous mixture solution in drops until the PH value was adjusted to 10.5, and following this, the mixture was stirred for 0.5 h to obtained the slurry. Next, the sealed slurry in a 50 mL Teflon was maintained at 200 °C for 24 h with the lined high-temperature resistance, then naturally cooled to room temperature. The final products were collected by centrifugation, washed several times with distilled water, and then dried at 70 °C in a vacuum for 10 h and obtained yellow powder which is denoted BTO (h).
The Ag/Bi7Ta3O18 were obtained by a photodeposition method. Firstly, a certain amount of AgNO3 (99.8%) was dissolved in distilled water and stirred for 15 min. Secondly, the BTO (h), which has been prepared, was added in the above solution, respectively, and stirred for 20 min. Thereafter, the suspension was irradiated for 45 min by a 300 W xenon lamp with a 420 nm cut-off filter. After that, the as-prepared silver-gray powder was obtained by filtration, washed, and dried under 70 °C for 8 h in vacuum condition. The weight percent of Ag for BTO prepared by the above routes were 3, 6, and 9%, and corresponding BTOs were denoted as 0.03 A/BTO (h), 0.06 A/BTO (h), and 0.09 A/BTO (h), respectively.
B. Characterization
The phase composition and crystalline state of photocatalysts were analyzed using X-ray powder diffraction (XRD; D8 Advance diffractometer, Bruker Corporation, Karlsruhe, Germany) with Cu Kα radiation (λ = 1.5406 nm). The microstructure of the samples was observed by SEM (JSM-7001F, Merlin Compact, Heidenheim, Germany) along with energy dispersive spectra analysis. The morphology of all the photocatalysts was observed by H-800 TEM (Hitachi, Tokyo, Japan). The specific surface area was determined by the Barrett–Emmett–Teller (BET) technique on a Ommishop 100CX (Quantachrome, Boynton Beach, Florida). The X-ray photoelectron spectroscopy spectrums (XPS) and valence band X-ray photoelectron spectroscopy spectrums (VB XPS) were measured using a VGMK IIXPS (Thermo Fisher ESCALAB 250Xi, Waltham, Massachusetts). A UV-vis spectrophotometer (Agilent Cary 5000, Melbourne, Australia) was used to investigate UV-vis diffuse reflection spectra of the photocatalysts. The emission spectra at room temperature were measured using a fluorescence spectrophotometer (F-4600, Hitachi, Tokyo, Japan) with the excitation source of a 150 W Xe lamp. The photocurrents were studied in the electrochemical station (CHI 660D, Huake Putian, Beijing, China). The electron spin resonance (ESR) analysis was examined on a paramagnetic electron resonance spectrometer (E 500, Bruker Corp., Karlsruhe, Germany).
C. Photocatalytic activity experiment
In the photo degradation experiment, the photocatalytic activities of the products were measured by the degradation of RhB in aqueous solutions under 500 W Xe lamp irradiation (λ > 420 nm). Firstly, 50 mg of photocatalyst was added in the RhB aqueous solution (50 mL, 5 mg/L). Reference Zhu, Fang, Huang, Liu, Chen, Guan, Tang, Zhang and Wang30 To get the absorption-desorption balance between the photocatalyst and RhB, the mixed aqueous solution needed to be stirred magnetically in the dark for 30 min before irradiation. Secondly, under visible-light irradiation, at certain time intervals of 15 min, the 2 mL suspensions were centrifuged to remove the powder and obtain the supernatant. Lastly, the absorbance of concentration about RhB at the characteristic band of 554 nm was recorded by a UV762 UV-Vis-NIR spectrophotometer (Jing Ke Instrument Co. LTD, Shanghai, China).
III. RESULTS AND DISCUSSION
A. Characterization and photocatalytic activities of photocatalysts
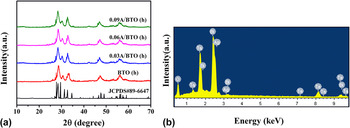
Figure 1(a) shows XRD patterns of pure BTO (h) and the A/BTO (h) composites. The sample’s diffraction peaks were in good agreement with those of Bi7Ta3O18 (JCPDS 89-6647), indicating that the all prepared photocatalysts possess the same crystal structure. It is found that the hydrothermal samples show broad weak compared with the standard PDF card. This suggests that the samples present weak crystallization. No peak of Ag was found in the A/BTO (h) composites mainly due to its low concentration. In Fig. 1(b), the elements of Bi, Ta, O, and Ag were observed in the energy dispersive x-ray (EDX) spectra of 0.03 A/BTO (h). The result proved the existence of Ag.
(a) XRD patterns of BTO (h) and A/BTO (h) samples. BTO JCPDS 89-6647 is shown as a reference and (b) the EDX spectra of 0.03 A/BTO (h).

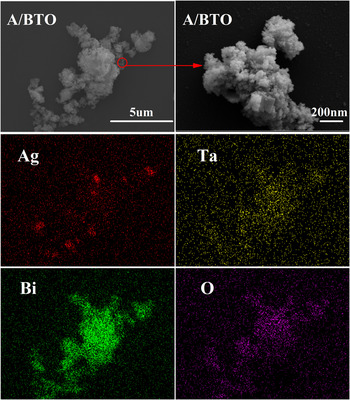
The morphologies of BTO (h) were investigated using SEM. In Fig. 2, the A/BTO (h) particles with a large nanoparticles size can be observed. Besides, Fig. 2 shows the elemental mapping distribution of the surface of sample 0.06 A/BTO (h). The analysis of A/BTO (h) shows that the amount of Ag adsorbed is proportional to the amount of Bi7Ta3O18. It also directly proves that Ag successfully loads on the surface of Bi7Ta3O18 by hydrothermal synthesis method.
SEM image of BTO (h) and EDX elemental mapping of 0.06 A/BTO (h) Ag, Ta, Bi, and O. The images indicate the atomic symbols correspond to the EDX.

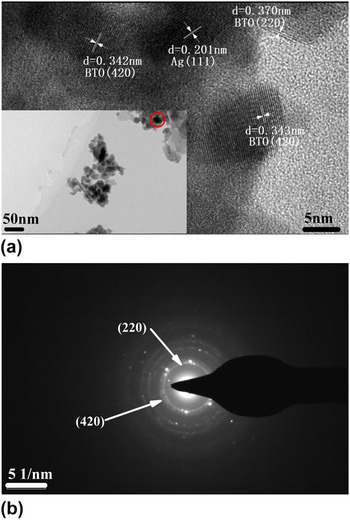
TEM images were used to further observe the microstructures of the Ag/Bi7Ta3O18 composites. The TEM image of 0.06 A/BTO (h) is presented in the inset of Fig. 3(a). The high-resolution TEM (HRTEM) images of 0.06 A/BTO were obtained to further understand the structure of the as-prepared samples. There are two interplanar spacings (d = 0.370 and 0.342 nm) corresponding to the (220) and (420) planes of BTO, respectively. Besides, the 0.201 nm lattice fringes correspond to the (111) crystal face of the Ag nanoparticle, which confirmed the composition of metal Ag in depth. The typical partial ring and dot patterns in the SAED pattern of BTOs suggest whose polycrystalline structure, as shown in Fig. 3(b).
(a) The HRETEM image of 0.06 A/BTO (h) and the inset is the corresponding TEM image and (b) The SAED pattern of A/BTO (h).

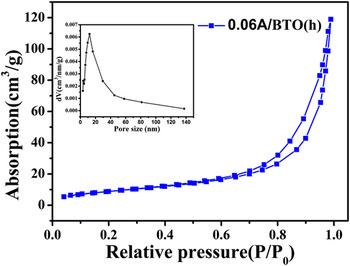
To evaluate the porous characteristics of 0.06 A/BTO (h), the nitrogen adsorption/desorption isotherms and pore size distribution were investigated as shown in Fig. 4. According to the classification of IUPAC, the 0.06 A/BTO (h) isotherm belongs to the H1 hysteresis loop by the spherical particle distributing homogeneously. Reference Yusoff, Mohamed, Aziz and Ghani31 The 0.06 A/BTO (h) photocatalyst was formed of a porous structure ranging from 1 to 140 nm and concentrating in 1–20 nm. Furthermore, the BET surface areas and average pore size of BTO (h) are 33.15 m2/g and 12.103 nm.
Nitrogen adsorption/desorption isotherms of 0.06 A/BTO (h). The inset shows the pore size distribution of 0.06 A/BTO (h).

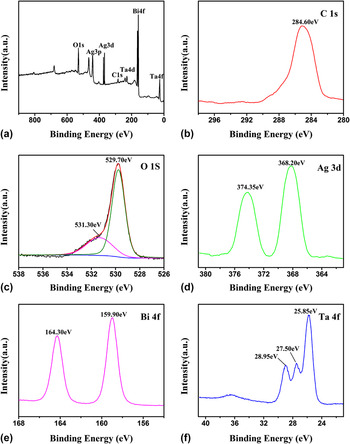
The XPS spectra is a proven and useful method to research the surface oxidation states and compositions of the samples. In Fig. 5(a), the main compositions of the obtained product are determined to be Bi, Ta, O, Ag, and C by the full XPS spectrum. In Fig. 5(b), the XPS peak centered at the binding energy of 284.6 eV is ascribed to the bond of elemental carbon C–C. Reference Sexton and Avery32 Figure 5(c) showed the high-resolution O1s XPS spectra, which have been divided into two peaks according to the oxygen atoms in different groups. The binding energies of 529.70 and 531.30 eV were attributed to the peak of O1s. Reference Wang, Du, Yang, Zhang and He33 Figure 5(d) presents the peaks of Ag3d in the high-resolution XPS spectrum, and the peaks match the binding energies of 374.35 and 368.20 eV in the Ag/Bi7Ta3O18 system. They were attributed to Ag0. Reference Jordan, Liu, Qiu, Ginatempo, Bruno, Stocks and Shelton34 The observed Bi4f core-level spectra at binding energies of around 164.30 eV (Bi4f 5/2) and 159.90 eV (Bi4f 7/2), respectively, indicate the presence of a trivalent oxidation state Bi, Reference Morgan, Stec and Van Wazer35,Reference Zhong, Qiu, Zhang, Li, Zhang and Chen36 as shown in Fig. 5(e). Figure 5(f) shows three significant peaks with binding energies of around 28.95, 27.50, and 25.85 eV. The previous two were attributed to the peak of Ta4f 5/2, and another peak was assigned to Ta4f 7/2, which confirmed that Ta5+ dominates the forms of existing Ta. Reference Nefedov, Firsov and Shaplygin37,Reference Hota, Bera and Maiti38 The results further demonstrated that there are both Ag and Bi7Ta3O18 species in the photocatalyst.
XPS spectra of 0.06 A/BTO (h): (a) survey spectrum, (b) C1s, (c) O1s, (d) Ag3d, (e) Bi4f, and (f) Ta4f.

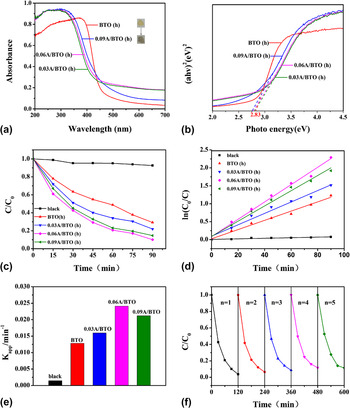
In Fig. 6(a), the optical absorptions of the samples of BTO (h) and A/BTO (h) were investigated by UV-vis diffuse reflection spectra. Note that the color of the A/BTO (h) became silver-gray on account of adding the Ag element compared with the original yellow of BTO (h). It can be seen that the A/BTO (h) samples exhibit absorption in the region of 420–700 nm of the UV-Vis light, and the samples presented a more greater photo absorption area within the visible light region compared to the bare BTO (h). The band gaps of these samples herein can be given by the following equation Reference Tian, Huang, Guo, He and Zhang39 :
 $$\alpha h\nu = A{\left( {h\nu - {E_{\rm{g}}}} \right)^n}\quad ,$$
where A, α, ν, and E g represent a constant, the absorption coefficient, photon frequency, and band gap energy, respectively, and n = 1/2 (n = 2) for the direct (indirect) transition. For Bi7Ta3O18, the value of n = 1/2 corresponds to a direct transition. Therefore, the curve of converted (αhν)2 versus hν and the band gap energy of the samples were well measured by the intercept of the tangent to the X axis from the UV-vis spectrum. Figure 6(b) illuminates that the band gap of BTO (h) with the content of Ag 0, 3, 6, and 9% are 2.83, 2.81, 2.78, and 2.76 eV, respectively. The result showed that the band gap of BTO produces a tiny change with the Ag loading on the surface of Bi7Ta3O18. One possible explanation is that the localized Ag metallic cluster was introduced into energy levels in the BTO band gap into which valence band electrons of BTO are excited and need less energy. Reference Sobana, Muruganadham and Swaminathan40 The other possible explanation is that the SPR effect of Ag nanoparticles may have a significant contribution to the light-harvesting and capacities-using. It can decrease the band gap and then promotes the enhanced photocatalytic activity. Reference Liu, Deng, Sun, Li and Zhu41
(a) UV-vis absorption spectra of BTO (h) and A/BTO (h) samples, (b) Plots of the (αhν)2 versus photo energy (hv) for BTO (h) and A/BTO (h) samples. (c) Photodecomposition of RhB in BTO (h) and A/BTO (h) samples under visible-light irradiation, (d) Kinetic curves of the RhB photodegrdation with various photocatalysts, (e) reaction rate constants over various photocatalysts, and (f) cycling degradation efficiency of the RhB about the 0.06 A/BTO (h) sample in visible-light.

In our study, RhB was chosen as the pollutant to test the photocatalytic activity of BTO (h) and A/BTO (h) samples with visible-light irradiation (λ > 420 nm). In the black experiment, the degradation of RhB did not happened in the absence of a photocatalyst, indicating the stability of RhB and eliminating the possibility of auto-decomposition processes, as shown in Fig. 6(c). All of the A/BTO (h) composites were more photocatalytically active than pure BTO (h). Besides, the 0.06 A/BTO (h) composite had the highest photocatalytic activity, achieving an RhB degradation efficiency of 92% after visible-light irradiation for 1.5 h. From the phenomenon, we may draw the following conclusions: the degradation efficiency of A/BTO (h) can be enhanced owing to the modification of Ag nanoparticles when compared with the raw BTO (h), showing that the Ag plays a major role in the photocatalytic properties of the A/BTO (h) photocatalyst. The photocatalysis capacity of A/BTO (h) increased to a maximal value along with the augmentation of Ag concentration, and the proportion is determined to be 6%. If the concentration continued increase, the photocatalysis capacity would decrease. The possible reason is that excess concentration would occupy certain active sites on the BTO surface, and thus the surface adsorption capability of the photocatalyst to the RhB could be decreased. Reference Gyawali, Adhikari, Joshi, Kim, Rodríguezgonzález and Lee42,Reference Zhang, Luo, Wang and Zhang43
To quantitatively study the kinetics of RhB photo degradation, herein the pseudo-first-order equation was adopted to describe the photo degradation of organic pollutants. This equation is expressed as follow Reference Zhao, Li, Wei, Wang, He, Sun and Yang44 :
 $$\ln \left( {{{{C_0}} \mathord{\left/ {\vphantom {{{C_0}} C}} \right. \kern-\nulldelimiterspace} C}} \right) = {K_{{\rm{app}}}}t + b\quad ,$$
where C is the RhB concentration at time t (mol/L), C 0 is the RhB concentration (mol/L) after the same reaction time in the dark, and K app is the apparent rate constant of pseudo-first-order (min−1). Figure 6(d) shows that the slope of the histogram corresponds to the photo degradation rate and the 0.06 A/BTO (h) sample persented the highest degradation rate. As shown in Fig. 6(e), the K app of the 0.06 A/BTO (h) composite was 0.02414 min−1, which was 1.8 times higher than BTO (h). These results suggest that the photochemical properties of BTO (h) were improved by adding Ag nanoparticles.
The RhB cycling degradation experiments were performed to further study the performance stability of the prepared sample of 0.06 A/BTO (h), as shown in Fig. 6(f). The stability of the 0.06 A/BTO (h) composite was also studied through five cycles of the photo degradation of RhB. In these experiments, the 0.06 A/BTO (h) composite was easily recycled by simple filtration without any treatment. After five cycles of the photo degradation process, the 0.06 A/BTO (h) composite exhibits a slight loss, ensuring the stability of 0.06 A/BTO (h). Therefore, the 0.06 A/BTO (h) composite can be inferred as a stable photocatalyst.
B. The mechanism of photocatalytic activity enhancement
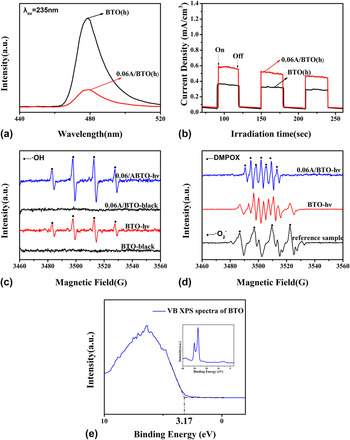
Figure 7(a) shows the emission spectra of BTO (h) and 0.06 A/BTO (h) photocatalyst after excitation with 235 nm. The emission band peak located at about 479 nm, and the intensity of BTO (h) was higher than the 0.06 A/BTO (h). Those emission spectra originate from the recombination between the electrons localizing in intermediate electronic states and the holes from the valence band. Low emission intensity indicates a low electron–hole recombination rate. Reference Chen, Shen, Guo, Wang, Su, Zhao and Guo45 The 0.06 A/BTO (h) exhibits a lower emission, which confirms the lower recombination between electron–hole pairs and the higher density of charge carriers. That is to say, 0.06 A/BTO (h) can afford more active electron–hole pairs, which can facilitate the photocatalytic degradation of RhB.
(a) Emission spectra of BTO (h) and 0.06 A/BTO (h) photocatalys, (b) photocurrent-time testing curves of BTO (h) and 0.06 A/BTO (h) photocatalys under visible-light irradiation (λ > 420 nm, [Na2SO4] = 0.1 M), (c) ESR signals of hydroxyl radicals from BTO and 0.06 A/BTO (h) under black and irradiation of visible light, (d) ESR signals of superoxide radicals from the standard sample, BTO and 0.06 A/BTO (h) under irradiation of visible light, and (e) XPS valence band spectra of BTO (h).

The generation and separation of the photogenerated charge carriers can be monitored by the generation of photocurrent. Reference Chen, Chen, Liu, Yan, Hu, Zhang, Tian, Xia and Chen46 In general, the higher photocurrent corresponds to the higher separation efficiency of the electron–hole. Figure 7(b) shows the photocurrent-time testing curves of BTO (h) and 0.06 A/BTO (h) photocatalys under visible-light irradiation. The 0.06 A/BTO (h) photocatalys exhibited a stronger photocurrent response than the BTO (h). The result indicates that the separation efficiency of the photogenerated electron–holes of 0.06 A/BTO (h) is more effective than BTO (h). Hence, the photocatalytic performances can be improved when the Ag nanoparticle loads on the surface of Bi7Ta3O18.
To confirm the radicals in that process, the presence of ˙OH and ˙O2 − radicals was detected by the ESR technique, which was used to explain the mechanism of formation about the radicals. From Fig. 7(c), none of the peaks about radicals were produced in the black, and four characteristic peaks of ˙OH radicals with intensities of 1:2:2:1 were observed on BTO and 0.06 A/BTO under the irradiation of visible light. Meanwhile, the signal intensities of BTO are weaker than the 0.06 A/BTO. Seen from the results, we can draw a conclusion that the ˙OH radicals generated on the BTO surface are less than the 0.06 A/BTO. The DMPO (5,5-dimethyl-1-pyrroline N-oxide) was chosen as a spin trap reagent to monitor the ˙O2 − radicals formed during the photocatalytic process. In Fig. 7(d), we cannot find the signals of ˙O2 − radicals in both BTO and 0.06 A/BTO when compared the to ESR signals in the reference sample. However, the signals of mixed free radicals can be detected in the BTO. A new series of signals of nitroxide radicals of DMPO that have characteristic peaks with intensities of 1:2:1:2:1:2:1 can be detected in the 0.06 A/BTO, which were derived from direct oxidation by single electron sources. Reference Wang, Sun, Ang, Tadé and Wang47 Thus, we speculated that the larger single electron sources exist in the 0.06 A/BTO photocatalyst.
To illuminate the charge separation process of the 0.06 A/BTO compound, the (VB XPS) of Bi7Ta3O18 were measured using a photon-energy of 1486.6 eV as shown in Fig. 7(e). Density functional theory calculations suggest Reference Yan, Lv, Li and Zou48 that the position of the VB edge of Bi7Ta3O18 is located at about 3.17 eV. The E CB of Bi7Ta3O18 was calculated to be 0.34 eV.
The 0.06 A/BTO demonstrated the best photocatalytic activity. It is interesting and important to study how A/BTO photocatalyst showed the efficient and stable properties. In the A/BTO system, the Bi7Ta3O18 and Ag absorb the photons coming from the visible-light irradiation and produce the electrons and holes. The Ag metal is good at electron capturing due to large work function. Reference He, Cao and Yu49 When the surface electrons of Ag are collective oscillations, LSPR would be produced. Reference Li, Yu, Low, Fang, Xiao and Chen50 Meanwhile, the local inner electromagnetic field could be induced, Reference Wu and Xu16 as shown in Fig. 8. To understand the enhanced mechanism of photocatalytic activity about the A/BTO in depth, we discussed the charge separation process and charge transfer between the Bi7Ta3O18 and Ag. As shown in Fig. 8, the enhancement process of the photocatalytic activity of A/BTO can be described as follows. The electrons of Bi7Ta3O18 were translated to the CB whereas the holes remained in its VB under the vis-light. The water molecule and OH− were oxidized, and the ˙OH active species by the photo excited holes stay in the VB for the VB edge of Bi7Ta3O18 (3.17 eV versus NHE) is more positive than the ˙OH/OH− potential (2.38 eV versus NHE), Reference Di, Xia, Ji, Wang, Yin, Xu, Chen and Li51 which could be summarized by following reaction: OH− + h+ → ˙OH. Reference Luo, Chen, Huang, Liu and Fang52 As the Fermi level of Ag (0.40 eV) is more positive than the CB band potential of Bi7Ta3O18 (0.34 eV), the electrons will easily go near the Ag nanoparticles and then recombine with the plasmon-induced holes when compared with the recombination of electron–hole pairs. Thus, the separation efficiency of the photo generated electron–hole pairs can be enhanced. Because the CB value of Bi7Ta3O18 and the Fermi level of Ag are more positive than the O2/˙O2–potential (−0.046 eV versus NHE), Reference Di, Xia, Ji, Wang, Yin, Xu, Chen and Li51 the photogenerated electrons cannot reduce O2 to generate ˙O2 −. The (˙OH) act as the important oxidizing species that have been reported. Reference Zhao, Wang, Yang, Fang, Zhang, Zhu, Tang and Huang2 Those radicals can effectively degrade the pollutant of RhB.
Schematic diagram of Ag/Bi7Ta3O18 (h) photocatalyst’s mechanism for the degradation of RhB.

IV. CONCLUSIONS
In this work, a series of new Ag/Bi7Ta3O18 photocatalysts were fabricated by the hydrothermal method and photoreduction method. From all the experiments and analysis, we can draw the two conclusions: The Ag0 nanoparticle loading on the surface of Bi7Ta3O18 can improve the photocatalytic activity, which contributed to the LSPR caused by the Ag nanoparticles onto the Bi7Ta3O18 photocatalysts surface. It promotes the electron–hole separation in the photocatalytic process of RhB degradation; the 0.06 A/BTO (h) photocatalysts showed the best photocatalytic activity. The excess concentration would occupy certain active sites on the BTO surface and then reduce the surface adsorption capability of the photocatalyst to the RhB. This study may shed some light on the fabrication of the new more effective photocatalysts under the visible-light irradiation.
ACKNOWLEDGMENTS
This work was financially supported by the Fundamental Research Funds for the Central Universities (Grant No. 53200859638) and the National Natural Science Foundation of China (NSFC Grant No. 51572245).