




Introduction
Discussion about the middle class and its socio-economic importance has become increasingly widespread in both the social sciences and the public sphere. Despite this growing interest, there is still no consensus on its conceptual framework, history, definition, evolution, or the criteria for its measurement. Defining the middle class is inherently complex, largely because of divergent contextual interpretations and the multidimensional nature of social stratification, including factors such as income, educational attainment, occupational status, and social capital (Atkinson and Brandolini Reference Atkinson, Brandolini, Gornick and Jantti2013; Bigot et al. Reference Bigot, Croutte, Muller and Osier2012).
Three main approaches are used to define the middle class in the literature: economic; sociological; and self-identification. The first, the economic approach, identifies the middle class primarily through income levels. Scholars often differentiate between relative and absolute income thresholds in this context, which can frequently yield divergent empirical conclusions. The second, the sociological approach, conceptualizes the middle class through determinants such as educational attainment and occupational status that influence social prestige and earning potential. The third, the self-identification approach, is where middle-class status depends on individuals’ subjective perceptions of their social status that are shaped by broader social values and personal expectations.
Changes in both the quantitative (size) and qualitative (structure) characteristics of the middle class depend on country-specific economic, social, and political dynamics. Recent empirical evidence illustrates a pervasive contraction of the middle class across developed countries during the 2000s (Eurofound 2024; OECD 2019), while the middle class was growing in many developing countries during the same period – driven by rapid economic expansion and urbanization (Birdsall Reference Birdsall, Rhee, Zhuang and Kanbur2014; Kharas Reference Kharas2017; World Bank 2021). However, since the mid-2010s, this upward trend has undergone a reversal in several developing regions, most notably North Africa and much of Latin America, which is attributable to political instability, the COVID-19 pandemic, and high inflation (Economic and Social Commission for Western Asia 2023; World Bank 2021).
This study contributes to the literature by examining the middle class within the specific context of a developing country – Turkey. While a considerable amount of the middle-class literature on Turkey has so far dealt with its historical and sociological dimensions (Arslan Reference Arslan2012; Avcıoğlu Reference Avcıoğlu1969; Boratav Reference Boratav1991; Keyder Reference Keyder1987; Keyman and İçduygu Reference Keyman and İçduygu2003; Öniş Reference Öniş and Herper1991; Pamuk Reference Pamuk2014), there are relatively few studies examining the middle class in Turkey from an economic perspective (Clement et al. Reference Clement, Rougier, Berrou, Combarnous and Darbon2022; Kapas and Liang Reference Kapas and Liang2009; OECD 2019). Studies adopting an economic approach have estimated the size and economic strength of the middle class across multiple developing countries, including Turkey (Clement et al. Reference Clement, Rougier, Berrou, Combarnous and Darbon2022; Kapas and Liang Reference Kapas and Liang2009; OECD 2019). Their findings provide evidence of an expansion of Turkey’s middle class and more prevalent socio-economic conditions associated with “middle-class life.” They, however, examine the 2002–2013 period, which is characterized by relatively favorable economic and social conditions. Indeed, since 2018, Turkey has experienced growing macroeconomic imbalances – a sharp depreciation of the Turkish lira, repeated currency shocks, and the COVID-19 health crisis combined with rising inequality and persistent high inflation (OECD 2023, 2024). Therefore, Turkey represents an interesting case for examining whether recent economic conditions affect middle-class size, and whether any changes in the size of the middle class reflect distributional or real purchasing-power shifts, or both.
This study first seeks to explore the evolution of the middle-class size in Turkey over time, particularly the extent to which changing economic and social conditions – before and after 2018 – have influenced it. In doing so, we adopt an economic approach using microdata from the 2006–2023 Survey on Income and Living Conditions (SILC). We quantify the middle-class size using alternative relative income ranges: narrow (75–125 percent); moderate (70–150 percent); and broad (75–200 percent) of the national median equivalized household income. While the primary analysis relies on a relative median-based definition of the middle class, such measures alone may not fully capture long-term changes in welfare or purchasing power during periods of persistent inflation and macroeconomic instability. Consequently, the analysis is extended by using two absolute income benchmarks to identify the middle class: the global $11–$110 (2011 purchasing power parity [PPP]) standard (Kharas Reference Kharas2017); and a fixed real-income threshold anchored to the 2017 median. This extension enables us to understand how the choice of different thresholds affects the middle-class size and to capture the picture of Turkey’s middle class without relying on a single definition.
Second, this study examines the profile of the middle class and the evolution of its composition. In doing so, we focus on the socio-economic characteristics of the middle-class population, including age, education, gender, marital status, household type, employment status, sector, informality, and occupation. In this way, the study goes beyond a purely income-based definition and provides additional insights into the socio-economic dimensions of the middle class.
Third, this study aims to evaluate middle-class living conditions through indicators such as financial strain, material deprivation, and housing and environmental conditions. Indeed, the recent increase in inflation in Turkey, together with rising housing, healthcare, and education costs, as well as broader socio-economic fluctuations, may have reduced the living standards of the middle class and led to qualitative changes in its structure.
The rest of the paper is structured as follows: the Literature review assesses the relevant literature and theoretical frameworks, while the historical background, academic studies, and approaches section contextualizes academic research on Turkey’s middle class within its broader historical and socio-economic context. The next section outlines the data, variables, and methods, followed by sections presenting the empirical findings and the conclusion.
Literature review
In both developing and developed countries, the middle class has been a widely debated issue in social science research, including political science, sociology, and economics. A considerable amount of literature emphasizes its important role in sustaining economic growth, preserving democratic values, and ensuring social stability (Banerjee and Duflo Reference Banerjee and Duflo2008; Birdsall et al. Reference Birdsall, Graham and Pettinato2000; Pressman Reference Pressman2007). Although the importance of the middle class is widely acknowledged, there is no single and universally accepted definition. Divergent perspectives concerning the definition and characteristics of the middle class exist in the literature.
The development of industrial capitalism gave rise to the modern concept of class and the social science literature on the middle class, particularly sociology (Öngen Reference Öngen2014). Classical class analysis draws mainly upon Marxist and Weberian traditions (Arslan Reference Arslan2012). Marxism delineates class through production relations – contrasting owners (bourgeoisie) with laborers (proletariat) (Marx and Engels 2008 [Reference Marx and Engels1848]) – whereas Weber situates class within multidimensional social stratification through market position, social status, occupation, and lifestyle (Erikson and Goldthorpe Reference Erikson and Goldthorpe1992; Goldthorpe Reference Goldthorpe1987, Reference Goldthorpe1996). Subsequent transformations in capitalism, production structures, work patterns, and class relations precipitated the emergence of Neo-Marxist and Neo-Weberian frameworks. Bourdieu (Reference Bourdieu1989) posits that the middle class is inherently susceptible to instability, moving towards the proletariat during economic downturns or the bourgeoisie during economic growth. Similarly, Braverman (Reference Braverman1974) contends that automation and de-skilling are fostering a proletarianization of white-collar labor. According to Neo-Weberian theorist Goldthorpe (Reference Goldthorpe1987, Reference Goldthorpe1996), class is determined by employment conditions and socio-economic status, with job security, education, and occupational autonomy being the primary determinants separating the middle and working classes (Erikson and Goldthorpe Reference Erikson and Goldthorpe1992).
Reflecting these theoretical foundations, the literature identifies the middle class mainly through three approaches: sociological; self-identification; and economic. The sociological approach emphasizes occupational status, educational attainment, and lifestyle. For example, both OECD (2019) and Eurofound (2024) reports primarily use income benchmarks (typically 60–200 percent or 75–200 percent of the median) to define the middle class, while simultaneously scrutinizing socio-economic factors such as job roles, skill sets, and employment trends. OECD (2019) finds that there was a contraction in the middle-class segment, shifting from approximately 64 percent in the 1980s to 61 percent by the mid-2010s, and accompanied by occupational upgrading, rising housing costs, and job insecurity. Correspondingly, Eurofound (2024) reveals, based on European Union (EU)–SILC data, that approximately two-thirds of EU member states witnessed a contraction from 2006 to 2021, along with greater polarization and higher vulnerability among younger and less educated populations.
A second approach moves beyond objective sociological criteria and relies on subjective class identity derived from survey self-identification. Remarkably, the perceived magnitude of the middle class often diverges sharply from objective measures. In the United States, for instance, while the middle-class share declined from 61 percent in 1971 to 52 percent in 2022 based on objective indicators, 89 percent of respondents in a Pew survey (Pew Research Center 2015) identified their status as middle class. Analogously, 72 percent of respondents in Turkey identified themselves as middle class in the 2022 World Values Survey.Footnote 1 The widespread tendency toward self-identification as middle class, even in the absence of objective membership, suggests that perceptions are mediated by social values and expectations. Qualitative evidence reinforces this view: research on parenting in İstanbul shows that middle-class identity extends beyond income metrics, including parenting practices, educational aspirations, lifestyle choices, and secular–modern values (Kolluoğlu and Dinçer Reference Kolluoğlu and Dinçer2023).Footnote 2
The third and most widely used approach to measure the middle class in empirical research is the income-based economic approach. It is more objective than self-identification, but less comprehensive than the sociological approach. This method typically defines the middle class as those within a certain interval around the median income. The reason for its widespread use in the literature is the strong correlation between economic conditions and class positions (Eurofound 2024).
Within this literature, the middle class is delineated through either absolute or relative income thresholds, but there is no empirical consensus on specific cut-offs. The absolute approach employs fixed, PPP-adjusted thresholds above the poverty line. Notable benchmarks include $2–$10 (2011 PPP) per day (Banerjee and Duflo Reference Banerjee and Duflo2008), $2–$13 (Ravallion Reference Ravallion2010), $10–$50 (López-Calva and Ortiz-Juarez Reference López-Calva and Ortiz-Juarez2014), and $11–$110 (2011 PPP) per capita per day (Kharas Reference Kharas2017). The relative approach, on the other hand, delineates the middle class in relation to the national median income. For instance, the OECD (2019) uses a median threshold of 75–200 percent. Notable thresholds relative to the national median include narrower intervals such as 75–125 percent (Derndorfer and Kranzinger Reference Derndorfer and Kranzinger2021) and 80–140 percent (Verwiebe and Wiesböck Reference Verwiebe and Wiesböck2021) to broader intervals like 60–225 percent (Blackburn and Bloom Reference Blackburn and Bloom1985) or 60–200 percent (Salverda and de Jong Reference Salverda and de Jong2017; Vaughan-Whitehead Reference Vaughan-Whitehead2016).Footnote 3
Among studies that adopted the relative approach, those focusing on European countries provide important insights into middle-class dynamics. For instance, Derndorfer and Kranzinger (Reference Derndorfer and Kranzinger2021) use a threshold of 75–125 percent of the median equivalized household income to examine the middle class in the EU countries. They provide evidence of contracting middle classes in eighteen out of twenty-six European countries from 2004 to 2014, and they argue that income redistribution is the most important determinant of the cross-country variation in middle-class size across European countries. Ranci et al. (Reference Ranci, Beckfield, Bernardi and Parma2021), in a study of eight EU countries between 2007 and 2012, report that economic insecurity has spread beyond low-income groups and affects even the middle class through episodes of temporary poverty and financial hardship. More recently, Derndorfer (Reference Derndorfer2025) examines the middle class in thirteen Western European countries over the 2002–2018 period by using the 70–150 percent threshold of the national median income to define the middle class, and they conceptualize insecurity as the risk of downward occupational mobility. The study shows that although the overall size of the middle class does not uniformly decline, rising insecurity within the middle class is associated with stronger support for radical right parties, highlighting the political consequences of middle-class vulnerability.
Overall, there are multiple approaches to defining the middle class in the literature, and each has its own strengths and limitations. As Pressman (Reference Pressman2007) notes, all its definitions remain ultimately arbitrary. Income-based assessments are widely used to define the middle class in the literature, especially in economic research. However, some scholars argue that income-based approaches cannot fully capture the multidimensional nature of the middle class (Atkinson and Brandolini Reference Atkinson, Brandolini, Gornick and Jantti2013), and, for this reason, they argue for integrating broader sociological dimensions besides income criteria to ensure a more comprehensive analytical framework.
Middle class in Turkey: historical background, academic studies, and approaches
Similar to global trends, the middle class in Turkey has been affected by changes in the economic model, political transformations, social developments, education levels, and income disparity. Its formation and subsequent transformation have been mediated by distinct dynamics across different periods. Consequently, the historical, economic, and social development of the middle class in Turkey constitutes the foundational background for academic studies on this subject. In alignment with these transformations, the literature on Turkey is divided into three main periods based on its economic and social transitions:
-
1. 1923–1979: State-led development and structural transformation;
-
2. 1980–2000: Neoliberal transformation and integration into globalization;
-
3. Post-2000: Financial growth and a debt-centered economic structure.
The first period (1923–1979) covers early Republican modernization and import-substitution industrialization. During this time, Turkey adopted a range of economic strategies, including free markets, state-led planning, and protectionism (Boratav Reference Boratav2018). Despite these shifts in economic models, the period reveals a consistent pattern in the formation of the middle class and the state’s role in shaping it. In the early Republican period (1923–1945), the government actively encouraged the development of a modern middle class comprising civil servants, educators, and administrators (Avcıoğlu Reference Avcıoğlu1969). In later decades, protectionist and import-substitution policies expanded this group to include engineers, technicians, industrial workers, small tradespeople, and the self-employed (Avcıoğlu Reference Avcıoğlu1969; Boratav Reference Boratav1991; Keyder Reference Keyder1987; Pamuk Reference Pamuk2014).
During the second period (1980–2000), the implementation of neoliberal reforms, the dismantling of import-substitution industrialization, and deeper integration into global markets significantly reshaped the structure of Turkey’s middle class. The transition to export-oriented growth stimulated the expansion of the services sector, and urban white-collar employees increasingly came to be identified as the “new middle class” (Boratav Reference Boratav1991; Öniş Reference Öniş and Herper1991). Pamuk (Reference Pamuk2014) associates this transformation with processes of urbanization and the growth of the service sector in major cities, while Keyder (Reference Keyder1987) emphasizes the role of real estate investment and homeownership in strengthening their economic standing. At the same time, neoliberal policy framework deepened urban inequality and social exclusion (Yükseker Reference Yükseker, Öniş and Şenses2009) and privatization, deregulation, and the weakening of labor unions contributed to the contraction of traditional middle-class groups, particularly industrial workers and small producers (Boratav Reference Boratav2018). Although white-collar workers gained relative economic influence (Öniş Reference Öniş and Herper1991), the economic crises of the 1990s constrained middle-class expansion and intensified its vulnerability (Pamuk Reference Pamuk2014).
In the third period – the 2000s – economic growth, globalization, neoliberal reforms, and political change reshaped Turkey’s middle class. Between 2002 and the mid-2010s, particularly during the late 2000s, middle-class expansion was largely associated with sustained growth, with gross domestic product (GDP) increasing by about 5 percent annually and per capita income rising from $3,500 to $10,000 (Keyman Reference Keyman2010; Öniş Reference Öniş2012; World Bank 2014). Improvements in several socio-economic indicators, which are likely to support the expansion of the middle class, also marked this period. While poverty, inequality, inflation, and informal employmentFootnote 4 declined, education, employment, and female labor force participation improved. Expanded access to social services further supported these improvements. Buğra and Adar (Reference Buğra and Adar2008) suggest that the combination of social assistance programs and broader access to education and healthcare allowed low-income households to move into the middle class. At the same time, greater access to credit stimulated consumption of housing, automobiles, and durable goods, but also contributed to rising household indebtedness. As emphasized by the World Bank (2014) and Clement et al. (Reference Clement, Rougier, Berrou, Combarnous and Darbon2022), this expansion of the middle class was driven largely by credit-financed consumption rather than by a structurally sustainable economic model.
Following this expansion, Turkey has experienced macroeconomic instability, high and persistent inflation, rapid depreciation of the Turkish lira, and shocks led by the COVID-19 pandemic, especially after 2018. During this period, price increases eroded wage adjustments and, thus, weakened purchasing power. While the average annual inflation rate was 8.5 percent between 2006 and 2017, it rose to 20 percent in 2018 and exceeded 65 percent in subsequent years. As a result, Turkey ranked sixth among countries with the highest inflation in 2024 (IMF 2024). Housing costs increased even more rapidly than overall prices. Between 2014 and 2024, consumer prices rose by approximately 946 percent, while housing prices increased by 1,950 percent, according to Central Bank of the Republic of Turkey (CBRT/TCMB) data. In addition, from 2020 to 2024, the annual rent growth rate outpaced the official inflation rate (BETAM 2024). Sectoral inflation became particularly pronounced in 2023, when price increases in healthcare exceeded 80 percent, well above the official consumer price index (CPI) rate of 65 percent.
These developments, combined with the implemented monetary and interest rate policies, worsened inequality in Turkey. OECD (2024) data show that the Gini coefficient increased from 0.40 before 2018 to 0.43 in 2022, ranking Turkey’s Gini coefficient the third highest among OECD countries. Similarly, TurkStat (2024) data indicate significant increases in the 80th percentile/20th percentile and 90th percentile/10th percentile ratios, suggesting a rising income share for top earners.
The combined impact of unstable growth, high and persistent inflation – especially in housing, education, and healthcare – and rising inequality may have caused declining real incomes and living standards for Turkey’s middle class, and potentially a contraction in its size.Footnote 5 Although historical and sociological studies broadly agree that the middle class expanded in the 2000s, research adopting an explicitly economic perspective remains relatively limited. For example, Balıkçıoğlu and Dalgıç (Reference Balıkçıoğlu and Dalgıç2015), using a 70–150 percent median income threshold, estimate that the middle class accounted for 41 percent of households in 2011. Clement et al. (Reference Clement, Rougier, Berrou, Combarnous and Darbon2022), analyzing Brazil, Côte d’Ivoire, Turkey, and Vietnam, estimate that the middle-class share in Turkey in 2013 ranges from about 21 percent to 76 percent, depending on whether absolute PPP-based thresholds (e.g. $2–$10 or $10–$100 per capita per day) or relative thresholds based on the national median per capita income are used. These findings highlight the sensitivity of estimates to the choice of income thresholds. The OECD (2019) estimates the middle-class size in Turkey as 53 percent in 2014. However, no study has systematically analyzed the post-2018 period when macroeconomic conditions relatively deteriorated.
This study estimates the size of the middle class in Turkey using income-based criteria and examines its evolution over time, with particular attention to the periods before and after 2018. In addition, the middle-class size is calculated by using a range of relative and absolute income thresholds commonly applied in the literature. The analysis also incorporates sociodemographic and household characteristics to provide a broader perspective beyond income alone. The analysis further examines changes in the living standards of the middle class before and after 2018.
Data, variables, and methods
This study employs cross-sectional microdata from the 2006–2023 SILC conducted by TurkStat. The SILC provides detailed information on income, demographic characteristics, employment conditions, and living conditions such as homeownership, financial hardship, and material deprivation. The data enable the assessment of individuals’ socio-economic status, social welfare, and economic inequality.
Our income variable is equivalized disposable household income, defined as total household income after tax and deductions adjusted for household size and composition. The SILC reports total household disposable income. To account for differences in household size and composition, we use the OECD equivalence scale. The scale assigns values for household members: 1 for the first adult or reference person, 0.5 for other adults, and 0.3 for children under the age of fourteen years. These weights are summed to calculate the equivalized household size, and disposable income is then divided by this sum. It should be noted that income variables in the SILC refer to the previous calendar year.
The primary specification follows a relative income approach. We quantify the middle-class share using multiple percentage intervals around the national median equivalized household disposable income, categorized as narrow, intermediate, and broad specifications. Using multiple thresholds allows us to assess how the size of the middle class varies depending on the chosen income interval, and thereby to capture a broader and more nuanced picture of the middle class without relying on a single definition.
Beyond identifying its size, the analysis scrutinizes the composition of the middle class and its evaluation over time. Therefore, we look at the demographic characteristics such as age, educational attainment, gender, marital status, and household type of the middle-class alongside labor-related features including employment status, sectoral distribution, informality, occupation, and contract type.
Furthermore, the study probes middle-class living standards using indicators related to housing status (homeownership or tenancy status) and conditions, financial situation, material deprivation, and environmental quality and their changes over time. Financial strain is measured by arrears (mortgage, rent, or utilities); the subjective ease of “making ends meet”; and the perceived burden of household expenses and debt. Additional indicators of financial situation include the ability to afford regular holidays, sufficient nutrition, unexpected expenses, and adequate heating. Material deprivation is captured through the ability to afford basic goods and services, such as replacing worn-out furniture or clothing, owning proper footwear, or covering unexpected expenses. Environmental conditions are assessed via housing problems such as water leakage, poor insulation, lack of natural light, noise, pollution, and exposure to crime.
Relative measures capture shifts within income distribution, whereas absolute benchmarks allow for the evaluation of changes in real purchasing power over time. The primary analysis, therefore, adopts a relative median-based framework, widely used in the literature and appropriate for examining changes in income positioning within the national distribution. At the same time, we incorporate two absolute benchmarks into our analysis to enable comparison across income definitions.
The first benchmark follows the global middle-class definition proposed by Kharas (Reference Kharas2017), which delineates the middle class as individuals with a daily per capita income between $11 and $110 in 2011 PPP terms. To better capture differences in economic resilience, we adopt the vulnerability framework of López-Calva and Ortiz-Juarez (Reference López-Calva and Ortiz-Juarez2014). Under this framework, the middle class is segmented into two analytical sub-groups:Footnote 6 (1) vulnerable middle class ($11–$22 per day) – households above the poverty line but highly exposed to downward mobility in the event of adverse shocks; and (2) secure middle class ($22–$110 per day) – households with a sufficient income cushion to resist macroeconomic shocks.
As a secondary absolute benchmark, we construct a fixed real standard anchored to the median equivalized disposable income in 2017, when we identified the peak of middle-class expansion in the primary analysis. Instead of redefining the middle class relative to each annual median, the 2017 benchmark is held constant in real terms and adjusted for other years using the CPI. This approach allows us to assess the share of individuals who maintain the purchasing power associated with the 2017 middle-class benchmark.
Taken together, these comparative frameworks enable us to assess whether the empirical outcomes are contingent upon the choice of income definitions and elucidate the difference between distributional shifts and changes in real purchasing power, especially in periods of high inflation and macroeconomic volatility.
Results
This section presents the empirical findings through a fourfold analytical structure. First, we present estimates of middle-class sizes using income thresholds relative to the national median income. Second, we provide the findings regarding the sociodemographic composition and employment characteristics of the middle class. Third, the living standards of the middle class are assessed through several indicators. Finally, we discuss the results of absolute income specifications and compare them with our relative median-based results.
The size of the middle class
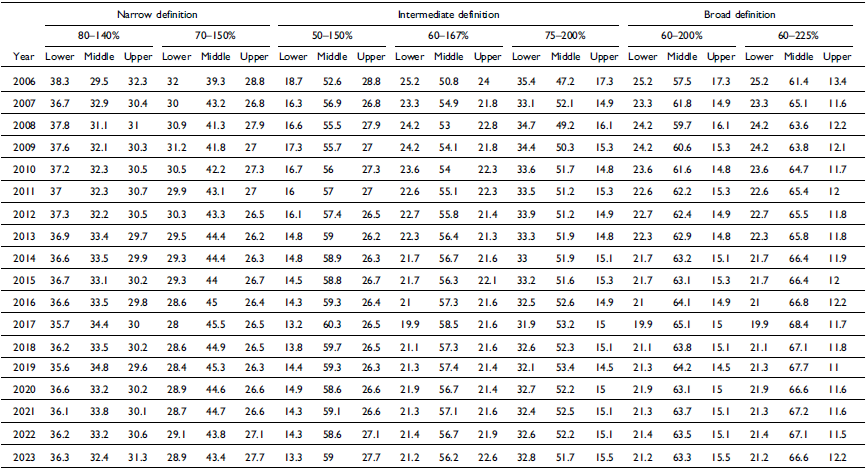
Figure 1 provides annual middle-class size estimates for the period 2006–2023 under narrow, intermediate, and broad relative income definitions.Footnote 7
Middle-class size across alternative relative income definitions (2006–2023). Middle-class sizes are expressed as a share of the total population (in percentages). They are calculated using equivalized household disposable income and the following national median-based thresholds: 70–150 percent (narrow); 75–200 percent (intermediate); and 60–225 percent (broad). The vertical line marks 2017, the year in which the middle-class share reached its peak.
Source: Turkish Statistical Institute (TurkStat) 2006–2023 Survey of Income and Living Conditions; authors’ own calculations

As illustrated in Figure 1, the middle-class share exhibited a sustained expansion until 2017, after which it entered a period of contraction. Remarkably, despite this post-2017 decline, the 2023 levels remain above those observed in 2006. This pattern holds across all threshold specifications.
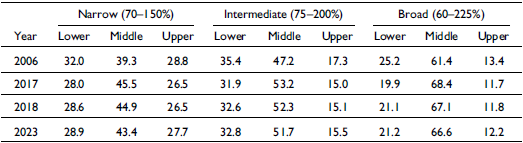
Table 1 provides income group composition to highlight the underlying distributional shifts. From 2006 to 2017, Turkey witnessed a period of middle-class expansion and marginal improvements in distribution. As evidenced in Table 1, the lower-class share contracted, the middle class expanded, and the upper class experienced a modest decline across all income intervals. For instance, according to the 75–200 percent threshold, the lower and upper classes contracted between 2006 and 2017 from 35.4 percent to 31.9 percent and from 17.3 percent to 14.9 percent, respectively, and the decline was more pronounced for the lower class. As a result, the middle class expanded from 47.2 percent to 53.2 percent.
Income group composition under alternative relative income definitions

Table 1 Long description
The table presents income group composition data across different years and income intervals. It has 4 rows and 9 columns. The columns are labeled as follows: Year, Narrow Lower, Narrow Middle, Narrow Upper, Intermediate Lower, Intermediate Middle, Intermediate Upper, Broad Lower, Broad Middle, and Broad Upper. The rows are labeled with the years 2006, 2017, 2018, and 2023. The table shows the percentage values for each income group within the specified intervals for the given years. Row 1: 2006, 32.0, 39.3, 28.8, 35.4, 47.2, 17.3, 25.2, 61.4, 13.4. Row 2: 2017, 28.0, 45.5, 26.5, 31.9, 53.2, 15.0, 19.9, 68.4, 11.7. Row 3: 2018, 28.6, 44.9, 26.5, 32.6, 52.3, 15.1, 21.1, 67.1, 11.8. Row 4: 2023, 28.9, 43.4, 27.7, 32.8, 51.7, 15.5, 21.2, 66.6, 12.2.
Source: Turkish Statistical Institute (TurkStat) 2006, 2017, 2018, 2023 Survey of Income and Living Conditions; authors’ own calculations.
Notes: Class sizes represent the percentage distribution of the total population across income groups. Table A1 in the Appendix provides statistics for all years.
In 2017, the middle class reached its largest share, and the lower class dropped to its lowest share across all income thresholds. This expansion of the middle class from 2006 to 2017 can largely be attributed to the favorable macroeconomic environment, particularly during the late 2000s, characterized by strong economic growth, declining inflation, and reduced income inequality.
In line with these macroeconomic improvements, the labor share in GDP (measured as compensation of employees as a share of GDP) in Turkey increased from around 26–27 percent in the late 2000s to approximately 32 percent by 2016 (TurkStat 2025), suggesting a temporary shift in income distribution in favor of labor. Real wage growth and the significant increase (about 23 percent; Aslan Reference Aslan2019) in real minimum wage in 2016 also supported this trend. However, the trends observed in the first period reversed after 2017. During the second period (2018–2023), the share of the lower class increased again across all income thresholds (Table 1). The share of the middle class declined during the same period. Meanwhile, the decline in the upper class in the first period ceased after 2017, and there was a modest increase from 2018 onwards.
Taken together, between 2006 and 2017, Turkey experienced middle-class growth driven primarily by upward mobility from lower-income groups. While the middle class expanded, the lower and upper classes’ shares decreased; however, the decline was significantly more pronounced for the lower class.
In contrast, the post-2017 period indicates a partial contraction of the middle class across all definitions. Note that the middle-class share in 2023, however, persists above its 2006 level, and although the contraction does not reverse the gains of the previous decade, it indicates a partial erosion of earlier distributional improvements. This recent contraction is primarily associated with a modest expansion of the lower-income group, while changes in the upper-income group remained limited. The recent contraction and transitions out of the middle class are observed in a period of persistent and high inflation. These findings are consistent with the literature focusing on the distributional consequences of high inflation. Indeed, it seems that economic crises and rising inflation may have triggered movements out of the middle class toward both lower- and upper-income groups.
In the following two sections, we use the broad definition (75–200 percent of the national median) to examine sociodemographic composition, labor market features, and living standards of the middle class in Turkey.
The change in the profile of the middle class
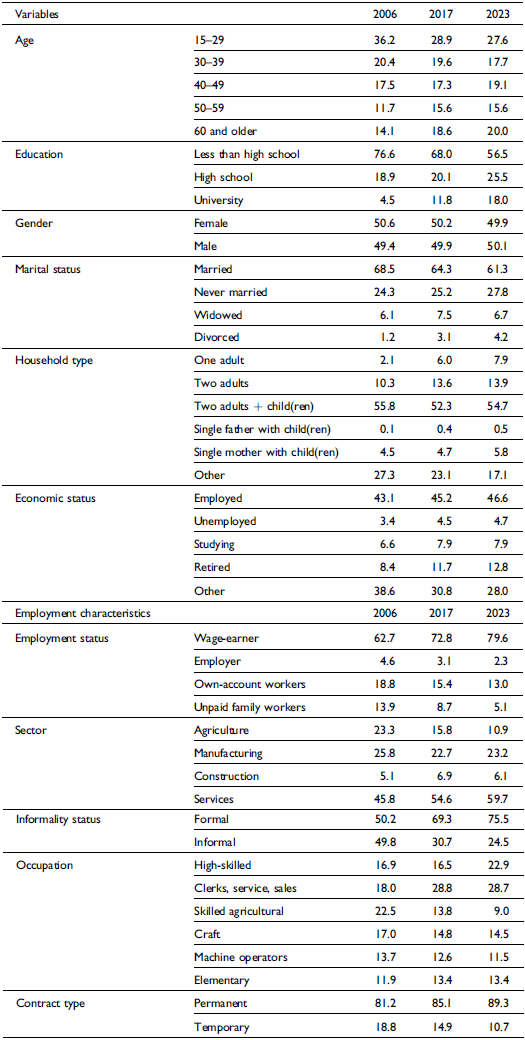
Table 2 shows the middle class’s age and education distributions, employment structure, sectoral composition, and marital status. As seen from Table 2, the proportion of those aged fifteen to twenty-nine years within the middle class has diminished from 36.2 percent in 2006 to 27.6 percent in 2023, while that of those fifty years and older has increased considerably from 25.8 percent to 35.6 percent. It seems that the decline in the share of youth within the middle class closely parallels the reduction of this age group in the overall population. This suggests that the observed change is largely consistent with the aging of the population rather than necessarily reduced participation of young cohorts in middle-class status.
Socio-economic and employment characteristics of the middle class (in percentages)

Table 2 Long description
A table comparing socio-economic and employment characteristics of the middle class across the years 2006, 2017, and 2023. The table has 12 rows and 4 columns. Column headers are Variables, 2006, 2017, and 2023. Row labels include Age, Education, Gender, Marital status, Household type, Economic status, Employment characteristics, Sector, Informality status, Occupation, and Contract type. Each row provides percentages for the respective years. Notable trends include a decrease in the proportion of those aged fifteen to twenty-nine years and an increase in those fifty years and older. Education levels show a rise in university attendance. Employment characteristics indicate a shift towards more wage-earners and a decline in own-account workers. The services sector shows growth, while agriculture and manufacturing decline. Informality status shows a decrease in informal employment. Occupations show an increase in high-skilled and clerical roles. Contract types indicate a rise in permanent employment and a decrease in temporary employment.
Source: Turkish Statistical Institute (TurkStat) 2006, 2017, 2023 Survey of Income and Living Conditions; authors’ own calculations.
Notes: The sample in this table consists of individuals aged fifteen years and older. For the employment characteristics, the sample is restricted to those who are employed at the time of the survey. Individuals with equivalized household incomes ranging from 75 percent to 200 percent of the national median are considered middle class. The full table (Table A2) is available in the Appendix.
However, demographic aging may alter the vulnerability profile of the middle class. As income resources vary across age groups, the interaction between aging structure and high inflation would affect real income dynamics and exposure to economic shocks. For instance, an aging middle class has resulted in a larger share of retirees. Given that retirees’ real incomes have depreciated significantly relative to the median income in recent years, this demographic transition probably reduces the aggregate purchasing power of the middle class.
The employment structure of the middle class has also shifted. From 2006 to 2023, shares of own-account workers and unpaid family workers within the middle class declined from 18.8 percent to 13.0 percent, and from 13.9 percent to 5.1 percent, respectively. Conversely, the share of salaried employees ascended from 62.7 percent to 79.6 percent, implying that the middle class is thus becoming increasingly composed of salaried workers. These figures suggest that it has become more difficult to achieve or maintain middle-class status through self-employment or small-scale business ownership.
At the same time, as the income levels of salaried workers have declined relative to earlier periods, the economic security of the middle class has weakened. According to TurkStat data, the share of labor compensation in GDP fell from 32 percent in 2016 to 23.6 percent in 2022. Existing studies also show that minimum wage employment has become increasingly prevalent, while the minimum wage has effectively become the average wage (Aslan Reference Aslan2019). The report by DİSK-AR (2024) indicates that approximately 50 percent of all salaried employees earn at or near the minimum wage.
The sectoral composition of the middle class has also changed. Sectoral changes show that the share of agriculture in middle-class employment has declined from 23.3 percent in 2006 to 10.9 percent in 2023, while the services sector has risen from 45.8 percent to 59.7 percent. Many workers have moved from agriculture into services, where many of these jobs are low paid and insecure. This shift, therefore, is likely to constrain income gains of the middle class.
At the same time, formal employment has increased, and informal work declined, suggesting improved job security for the middle class in theory. If these gains are outweighed by the decrease in real formal wages, the middle class’s vulnerability, consequently, can be intensified.
Over the last decade, educational attainment has increased significantly in Turkey (Table A2), and it has also shifted within the middle class. The share with less than high school education within the middle-class population has fallen from 76.6 percent in 2006 to 56.5 percent in 2023, while that of university graduates has increased from 4.5 percent to 18.0 percent. Although the educated population has increased, as previously noted, education may not fully translate into higher incomes due to structural factors, including the growing concentration of employment in low value-added service occupations, the declining share of labor in national income, the increasing prevalence of minimum-wage employment, and the erosion of wages under high inflation.
There have been notable changes in the family structure of the middle class. The share of married individuals has declined from 68.5 percent in 2006 to 61.3 percent in 2023, whereas that of divorced individuals has increased from 1.2 percent to 4.2 percent. Since married individuals have the advantage of benefiting from dual incomes, they tend to occupy a relatively more economically sustainable position within the middle class. In contrast, single-earner households, especially single-parent families, often face increasing difficulty in maintaining their middle-class status. The rise in divorce rates appears to weaken the income resilience of the middle class and amplify the socio-economic vulnerability, especially among single-parent households.
Overall, Turkey’s middle class expanded up to 2017 but contracted thereafter. Demographic aging and the shift toward salaried employment in the services sector appear to be associated with vulnerability patterns after 2017.
Changes in living standards of the middle class (2006–2023)
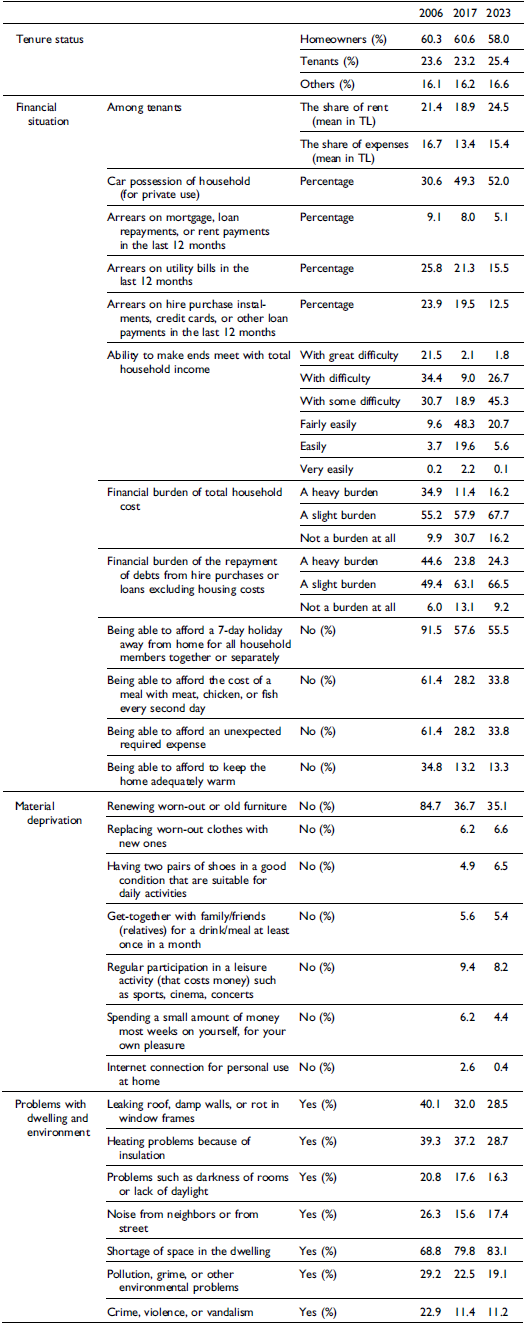
Table 3 indicates that Turkey’s middle class has undergone different living standards changes in two periods, particularly during the expansion (2006–2017) and contraction (2018–2023) periods.
Living standards of the middle class (in percentages)

Table 3 Long description
The table presents data on the living standards of the middle class in Turkey, comparing percentages across the years 2006, 2017, and 2023. It includes various categories such as tenure status, financial situation, material deprivation, and problems with dwelling and environment. The table has 10 rows and 10 columns, with column headers including Tenure status, Financial situation, Material deprivation, and Problems with dwelling and environment. Each row provides specific data points for the years 2006, 2017, and 2023. For example, the percentage of homeowners decreased from 60.3 in 2006 to 58.0 in 2023, while the percentage of tenants increased from 23.6 in 2006 to 25.4 in 2023. The table also shows changes in financial burdens, car possession, and ability to meet household income, among other factors.
Source: Turkish Statistical Institute (TurkStat) 2006, 2017, 2023 Survey of Income and Living Conditions; authors’ own calculations.
Notes: The sample in this table consists of individuals aged fifteen years and older. Individuals with equivalized household incomes ranging from 75 percent to 200 percent of the national median are considered middle class. The full table (Table A3) is available in the Appendix.
Homeownership among the middle class remained relatively stable at around 60 percent between 2006 and 2017, while tenancy rates remained at 26 percent. The indicators of financial hardship provide evidence of improvement in economic well-being among the middle-class population between 2006 and 2017. Those reporting “great difficulty” making ends meet fell from 21.5 percent to 2.1 percent, and “with difficulty” fell from 34.4 percent to 9.0 percent. Perceptions of the financial burden of household expenses also changed among the middle class. The “heavy burden” share of total household expenses declined from 34.9 percent to 11.4 percent, whereas the “slight burden” share increased from 55.2 percent to 57.9 percent. Similarly, there are declines in the share of the middle-class population reporting difficulty in paying bills and those unable to meet credit card or loan obligations. Taken together, these trends point to a reduction in financial insecurity.
Similarly, material deprivation indicators have also improved. In 2006, 61.4 percent of the middle class reported being unable to afford a meal including meat, chicken, or fish every second day; by 2017 this figure had declined to 28.2 percent. The share unable to afford a one-week holiday decreased from 91.5 percent to 57.6 percent, whereas the proportion unable to cover an unexpected expense fell from 61.4 percent to 28.2 percent. These improvements suggest an improvement in the standard of living of the middle class between 2006 and 2017.
However, the period after 2017 presents a different pattern. The 2018–2023 period is characterized by a contraction of the middle class, accompanied by renewed economic pressures on middle-class vulnerability. While certain indicators show renewed pressures after 2017, living standards in 2023 remain higher relative to 2006 in several dimensions, particularly regarding extreme financial difficulty.
In this period, middle-class homeownership declined from 60.6 percent in 2017 to 58.0 percent in 2023, whereas tenancy increased from 23.2 percent to 25.4 percent (Table 3). At the same time, several housing quality indicators continued to improve relative to 2006, although the percentage of people living in cramped conditions increased from 79.8 percent in 2017 to 83.1 percent in 2023, suggesting growing pressure on space conditions.
Financial indicators display a mixed pattern. The proportion of middle-class individuals reporting difficulty in making ends meet increased sharply, rising from 9.0 percent in 2017 to 26.7 percent in 2023. Similarly, those having “some difficulty” also rose significantly, from 18.9 percent to 45.3 percent. By contrast, the share reporting “great difficulty” changed only slightly, declining from 2.1 percent to 1.8 percent. Consumption indicators moved in a similar direction after 2017. The proportion unable to consume meat, chicken, or fish every second day increased from 28.2 percent to 33.8 percent. However, in some indicators, improvements continued even after 2017. For example, arrears on mortgage, rent, and utility payments steadily declined within the middle class between 2006 and 2023.
Taken together, the 2017–2023 period represents a phase characterized by the contraction of the middle class, a deterioration in its living standards, particularly in housing affordability, in the ability to make ends meet, and in material deprivation. Nevertheless, many indicators remain better than in 2006, indicating that the post-2017 developments represent an erosion of earlier gains rather than their full reversal.
Comparison of relative and absolute measures of middle class
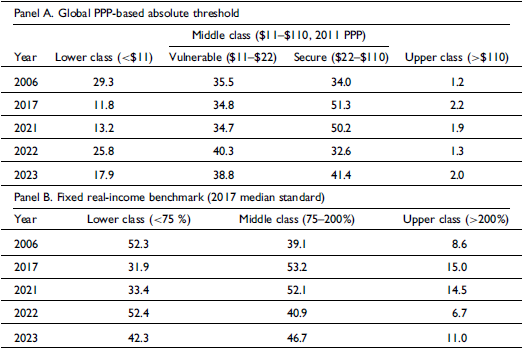
Table 4 presents the results of absolute benchmarks: the PPP based and the fixed real income. As seen from Table 4, both absolute measures point to an expansion of the middle class between 2006 and 2017. As noted, the middle class is divided into vulnerable and secure segments under the PPP-based definition. The secure segment increased from 34.0 percent in 2006 to 51.3 percent in 2017. A similar pattern is observed over the same period when the fixed 2017 real benchmark is used to identify the middle class. The middle-class population share rose from 39.1 percent to 53.2 percent. Taken together, these findings suggest that the expansion from 2006 to 2017 reflects not only distributional shifts but also a substantial increase in real purchasing power.
Middle-class size using alternative absolute benchmarks (in percentages)

Table 4 Long description
The table compares the size of the middle class using two different absolute benchmarks over several years. It has two panels: Panel A and Panel B. Panel A uses a global PPP-based absolute threshold, while Panel B uses a fixed real-income benchmark based on the 2017 median standard. Each panel contains data for the years 2006, 2017, 2021, 2022, and 2023. Panel A divides the middle class into three segments: Lower class (<11), Vulnerable (11–22), Secure (22–110), and Upper class (>110). Panel B divides the population into Lower class (<75 percent), Middle class (75–200 percent), and Upper class (>200 percent). Each row lists the percentage of the population in each class for the given year. Notable trends include an increase in the middle class from 2006 to 2017 in both panels, with the secure segment in Panel A increasing from 34.0 percent to 51.3 percent and the middle class in Panel B rising from 39.1 percent to 53.2 percent.
Source: Turkish Statistical Institute (TurkStat) 2006–2023 Survey of Income and Living Conditions; authors’ own calculations.
Notes: In Panel A, the middle class is defined as a daily equivalized disposable household income range of $11 to $110 expressed in 2011 purchasing power parity (PPP). This interval is divided into two segments: a vulnerable group ($11–$22); and a secure group ($22–$110). Thresholds are converted into Turkish lira using the 2011 private consumption PPP conversion factor and are subsequently adjusted each year using the annual Consumer Price Index (CPI) reported by TurkStat. Panel B adopts a fixed real-income benchmark and defines the middle class as households whose income falls into the 75–200 percent range of the 2017 real median. The real 2017 median is adjusted for inflation using the CPI provided by TurkStat. Shares sum to 100 percent. The full set of annual estimates is given in Table A4 and Table A5 in the Appendix.
Consistent with our previous finding under the relative income-based definition of the middle class, we also observe in Table 4 that the trend has reversed after 2018. Under the PPP-based classification, the share of the secure middle-class segment dropped from 51.3 percent in 2017 to 32.6 percent in 2022, with a modest recovery in 2023, while that of the vulnerable segment rose from 34.8 percent to 40.3 percent. This pattern implies that although many households still fall within the “middle-income” category, the economic security associated with that position has weakened significantly. It should be noted that the $11–$110 (2011 PPP) threshold yields a relatively broad definition of the middle class. In the Turkish context, this implies that a large share of the population – approaching 80 percent in some years – falls within this range. Therefore, this absolute threshold should be interpreted with caution relative to median-based measures.
A comparable pattern is observed when the fixed 2017 benchmark is used: the share of the middle class declines from 53.2 percent in 2017 to 40.9 percent in 2022, followed by a modest recovery in 2023. This result suggests a deterioration in purchasing power relative to pre-2017 levels. Although we observe a modest recovery in 2023, no indicators have yet returned to their 2017 levels.
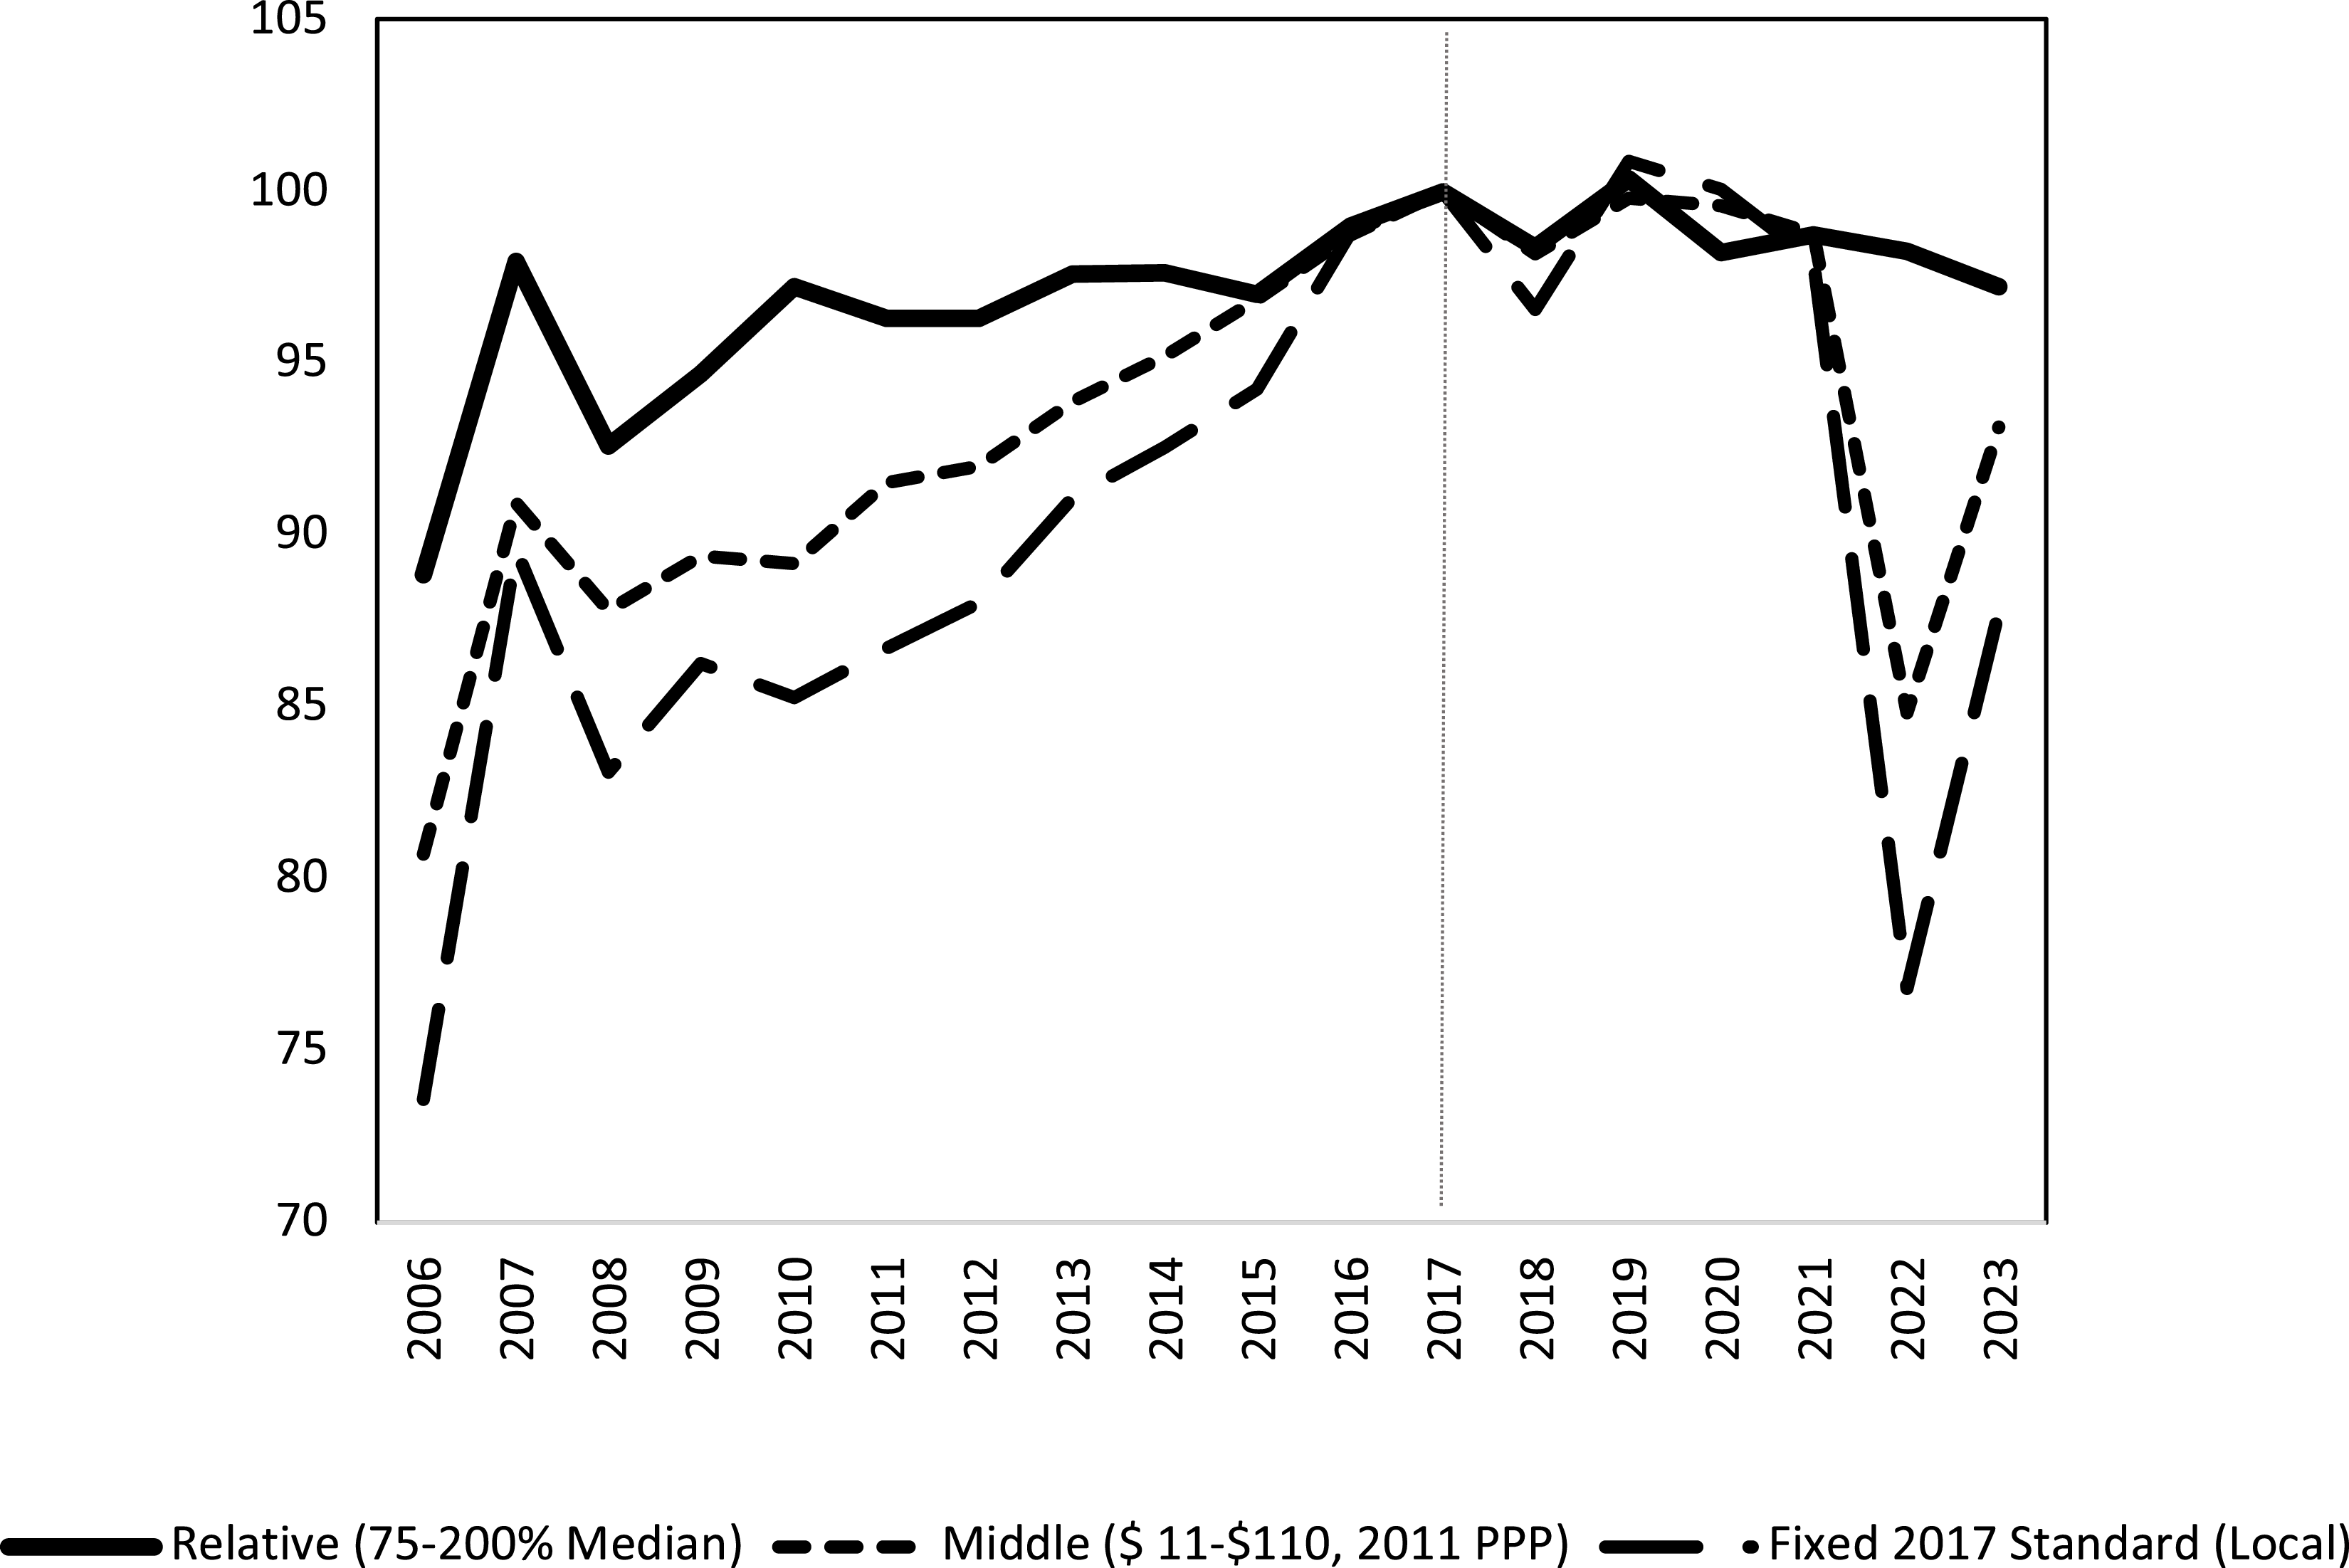
Figure 2 illustrates the evolution of three middle-class measures – relative, absolute ($11–$110), and the fixed 2017 median – each indexed to its 2017 level. It is apparent from this figure that across all definitions, the middle class expands up to 2017, followed by a weakening after 2018 and a sharp contraction during the high-inflation period of 2022–2023. The consistency of this pattern across different measures suggests that the observed changes are not driven by the choice of income threshold.Footnote 8 The relatively high levels observed in the late 2000s, including around 2007, coincide with a period of macroeconomic stability and stronger real income growth. By contrast, the decline to a low point in 2022 appears to reflect the effects of the COVID-19 pandemic, the sharp rise in inflation and exchange rate volatility, which potentially placed pressure on real incomes and reduced the share of individuals meeting fixed real-income thresholds.
Comparison of relative and absolute middle-class shares. All series are indexed to their 2017 value (=100). The index shows how each measure changes relative to the 2017 peak under the relative definition.
Source: Turkish Statistical Institute (TurkStat) 2006–2023 Survey of Income and Living Conditions; authors’ calculations

This pattern can thus suggest that the recent surge in inflation has structurally weakened the resilience of Turkey’s middle class. Importantly, the post-2018 decline in the middle-class size appears consistently across both relative and absolute definitions of the middle class.
Under the PPP-based classification, the transition from the secure to the vulnerable segment is consistent with the deterioration in financial strain and consumption capacity in the second period (2018–2023) reported in Table 3. In particular, the share of the secure segment declined, whereas that of the vulnerable segment increased. In general, therefore, it seems that many households remain within the middle-income distribution but are gradually losing the financial buffers that previously protected them against potential economic shocks.
Conclusion
This study has examined the middle class in Turkey in terms of its size, socio-economic profile, and its living standards over the period 2006–2023. Using annual cross-sectional SILC data from 2006 to 2023 and employing alternative definitions of the middle class, we have documented how the Turkish middle class has evolved across different macroeconomic contexts over time. Turkey has experienced two different economic contexts during the period under study. The period 2006–2017 was characterized by a favorable macroeconomic environment of strong economic growth, declining inflation, and improved income inequality, while the post-2018 period is characterized by rising inflation, growing inequality, and heightened macroeconomic instability.
In line with these macroeconomic shifts, our results indicate that the size of the middle class displays a two-phase trajectory: an expansion between 2006 and 2017 in a context of relative macroeconomic stability and strong economic growth, and a contraction after 2018 during a period characterized by macroeconomic instability and high and persistent inflation. Note that despite the recent contraction, the middle-class share in 2023 remains still above its 2006 level. These findings are robust to alternative income thresholds of the middle class: the relative median-based; the PPP-based; and fixed real-income thresholds of the middle class. This implies that the post-2017 contraction of the middle-class size reflects broader changes in income dynamics and economic resilience. In addition, according to the PPP-based criteria used in the study, the middle class is divided into two categories: “vulnerable” ($11–22 per day); and “secure” ($22–110 per day). The share of the “secure” middle class decreased from 51.3 percent in 2017 to 32.6 percent in 2022, while the “vulnerable” segment increased to 40.3 percent. This indicates that even if households maintain their position in the income distribution, the economic security associated with that position has weakened significantly.
The analysis also highlights significant changes in the composition of the middle class. The proportion of the old in the middle class has increased, while that of the young has decreased. It seems that this decline is consistent with the broader demographic aging. In addition, middle-class employment has become increasingly concentrated in wage employment in the services sector, accompanied by a decline in informality. However, the recent decline in the labor share of national income and the clustering of wages around the statutory minimum wage may have weakened income security for many middle-income households.
Overall, the post-2017 period represents a phase characterized by the contraction of the middle class. Demographic aging and the shift toward salaried employment in the services sector appear to be associated with vulnerability patterns after 2017. In this period, there is also a deterioration in some indicators of middle-class living standards, particularly in housing affordability, the capacity to make ends meet, and material deprivation. Nevertheless, many indicators remain better than those in 2006, indicating that the post-2017 developments represent an erosion of earlier gains rather than their full reversal. While the compositional and living standards results are based on the relative definition of the middle class, the comparison with absolute benchmarks indicates that post-2017 demographic, employment, and living standards shifts coincided with declines in real purchasing power.
From an international comparative perspective, the recent shrinking trend of the middle class in Turkey is in line with the general trend observed in OECD countries and some emerging economies. In OECD countries, factors such as income inequality and technological transformations are the main drivers behind the contraction of the middle class between the mid-1980s and the mid-2010s (OECD 2019). However, the contraction of the middle class and the pressures on the middle class are more pronounced and severe, particularly post-2017, due to high inflation, the depreciation of the Turkish lira, and the worsening of economic instabilities. The trend in Turkey closely aligns with those in Latin American countries (e.g. Brazil, Mexico) where the middle class expanded in the 2000s but contracted by the late 2010s.
Overall, the findings suggest a strong correlation between middle-class expansion and macroeconomic stability. Since 2018, adverse economic shifts have led to a contraction in its size and an increase in vulnerability of the middle-class population. These suggest that policies aiming at restoring economic stability and reducing inequality are crucial for the middle class’s potential re-expansion in Turkey. This analysis, thus, offers insights into future economic and social policy interventions.
Acknowledgements
The authors thank the anonymous reviewers for their helpful comments and suggestions. Any remaining errors are the authors’ responsibility.
Competing interests
The authors declare none.
Data statement
The microdata used in this study (the Survey of Income and Living Conditions) were accessed under a confidentiality agreement with the Turkish Statistical Institute (TurkStat) and therefore cannot be made publicly available.
Appendix
Income group composition under alternative relative income definitions (in percentages)

Table A1 Long description
The table presents the income group composition under different relative income definitions from 2006 to 2023. It includes three main definitions: Narrow (70-150%), Intermediate (75-200%), and Broad (60-225%). Each definition is further divided into Lower, Middle, and Upper categories. The table has 18 rows and 12 columns. Row 1: 2006, 32.0, 39.3, 28.8, 35.4, 47.2, 17.3, 25.2, 61.4, 13.4. Row 2: 2017, 28.0, 45.5, 26.5, 31.9, 53.2, 15.0, 19.9, 68.4, 11.7. Row 3: 2018, 28.6, 44.9, 26.5, 32.6, 52.3, 15.1, 21.1, 67.1, 11.8. Row 4: 2023, 28.9, 43.4, 27.7, 32.8, 51.7, 15.5, 21.2, 66.6, 12.2. The table shows the percentage distribution of the total population across different income groups for each year. The data is sourced from the Turkish Statistical Institute (TurkStat) surveys of 2006, 2017, 2018, and 2023, with authors’ own calculations.
Source: Turkish Statistical Institute (TurkStat) 2006–2023 Survey of Income and Living Conditions; authors’ own calculations.
Notes: The sample consists of individuals aged fifteen years and older. The middle-class size is defined relative to the national median of equivalized disposable household income.
Socio-economic and employment characteristics across lower, middle, and upper classes (in percentages)

Table A2 Long description
The table presents socio-economic and employment characteristics of the middle class in percentages for the years 2006, 2017, and 2023. It includes variables such as age, education, gender, marital status, household type, economic status, employment characteristics, sector, informality status, occupation, and contract type. The table is divided into several rows and columns, with each row representing a specific variable and each column representing the data for the years 2006, 2017, and 2023. Row 1: Age 15-29, 36.2, 28.9, 27.6. Row 2: Age 30-39, 20.4, 19.6, 17.7. Row 3: Age 40-49, 17.5, 17.3, 19.1. Row 4: Age 50-59, 11.7, 15.6, 15.6. Row 5: Age 60 and older, 14.1, 18.6, 20.0. Row 6: Education Less than high school, 76.6, 68.0, 56.5. Row 7: Education High school, 18.9, 20.1, 25.5. Row 8: Education University, 4.5, 11.8, 18.0. Row 9: Gender Female, 50.6, 50.2, 49.9. Row 10: Gender Male, 49.4, 49.9, 50.1. Row 11: Marital status Married, 68.5, 64.3, 61.3. Row 12: Marital status Never married, 24.3, 25.2, 27.8. Row 13: Marital status Widowed, 6.1, 7.5, 6.7. Row 14: Marital status Divorced, 1.2, 3.1, 4.2. Row 15: Household type One adult, 2.1, 6.0, 7.9. Row 16: Household type Two adults, 10.3, 13.6, 13.9. Row 17: Household type Two adults + child(ren), 55.8, 52.3, 54.7. Row 18: Household type Single father with child(ren), 0.1, 0.4, 0.5. Row 19: Household type Single mother with child(ren), 4.5, 4.7, 5.8. Row 20: Household type Other, 27.3, 23.1, 17.1. Row 21: Economic status Employed, 43.1, 45.2, 46.6. Row 22: Economic status Unemployed, 3.4, 4.5, 4.7. Row 23: Economic status Studying, 6.6, 7.9, 7.9. Row 24: Economic status Retired, 8.4, 11.7, 12.8. Row 25: Economic status Other, 38.6, 30.8, 28.0. Row 26: Employment status Wage-earner, 62.7, 72.8, 79.6. Row 27: Employment status Employer, 4.6, 3.1, 2.3. Row 28: Employment status Own-account workers, 18.8, 15.4, 13.0. Row 29: Employment status Unpaid family workers, 13.9, 8.7, 5.1. Row 30: Sector Agriculture, 23.3, 15.8, 10.9. Row 31: Sector Manufacturing, 25.8, 22.7, 23.2. Row 32: Sector Construction, 5.1, 6.9, 6.1. Row 33: Sector Services, 45.8, 54.6, 59.7. Row 34: Informality status Formal, 50.2, 69.3, 75.5. Row 35: Informality status Informal, 49.8, 30.7, 24.5. Row 36: Occupation High-skilled, 16.9, 16.5, 22.9. Row 37: Occupation Clerks, service, sales, 18.0, 28.8, 28.7. Row 38: Occupation Skilled agricultural, 22.5, 13.8, 9.0. Row 39: Occupation Craft, 17.0, 14.8, 14.5. Row 40: Occupation Machine operators, 13.7, 12.6, 11.5. Row 41: Occupation Elementary, 11.9, 13.4, 13.4. Row 42: Contract type Permanent, 81.2, 85.1, 89.3. Row 43: Contract type Temporary, 18.8, 14.9, 10.7.
Source: Turkish Statistical Institute (TurkStat) 2006, 2017, 2023 Survey of Income and Living Conditions; authors’ own calculations.
Notes: The sample consists of individuals aged fifteen years and older. For the employment characteristics, the sample is restricted to those who are employed at the time of the survey. Individuals with equivalized household incomes ranging from 75 percent to 200 percent of the national median are considered middle-class.
Living standards of the lower, middle, and upper classes (in percentages)

Table A3 Long description
The table presents living standards of the lower, middle, and upper classes in percentages for the years 2006, 2017, and 2023. It includes data on tenure status, financial situation, car possession, arrears on payments, ability to make ends meet, financial burden, material deprivation, and problems with dwelling and environment. The table has 40 rows and 10 columns. Column headers include years 2006, 2017, and 2023, with sub-columns Low, Middle, and High. Row labels include various living standard indicators such as homeowners percentage, tenants percentage, share of rent, car possession, arrears on payments, ability to make ends meet, financial burden, material deprivation, and problems with dwelling and environment. Notable trends include a decrease in the percentage of homeowners from 60.3 percent in 2006 to 58.0 percent in 2023, an increase in car possession from 30.6 percent in 2006 to 52.0 percent in 2023, and a decrease in arrears on utility bills from 25.8 percent in 2006 to 15.5 percent in 2023. The ability to make ends meet with some difficulty increased from 30.7 percent in 2006 to 45.3 percent in 2023. The financial burden of total household cost being a slight burden increased from 55.2 percent in 2006 to 67.7 percent in 2023. Material deprivation indicators such as renewing worn-out furniture decreased from 84.7 percent in 2006 to 35.1 percent in 2023. Problems with dwelling and environment such as leaking roof decreased from 40.1 percent in 2006 to 28.5 percent in 2023.
Source: Turkish Statistical Institute (TurkStat) 2006, 2017, 2023 Survey of Income and Living Conditions; authors’ own calculations.
Notes: The sample in this table consists of individuals aged fifteen years and older. Individuals with equivalized household incomes ranging from 75 percent to 200 percent of the national median are considered middle-class.
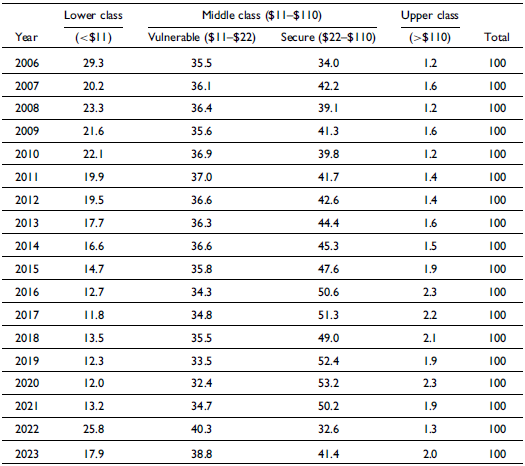
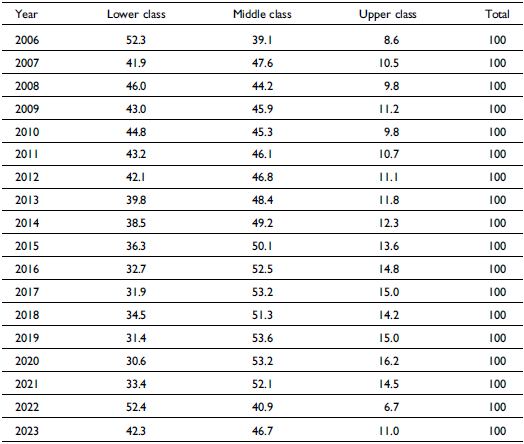
Trends in the middle class using absolute measure: $11–$110 in 2011 purchasing power parity (PPP) (in percentages)

Table A4 Long description
A table showing the distribution of lower, middle, and upper classes by percentage from 2006 to 2023. The table is divided into two panels: Panel A and Panel B. Panel A focuses on the middle class defined by a daily equivalized disposable household income range of 11 to 110 in 2011 purchasing power parity (PPP). It is further divided into vulnerable (11-22) and secure (22-110) groups. Panel B defines the middle class as households whose income falls into the 75-200 percent range of the 2017 real median. The table includes data for each year from 2006 to 2023, showing the percentage of the population in each class. Notable trends include a general decrease in the lower class and an increase in the upper class over the years. The middle class shows fluctuations but remains a significant portion of the population.
Source: Turkish Statistical Institute (TurkStat) 2006–2023 Survey of Income and Living Conditions; authors’ own calculations.
Notes: The absolute lower bound is set at $11 and the upper bound at $110 in 2011 PPP dollars. Thresholds are converted into Turkish lira using the 2011 private consumption PPP conversion factor and adjusted annually using the Consumer Price Index provided by the World Bank. Percentages refer to population shares and sum to 100 within each year.
Trends in the middle class using a fixed absolute standard: 75–200% of the 2017 median income (in percentages)

Table A5 Long description
The table presents data on the size of the middle class using two different benchmarks from 2006 to 2023. Panel A uses a global PPP-based absolute threshold, while Panel B uses a fixed real-income benchmark based on the 2017 median standard. Panel A includes columns for the lower class (<11), middle class (11-110, 2011 PPP), upper class (>110), vulnerable (11-22), and secure (22-110) groups. Panel B includes columns for the lower class (<75 percent), middle class (75-200 percent), and upper class (>200 percent). The data is presented in percentages for each year. Notable trends include fluctuations in the size of the middle class across different years and benchmarks. For example, in Panel A, the middle class percentage varies from 35.5 percent in 2006 to 40.3 percent in 2022. In Panel B, the middle class percentage ranges from 39.1 percent in 2006 to 53.2 percent in 2017.
Source: Turkish Statistical Institute (TurkStat) 2006–2023 Survey of Income and Living Conditions; authors’ own calculations.
Notes: This table presents the distribution of income classes based on a fixed absolute standard. The 2017 median income is used as the reference point to define the middle-class boundaries (75–200 percent). This benchmark was adjusted for all other years using the official Consumer Price Index. Percentages refer to population shares and sum to 100 within each year.
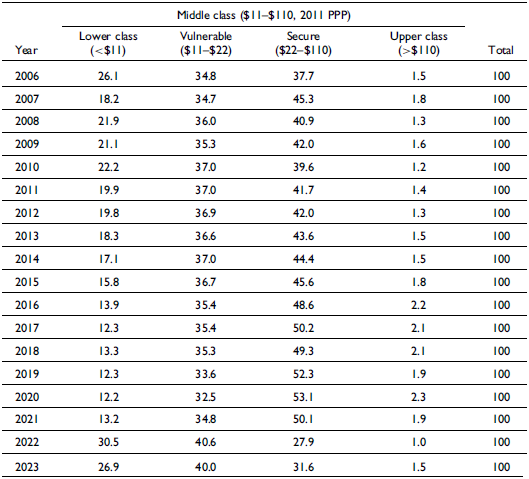
Trends in the middle class using an absolute measure: $11–$110 (2011 purchasing power parity [PPP]), deflated by the İstanbul Chamber of Commerce (ITO) cost-of-living index (1995=100) (in percentages)

Table A6 Long description
The table presents the distribution of middle class income groups in Turkey from 2006 to 2023, measured in percentages. It includes four income groups: Lower class (<11), Vulnerable (11-22), Secure (22-110), and Upper class (>110), with a total column summing to 100 percent each year. The table has 18 rows and 6 columns. Column headers are Year, Lower class, Vulnerable, Secure, Upper class, and Total. Row labels are the years from 2006 to 2023. Notable trends include a general decrease in the Lower class percentage over the years, a fluctuating Vulnerable class, a generally increasing Secure class, and a variable Upper class. For example, in 2006, the Lower class was 26.1 percent, Vulnerable 34.8 percent, Secure 37.7 percent, and Upper class 1.5 percent. By 2023, the Lower class decreased to 26.9 percent, Vulnerable increased to 40.0 percent, Secure decreased to 31.6 percent, and Upper class slightly increased to 1.5 percent.
Source: Turkish Statistical Institute (TurkStat) 2006–2023 Survey of Income and Living Conditions; authors’ own calculations.
Notes: The absolute lower bound is set at $11 and the upper bound at $110 in 2011 PPP. Thresholds are converted into Turkish lira using the 2011 private consumption PPP conversion factor and are adjusted annually using the ITO cost-of-living index (1995=100), obtained from the Central Bank of the Republic of Turkey (CBRT/TCMB). Percentages refer to population shares and sum to 100 within each year.
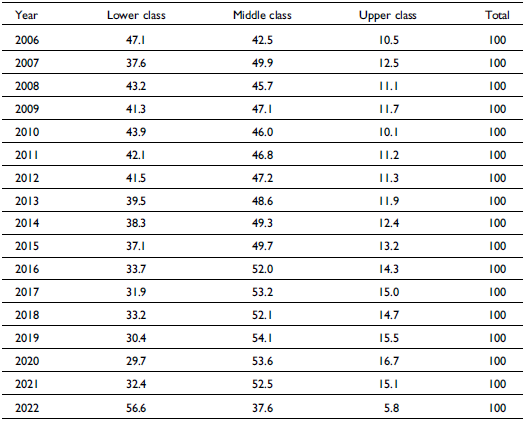
Trends in the middle-class using a fixed absolute standard: 75–200 percent of the 2017 median income, deflated by the İstanbul Chamber of Commerce (ITO) cost-of-living index (1995=100) (in percentages)

Table A7 Long description
The table presents data on the trends in the middle class using a fixed absolute standard from 2006 to 2022. It includes four columns: Year, Lower class, Middle class, Upper class, and Total. The table has 17 rows, each representing a year from 2006 to 2022. The values are given in percentages. Row 1: 2006, Lower class 47.1, Middle class 42.5, Upper class 10.5, Total 100. Row 2: 2007, Lower class 37.6, Middle class 49.9, Upper class 12.5, Total 100. Row 3: 2008, Lower class 43.2, Middle class 45.7, Upper class 11.1, Total 100. Row 4: 2009, Lower class 41.3, Middle class 47.1, Upper class 11.7, Total 100. Row 5: 2010, Lower class 43.9, Middle class 46.0, Upper class 10.1, Total 100. Row 6: 2011, Lower class 42.1, Middle class 46.8, Upper class 11.2, Total 100. Row 7: 2012, Lower class 41.5, Middle class 47.2, Upper class 11.3, Total 100. Row 8: 2013, Lower class 39.5, Middle class 48.6, Upper class 11.9, Total 100. Row 9: 2014, Lower class 38.3, Middle class 49.3, Upper class 12.4, Total 100. Row 10: 2015, Lower class 37.1, Middle class 49.7, Upper class 13.2, Total 100. Row 11: 2016, Lower class 33.7, Middle class 52.0, Upper class 14.3, Total 100. Row 12: 2017, Lower class 31.9, Middle class 53.2, Upper class 15.0, Total 100. Row 13: 2018, Lower class 33.2, Middle class 52.1, Upper class 14.7, Total 100. Row 14: 2019, Lower class 30.4, Middle class 54.1, Upper class 15.5, Total 100. Row 15: 2020, Lower class 29.7, Middle class 53.6, Upper class 16.7, Total 100. Row 16: 2021, Lower class 32.4, Middle class 52.5, Upper class 15.1, Total 100. Row 17: 2022, Lower class 56.6, Middle class 37.6, Upper class 5.8, Total 100.
Source: Turkish Statistical Institute (TurkStat) 2006–2023 Survey of Income and Living Conditions; authors’ own calculations
Notes: This table presents the distribution of income classes based on a fixed absolute standard. The 2017 median income is used as the reference point to define the middle-class boundaries (75–200 percent). This benchmark was adjusted for all other years using the ITO cost-of-living index (1995=100), obtained from the Central Bank of the Republic of Turkey (CBRT/TCMB). Percentages refer to population shares and sum to 100 within each year
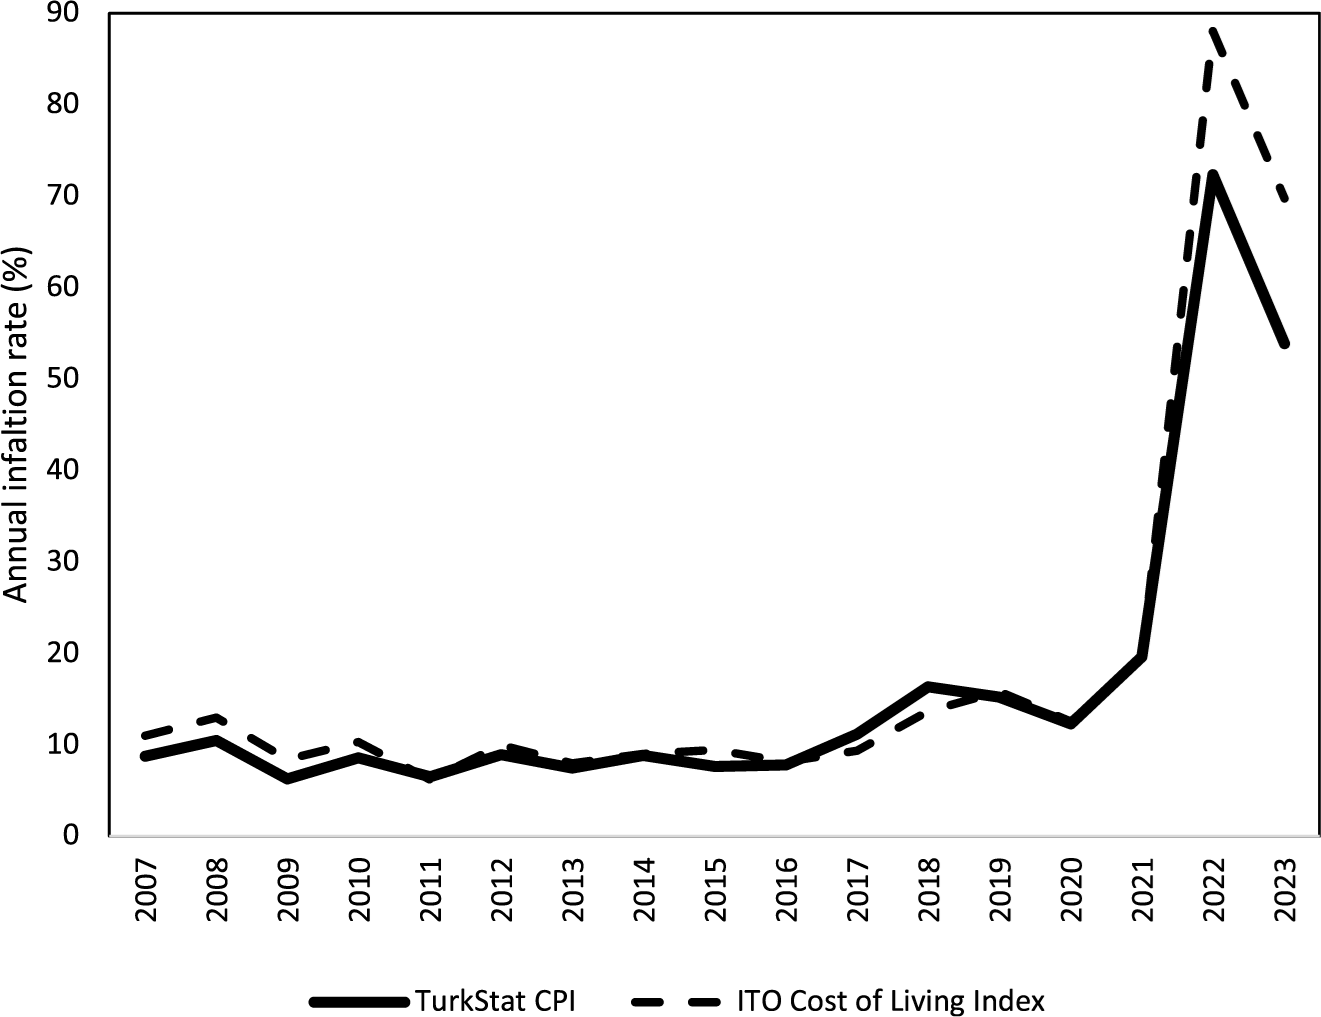
Annual inflation rates based on İstanbul Chamber of Commerce (ITO) cost-of-living index and Turkish Statistical Institute (TurkStat) consumer price index (CPI) indices (2007–2023). Annual inflation rates are calculated as year-over-year percentage changes in the twelve-month arithmetic average index values. The ITO cost-of-living index (1995=100) and the TurkStat CPI (2010=100) are used.
Source: TurkStat; ITO, via the Central Bank of the Republic of Turkey (CBRT/TCMB) Electronic Data Delivery System





 Open access

