


Statement of Research Significance
Research Question (s) or Topic(s): The present study compared face-valid predictors of instrumental activities of daily living (i.e., self-ratings of functional independence and performance of mock daily tasks) to non-face valid predictors (i.e., traditional measures of executive functions) with respect to their abilities predict performance on IADL-like tasks independently at home. Main Findings: In regression models, performance on executive measures emerged as a unique predictor of both accuracy and timeliness of at-home tasks. In receiver operating characteristics analyses, executive performance also identified participants with below average IADL capacity at home. Neither of the two face-valid measures was able to identify individuals with below average performance at home, although self-ratings did contribute a small amount of unique variance to prediction of functioning in regression models. Study Contribution: Traditionally measured executive functioning may have better incremental utility than more face-valid measures in predicting IADL capacity at home.
Introduction
Among older adults, assessment of functional independence is a critical aspect of neuropsychological evaluation, as even apparently cognitively-healthy older adults may exhibit declines in instrumental activities of daily living (IADLs; McAlister & Schmitter-Edgecombe, Reference McAlister and Schmitter-Edgecombe2016). Such declines can result in dangerous mismanagement of medications (Mizokami et al., Reference Mizokami, Mase, Kinoshita, Kumagai, Furuta and Ito2016) or devastating financial losses (Jekel et al., Reference Jekel, Damian, Wattmo, Hausner, Bullock, Connelly, Dubois, Eriksdotter, Ewers, Graessel, Kramberger, Law, Mecocci, Molinuevo, Nygård, Olde-Rikkert, Orgogozo, Pasquier, Peres, Salmon, Sikkes, Sobow, Spiegel, Tsolaki, Winblad and Frölich2015; Ueno et al., Reference Ueno, Daiku, Eguchi, Iwata, Amano, Ayani, Nakamura, Kato, Matsuoka and Narumoto2021) and have been associated with falls (Brown et al., Reference Brown, Kurichi, Xie, Pan and Stineman2014) and frailty (Nourhashemi et al., Reference Nourhashemi, Andrieu, Gillette-Guyonnet, Vellas, Albarede and Grandjean2001). Thus, reasonably accurate estimates of aging patients’ IADL capacity can inform recommendations aimed at improving safety and extending independence. Additionally, documentation of patients’ impairment (or a lack thereof) in IADLs contributes to differential diagnosis, including between dementia and mild cognitive impairment. Further, research suggests that subtle IADL difficulties, even in the context of relative functional independence, are predictive of conversion to dementia (Jang et al., Reference Jang, Numbers, Lam, Sachdev, Brodaty and Reppermund2022; Lau et al., Reference Lau, Parikh, Harvey, Huang and Farias2015; Roehr et al., Reference Roehr, Riedel-Heller, Kaduszkiewicz, Wagner, Fuchs, van der Leeden, Wiese, Werle, Bickel, König, Wolfsgruber, Pentzek, Weeg, Mamone, Weyerer, Brettschneider, Maier, Scherer, Jessen and Luck2019; Sikkes et al., Reference Sikkes, Visser, Knol, de Lange-de Klerk, Tsolaki, Frisoni, Nobili, Spiru, Rigaud, Frölich, Rikkert, Soininen, Touchon, Wilcock, Boada, Hampel, Bullock, Vellas, Pijnenburg and Uitdehaag2011). Thus, IADL functioning represents an essential variable to consider in neuropsychological research and practice.
In both research and clinical practice, three approaches are generally used to estimate functional independence: (1) rating scales (i.e., self or informant reports) of functional independence, (2) performance-based measures comprising mock IADL tasks, and (3) performance-based measures of executive functions (EF). While the first two approaches reflect face-valid methods, the latter is based on the theoretical assumption of an association between IADLs and EF. Notably, all three approaches have been criticized. First, functional rating scales have been shown to be discrepant with scores on performance-based IADL measures (Schmitter-Edgecombe et al., Reference Schmitter-Edgecombe, Parsey and Cook2011; Suchy et al., Reference Suchy, Kraybill and Franchow2011), and self- versus informant reports have also been mutually inconsistent (Rueda et al., Reference Rueda, Lau, Saito, Harvey, Risacher, Aisen, Petersen, Saykin, Farias and Initiative2015; Votruba et al., Reference Votruba, Persad and Giordani2015). Moreover, Numbers and colleagues (Reference Numbers, Jang, Brodaty, Sachdev, Draper and Reppermund2022) found that self-report measures of IADLs were more strongly associated with mood and personality than with demographic, cognitive, or medical variables, and showed only weak associations with performance-based IADL measures. In contrast, performance-based IADL measures were not significantly associated with mood or personality, suggesting they may provide a more objective assessment of functioning. Additionally, some evidence suggests that self-report is also confounded by cognition. For example, poorer EF (Gereau Mora & Suchy, Reference Mora and Suchy2023), prospective memory (Gereau Mora et al., Reference Mora, DesRuisseaux and Suchy2025), and global cognition (Okonkwo et al., Reference Okonkwo, Wadley, Griffith, Belue, Lanza, Zamrini, Harrell, Brockington, Clark, Raman and Marson2008) have all been associated with overestimation of one’s ability to complete IADLs.
Regarding the second common approach to estimating functional independence, mock IADL tasks performed in the office or a laboratory, the criticism has largely focused on the fact that these tasks become increasingly outdated due to ever-present technological advances (e.g., Sawyer et al., Reference Sawyer, Brannigan, Spielman, Chan, Wu, Peters, Switalski, Dohle, Rosario and Horsfall2025; Stringer et al., Reference Stringer, Leroi, Sikkes, Montaldi and Brown2020). An additional criticism can be waged due to the lack of evidence that high face validity of such tasks translates into accurate prediction of actual IADL functioning. Specifically, studies have demonstrated that improving the face validity of cognitive tests (i.e., making them look like real-world tasks) does not enhance their ability to predict daily functioning (Suchy et al., Reference Suchy, Lipio Brothers, DesRuisseaux, Gereau, Davis, Chilton and Schmitter-Edgecombe2022; Suchy et al., Reference Suchy, Mora, Brothers and DesRuisseaux2024a; Ziemnik & Suchy, Reference Ziemnik and Suchy2019); the same may hold for performance-based IADL tasks. Moreover, mock IADL tasks often rely on overlearned actions performed in a structured environment and as such do not address the question of whether a patient can manage IADLs within the complexity of daily life. Lastly, performing tasks on command in the office or a laboratory does not address the question of whether a patient can independently initiate daily tasks without being prompted to do so.
As for the third approach to estimating functional independence, traditional performance-based measures of EF have been criticized as lacking “ecological validity,” a term that itself has been criticized for vagueness and frequent misuse (Holleman et al., Reference Holleman, Hooge, Kemner and Hessels2020; Suchy et al., Reference Suchy, DesRuisseaux, Mora, Brothers and Niermeyer2024; Suchy et al., Reference Suchy, Gereau Mora, Brothers and DesRuisseaux2024). Briefly, ecological validity typically refers to (a) how well a test resembles real-world situations (i.e., verisimilitude) and/or (b) the test’s ability to predict daily functional ability (i.e., veridicality; Suchy et al., Reference Suchy, DesRuisseaux, Mora, Brothers and Niermeyer2024). It has been argued that since traditional tests of EF lack similarity to daily life, they simply cannot be predictive of actual daily functioning (Burgess et al., Reference Burgess, Alderman, Forbes, Costello, M-A.Coates, Dawson, Anderson, Gilbert, Dumontheil and Channon2006; Parsons et al., Reference Parsons, Carlew, Magtoto and Stonecipher2017). This criticism overstates the problems with traditional EF tests, with a large body of research showing that such measures do predict a variety of functional outcomes (Krynicki et al., Reference Krynicki, Jones and Hacker2025; Razani et al., Reference Razani, Casas, Wong, Lu, Alessi and Josephson2007; Suchy et al., Reference Suchy, Ziemnik, Niermeyer and Brothers2020a; Vaughan & Giovanello, Reference Vaughan and Giovanello2010). Moreover, when pitted against each other, traditional EF tests predict daily functioning beyond more face-valid EF tests, which themselves do not show incremental validity (Suchy et al., Reference Suchy, Lipio Brothers, DesRuisseaux, Gereau, Davis, Chilton and Schmitter-Edgecombe2022; Suchy et al., Reference Suchy, Mora, Brothers and DesRuisseaux2024a). Nevertheless, it the amount of variance in functional outcomes explained by traditional EF measures is relatively small, with small-to-medium effect sizes found in most studies.
In summary, the three most common methods of estimating functional independence (i.e., rating scales, behavioral measures comprising mock IADL tasks, and behavioral measures of EF) all have different limitations. Yet, to our knowledge, these approaches have never been directly compared, leaving a gap in our understanding of which method most accurately captures real-world functional abilities, or whether their combined use incrementally improves prediction beyond any one measure used alone. Furthermore, a majority of the research on prediction of daily functioning relies on functional rating scales as outcome measures (Van Grootven & Van Achterberg, Reference Van Grootven and Van Achterberg2022), which essentially translates into a demonstration of an association among the different assessment approaches, rather than their respective (or joint) associations with actual real world outcomes.
Therefore, the purpose of this study is to compare the three aforementioned methods in their abilities to predict performance on IADL-like tasks independently at home. To these ends, we recruited a sample of independently living older adults and administered three types of measures as predictors of daily functioning: (1) self-report of IADL capacity, (2) performance of mock IADL tasks, and (3) traditional tests of EF. As an outcome, we assessed participants’ ability to independently complete a three-week protocol of typical, at-home IADL tasks.
Based on above-reviewed findings demonstrating that performance-based measures comprising IADLs tasks may represent a more objective estimate of functioning than self-reports (e.g., Numbers et al., Reference Numbers, Jang, Brodaty, Sachdev, Draper and Reppermund2022) and that traditional measures of EF outperform measures comprised of IADL-like tasks (Suchy et al., Reference Suchy, Lipio Brothers, DesRuisseaux, Gereau, Davis, Chilton and Schmitter-Edgecombe2022; Suchy et al., Reference Suchy, Mora, Brothers and DesRuisseaux2024a), we hypothesized that (a) all three methods of measurement would predict IADL capacity to some degree, but (b) only the traditional performance-based measures of EF would emerge as a unique predictor of functional capacity above and beyond the other methods.
Method
Participants
Participants were drawn from a sample of 117 independent community-dwelling older adults aged 60 and 95 years recruited into a larger study examining the impact of various contextual factors on successful execution of IADLs. Participants were recruited from the University of Utah’s Center on Aging database, flyers posted at a Senior Expo and in the Osher Lifelong Learning Institute, and advertisement in Salt Lake City public transportation, on social media, and in local newspapers. For inclusion in the study, participants had to be at least 60 years old, have at least an 8th grade education, and be able to read, speak, and understand English.
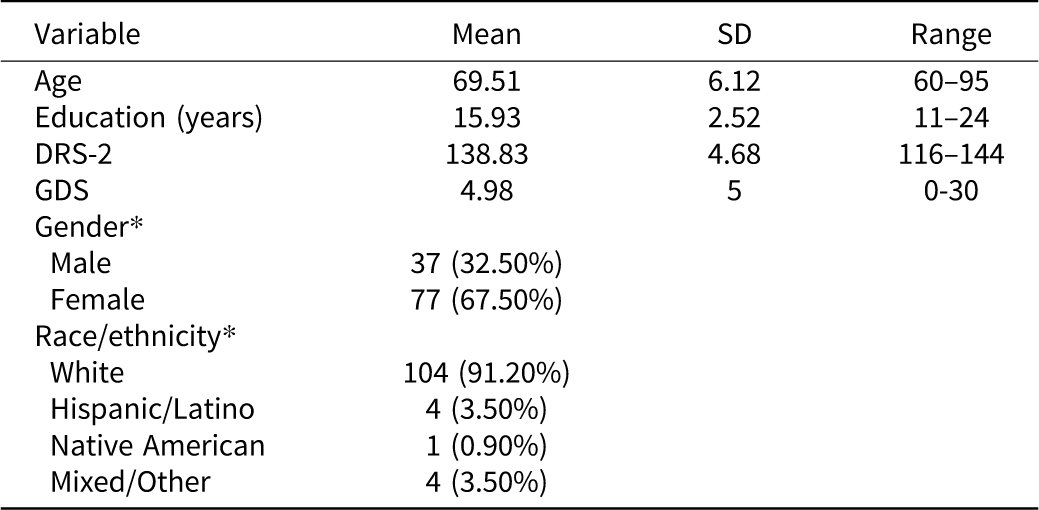
Potential participants were excluded if they had and/or reported (a) uncorrected hearing, vision, or motor (e.g., hemiparesis, tremor) impairments that would affect task performance, (b) a self-reported diagnosis of a significant neurologic condition (e.g., dementia, moderate to severe traumatic brain injury, stroke, seizure disorder), or (c) uncontrolled and/or untreated severe psychiatric disorders (e.g., schizophrenia, bipolar). Participants with common psychiatric diagnoses (e.g., depression, anxiety) were not excluded from the study. Three participants were excluded from analyses due to discontinuing participation before completing all three weeks of at-home assessment, for the final sample of 114 participants (37 men, 77 women). See Table 1 for additional characteristics. Subsets of the present dataset were used in prior studies (Brothers & Suchy, Reference Brothers and Suchy2022; Brothers & Suchy, Reference Brothers and Suchy2021; Suchy et al., Reference Suchy, Lipio Brothers, DesRuisseaux, Gereau, Davis, Chilton and Schmitter-Edgecombe2022, Reference Suchy, Mora, DesRuisseaux and Brothers2023, Reference Suchy, DesRuisseaux, Mora, Brothers and Niermeyer2024, Reference Suchy, DesRuisseaux, Mora, Brothers and Niermeyer2024; Suchy et al., Reference Suchy, Mora, Brothers and DesRuisseaux2024b) but none of these examined office-based IADLs as predictors of at-home daily functioning.
Demographic, cognitive, and affective characteristics of the sample

Table 1. Long description
The table presents demographic, cognitive, and affective characteristics of 114 participants. It has 8 rows and 5 columns. The columns are labeled Variable, Mean, SD, and Range. The rows are labeled Age, Education (years), DRS-2, GDS, Gender, Race/ethnicity. The table includes the following data: Row 1: Age, Mean: 69.51, SD: 6.12, Range: 60-95. Row 2: Education (years), Mean: 15.93, SD: 2.52, Range: 11-24. Row 3: DRS-2, Mean: 138.83, SD: 4.68, Range: 116-144. Row 4: GDS, Mean: 4.98, SD: 5, Range: 0-30. Row 5: Gender, Male: 37 (32.50 percent), Female: 77 (67.50 percent). Row 6: Race/ethnicity, White: 104 (91.20 percent), Hispanic/Latino: 4 (3.50 percent), Native American: 1 (0.90 percent), Mixed/Other: 4 (3.50 percent).
Note: N = 114.
DRS–2 = Dementia Rating Scale–2nd edition raw score, GDS = Geriatric Depression Scale.
* Indicates that the variable is in n (%) format. Note that 15.8% of the sample had DRS-2 scores below 136, suggesting the possibility of mild cognitive impairment.
Procedures
The study was approved by the University of Utah Institutional Review Board and was conducted in compliance with Helsinki Declaration. Interested participants were screened over the telephone for eligibility, and, if eligible, were invited for baseline assessment at the University of Utah. Participants consented before completing the baseline session, which involved administration of cognitive and self-report measures. Following baseline, participants were given instructions about how to complete daily IADL tasks (to be completed independently at home over the course of the following three weeks). Participants received $60 for the 6-hour baseline session and $4 for every IADL task attempted. Interested participants received brief feedback about their personality, cognitive, and psychiatric screening.
Measures
Characterizing the Sample. General cognitive status and depressive symptoms were screened using the Dementia Rating Scale – 2nd edition (DRS-2; Jurica et al., Reference Jurica, Leitten and Mattis2001) and the 30-item self-report Geriatric Depression Scale (GDS; Yesavage, Reference Yesavage1988), respectively. Three participants were missing GDS scores; for these participants the missing values were replaced with the sample mean (see Table 1).
Home-based assessment of IADLs. At-home IADL capacity was measured using the Daily Assessment of Independent Living and Executive Skills (DAILIES) protocol. This protocol includes a series of 18 tasks from six different IADL subdomains meant to mimic daily functioning (e.g., paying utility bills, remembering passwords, rescheduling appointments, etc.). One task was completed every day over the course of three weeks (excluding Sundays), with all six subdomains represented each week (see Table 2 for a general description of the tasks, and see Brothers & Suchy, Reference Brothers and Suchy2022, Appendix 1, for a full description of the protocol). Most tasks take approximately five to ten minutes to complete, and each participant was given two practice tasks during the baseline visit to ensure they understood the procedure. Participants were compensated $4 for each completed task (approximating financial motivations associated with typical IADLs, e.g., avoiding penalties for late bill payment or for non-cancelation of a doctor’s appointment) for a total possible sum of $72. Participants were instructed to (a) complete each task during a specified time of day to ensure that the DAILIES protocol would be assimilated into their daily routine and (b) use specified modes of communication (mail, email, and voicemail) to submit their responses to the laboratory. The time of day and mode of communication varied across days and tasks to mimic the demands of daily life but were standardized across the entire protocol. The DAILIES protocol was developed in our laboratory and has been reported by 94% of participants to be similar to tasks typically completed in daily life (Suchy et al., Reference Suchy, Mora, DesRuisseaux and Brothers2023). Performance on the DAILIES has been shown to correlate with performance on a range of previously validated measures known to correlate with daily functioning (Brothers & Suchy, Reference Brothers and Suchy2022; Suchy et al., Reference Suchy, Lipio Brothers, DesRuisseaux, Gereau, Davis, Chilton and Schmitter-Edgecombe2022, Reference Suchy, Mora, DesRuisseaux and Brothers2023, Reference Suchy, DesRuisseaux, Mora, Brothers and Niermeyer2024, Reference Suchy, DesRuisseaux, Mora, Brothers and Niermeyer2024; Suchy et al., Reference Suchy, Gereau Mora, Brothers and DesRuisseaux2024).
Types of tasks included in the DAILIES protocol

Table 2. Long description
A table categorizing tasks in the DAILIES protocol by type and description. The table has two columns: Task category and General task description. Task category includes Planning and problem solving, Finding information online, Password creation and usage, Checking and responding to email, Shopping/Errands, and Bills/Finances. General task description includes specific tasks under each category. Planning and problem solving includes cross-referencing schedules, generating solutions for living arrangements, and using a gift card. Finding information online includes finding schedules, business hours, and nutritional values. Password creation and usage includes creating and retrieving passwords. Checking and responding to email includes checking email for instructions. Shopping/Errands includes purchasing items and planning errands. Bills/Finances includes filling out forms for reimbursement, payment, and rebates.
Daily tasks were scored based on timeliness and accuracy. Specifically, participants received one point each for completing the task on the correct day and at the correct time (as evident per time stamps of phone messages, emails, or postal stamps). The sum of these time-based scores was used in analyses and is hereafter referred to as “DAILIES-timeliness.” Additional points were awarded based on performance accuracy, ranging from 1 to 6 points depending on task complexity. For example, for tasks requiring multiple steps before arriving at a final answer (e.g., finding information online and then correctly applying it to a task at hand) points were awarded for each correctly completed step, with some tasks allowing up to six points. For one-step tasks (e.g., completing a rebate form), scoring was based solely on the final response, resulting in a single point. Due to differences in task complexity and difficulty, each task score was converted to a z-score based on the current sample, and the mean of z-scores of all completed tasks was computed. This score is referred to hereafter as “DAILIES-accuracy.” Of note, internal consistency was not calculated, as the DAILIES scores constitute a “formative” variable intended to provide a sum total of correctly completed tasks rather than reflect a latent construct. Computation of internal consistency reliability for formative variables is not appropriate (Kievit et al., Reference Kievit, Romeijn, Waldorp, Wicherts, Scholte and Borsboom2011).
Lab-based IADL assessment. Lab-based IADL performance was evaluated with the timed instrumental activities of daily living (TIADL; Owsley et al., Reference Owsley, Sloane, McGwin and Ball2002), a performance-based measure of IADLs that has been extensively validated (Franchow & Suchy, Reference Franchow and Suchy2015; Kraybill et al., Reference Kraybill, Thorgusen and Suchy2013; Mora & Suchy, Reference Mora and Suchy2023; Suchy et al., Reference Suchy, Williams, Kraybill, Franchow and Butner2010; Suchy & Brothers, Reference Suchy and Brothers2022; Wallace et al., Reference Wallace, Bell, Thorpe and Rebok2025). The TIADL requires participants to engage in five tasks that are akin to everyday activities as quickly and as accurately as they can (e.g., searching for a name in the phonebook, counting change, reading medicine bottle instructions, finding food on a shelf, reading ingredients on cans of food). Participants were aware that they were being timed. Overall speed, thought to reflect task efficiency, was calculated in accordance with Owsley and colleagues (Reference Owsley, Sloane, McGwin and Ball2002). Specifically, individual task completion times were converted into z-scores (based on the present sample) to place all tasks on the same metric, and these scores were then averaged across the tasks for each participant. This average score is hereafter referred to as “IADL-lab.” The Cronbach’s alpha of the TIADL in this sample was .83Footnote 1.
Self-report of IADLs. Self-reported IADLs were assessed using an extensively validated (Kelbling et al., Reference Kelbling, Ferreira Prescott, Shearer and Quinn2024a) IADL scale developed by Lawton & Brody (Reference Lawton and Brody1970). Participants rated their level of independence across nine functional domains on a three-point scale (3 = without help, 2 = with some help, 1 = completely unable), with higher score reflecting greater independence. Domains included communication, financial management, meal preparation, shopping, medication management, housekeeping, and transportation. The sum of individual items was used in analyses and is hereafter referred to as “IADL-self.” Test–retest reliability was previously reported to be between 0.9 and 0.99 (Kelbling et al., Reference Kelbling, Ferreira Prescott, Shearer and Quinn2024b). Cronbach’s alpha was not calculated in the present sample since the scores on this scale represent a formative, rather than reflective, variable (Kievit et al., Reference Kievit, Romeijn, Waldorp, Wicherts, Scholte and Borsboom2011).
Lab-based assessment of EFs. As was done in our previous research (DesRuisseaux et al., Reference DesRuisseaux, Gereau Mora and Suchy2025; Niermeyer & Suchy, Reference Niermeyer and Suchy2020; Suchy et al., Reference Suchy, Brothers, Mullen and Niermeyer2020; Suchy & Brothers, Reference Suchy and Brothers2022), scaled scoresFootnote 2 from executive conditions (per test manual) of four D-KEFS subtests (Trail Making, Design Fluency, Verbal Fluency, and Color-Word Interference; Delis et al., Reference Delis, Kaplan and Kramer2001) were used to generate two EF composite scores: “D-KEFS speed” (i.e., calculated from timed scores) and “D-KEFS accuracy” (i.e., calculated from error scores). Scores were generated using previously validated procedures (Suchy & Brothers, Reference Suchy and Brothers2022), with higher scores indicating better performance. Specifically, time and errorFootnote 3 scaled scores from condition 4 from the Trail Making Test (i.e., number-letter switching), conditions 1–3 from Design Fluency (i.e., filled dots, empty, dots, switching), conditions 1–3 from Verbal Fluency (i.e., letter fluency, category fluency, category switching), and conditions 3 and 4 from Color-Word Interference (i.e., inhibition, inhibition/switching) were used for the D-KEFS speed and D-KEFS accuracy scores, respectively. Cronbach’s Alpha in the present sample was .85 for speed and .68 for accuracy, respectively. Test–retest reliabilities were previously reported to be .90 for D-KEFS-speed and .74 for D-KEFS-accuracy in a demographically similar sample (Suchy & Brothers, Reference Suchy and Brothers2022). These composite scores have been shown to be superior to individual D-KEFS scores in predicting IADL performance (Suchy & Brothers, Reference Suchy and Brothers2022).
Results
Preliminary analyses
Data distribution
All primary dependent and independent variables were normally distributed with the exception of D-KEFS-accuracy and the DAILIES variables, which exhibited a slight skew (skewness ranging from 1.06 to 1.81) that was fully corrected (all skewness values < 1.0) via Winsorization such that all outliers were moved to be within 3 SDs of the sample mean.
Validity check
To determine whether participants completed daily tasks independently, we inquired during a debriefing session about the degree to which they had received help. 20% of participants self-reported getting help once or twice during the three weeks, though there was no objective measure to confirm the accuracy of reports. All participants denied getting more frequent help. Receiving help was not correlated with any of the outcome variables (p values > .059).
Zero order correlations with demographics, psychiatric, and cognitive variables
As seen in Table 3, DRS-2 was the only variable that was associated with both the predictor variables and the outcome variables, and for that reason was used as a covariate in analyses examining our predictors’ incremental validity beyond general cognitive status.
Correlations of IADL and EF variables with demographic, cognitive, and depressive status

Table 3. Long description
A table with 6 rows and 7 columns. The columns are labeled as Variable, Dailies-accuracy, Dailies-timeliness, D-KEFS-accuracy, D-KEFS-speed, IADL-Lab, and IADL-self. The rows are labeled as Age, Education, Sex, GDS, and DRS-2. The values in the table are as follows: Row 1: Age, -.091, -.104, -.213*, -.387***, .309**, .033. Row 2: Education, .178, .042, .143, .296**, -.242**, .013. Row 3: Sex, -.063, .025, -.104, .085, -.108, -.335***. Row 4: GDS, -.158, -.121, -.205*, -.176, .165, -.130. Row 5: DRS-2, .304**, .203*, .318**, .562***, -.411***, -.246**. The table shows correlations between different variables related to demographic, cognitive, and depressive status.
Note: N = 114. Sex is coded as 0 = male and 1 = female. GDS = Geriatric Depression Scale total raw score; DRS-2 = Dementia Rating Scale – 2nd edition total raw score. DAILIES-accuracy = accuracy on the Daily Assessment of Independence and Living Skills, DAILIES-timeliness = timeliness on the Daily Assessment of Independence and Living Skills, D-KEFS-accuracy = composite of error scaled scores from select D-KEFS subtests, D-KEFS-speed = composite of primary (time-based) scaled scores from select D-KEFS subtests, IADL-Lab = averaged z-scores for performance speed on timed instrumental activities of daily living tasks, IADL-self = self-reported instrumental activities of daily living. With the exception of IADL-Lab, higher scores reflect better performance.
*** Correlation is significant at the < .001 level.
** Correlation is significant at the .01 level.
* Correlation is significant at the .05 level.
Principal analyses
Associations among dependent and independent variables
Zero-order correlations (Table 4) revealed that, consistent with expectation, the ability to execute IADLs at home correctly (DAILIES-accuracy) was associated with all four predictor variables (i.e., IADL-lab, IADL-self, D-KEFS-speed, and D-KEFS-accuracy). The ability to perform IADL tasks during correct time frames (DAILIES-timeliness) was only associated with D-KEFS-speed.
Descriptive statistics and correlations among dependent and independent variables

Table 4. Long description
A table with six rows and seven columns displaying descriptive statistics and correlations among dependent and independent variables. The columns are labeled Variable, M (SD) [Range], DAILIES-timeliness, D-KEFS-accuracy, D-KEFS-speed, IADL-Lab, and IADL-self. The rows include DAILIES-accuracy, DAILIES-timeliness, D-KEFS-accuracy, D-KEFS-speed, IADL-Lab, and IADL-Self. Each row provides specific values for the variables listed in the columns. Notable correlations include DAILIES-accuracy with IADL-Lab (.360***), IADL-Self (—.265***), D-KEFS-accuracy (.403***), and D-KEFS-speed (.279***). DAILIES-timeliness is only associated with D-KEFS-speed (.147).
Note: N = 114. DAILIES-accuracy = accuracy on the Daily Assessment of Independence and Living Skills, DAILIES-timeliness = timeliness on the Daily Assessment of Independence and Living Skills, D-KEFS-accuracy = composite of error scaled scores from select D-KEFS subtests, D-KEFS-speed = composite of primary (time-based) scaled scores from select D-KEFS subtests, IADL-Lab = averaged z-scores for performance speed on timed instrumental activities of daily living tasks, IADL-self = self-reported instrumental activities of daily living. With the exception of IADL-Lab, higher scores reflect better performance.
*** Correlation is significant at the < .001 level.
** Correlation is significant at the .01 level.
* Correlation is significant at the .05 level.
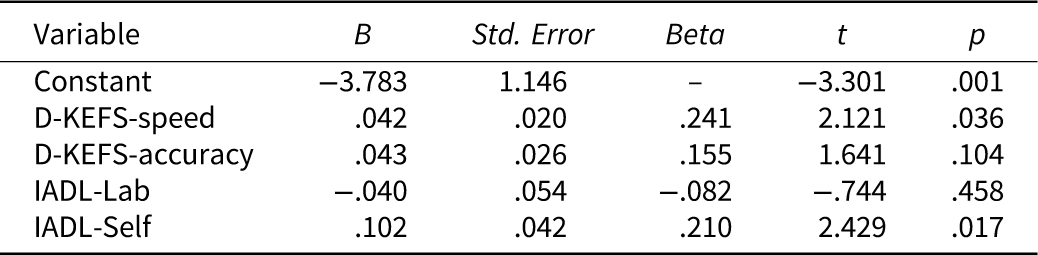
Because the DAILIES-accuracy was associated with the three main predictors, we ran a general linear regression with the goal of examining whether any of the predictors accounted for unique variance beyond the others. Specifically, we used DAILIES-accuracy as the dependent variable and D-KEFS-speed, D-KEFS-accuracy, IADL-lab, and IADL-self as predictors. The full model was significant [F(4,109) = 6.67, p < .001], accounting for 20% of variance. As seen in Table 5, D-KEFS-speed and IADL-self emerged as unique predictors. A similar regression was not appropriate for DAILIES-timeliness, as this outcome was only associated with one of the three potential predictors.
General linear regression predicting performance accuracy on the DAILIES protocol

Table 5. Long description
A table with five rows and five columns presenting the results of a general linear regression predicting performance accuracy on the DAILIES protocol. The columns are labeled Variable, B, Std. Error, Beta, t, and p. The rows list the variables Constant, D-KEFS-speed, D-KEFS-accuracy, IADL-Lab, and IADL-Self along with their respective statistical values. The table provides the coefficients (B), standard errors (Std. Error), standardized coefficients (Beta), t-values (t), and p-values (p) for each variable. Notable trends include significant p-values for Constant, D-KEFS-speed, and IADL-Self, indicating their unique predictive power in the model.
Note: Geriatric Depression Scale total raw score; DRS-2 = Dementia Rating Scale – 2nd edition total raw score. DAILIES-accuracy = accuracy on the Daily Assessment of Independence and Living Skills, DAILIES-timeliness = timeliness on the Daily Assessment of Independence and Living Skills, D-KEFS-accuracy = composite of error scaled scores from select D-KEFS subtests, D-KEFS-speed = composite of primary (time-based) scaled scores from select D-KEFS subtests, IADL-Lab = averaged z-scores for performance speed on Timed Instrumental Activities of Daily Living tasks, IADL-self = self-reported instrumental activities of daily living. With the exception of IADL-Lab, higher scores reflect better performance. Full model statistic: R = .443; R 2 = .196; p < .001.
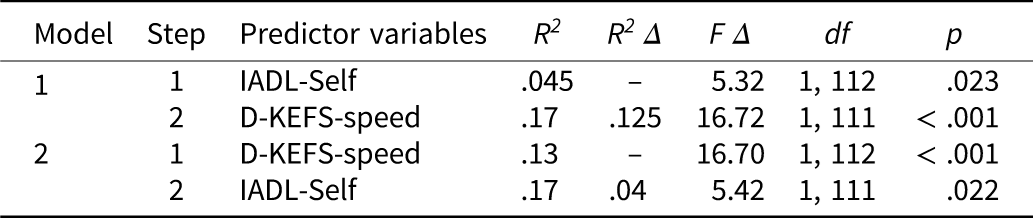
Next, to determine the practical utility of these findings, we examined unique and overlapping variances between the two significant predictors of DAILIES-accuracy by running two hierarchical regressions entering D-KEFS-speed and IADL-self on steps 1 and 2, respectively, and then again in the reverse order. As seen in Table 6, the model accounted for 17% of variance, with the D-KEFS-speed accounting uniquely for 12.5% of variance and IADL self-report accounting uniquely for 4.1% of variance, with negligible variance overlap (0.4%).
Hierarchical linear regression predicting performance accuracy on the DAILIES protocol

Table 6. Long description
A table comparing hierarchical linear regression models predicting performance accuracy on the DAILIES protocol. The table has 3 rows and 7 columns. Column headers are Model, Step, Predictor variables, R squared, R squared delta, F delta, df, and p. Row 1: Model 1, Step 1, IADL-Self, 0.045, -, 5.32, 1, 112, 0.023. Row 2: Model 1, Step 2, D-KEFS-speed, 0.17, 0.125, 16.72, 1, 111, < 0.001. Row 3: Model 2, Step 1, D-KEFS-speed, 0.13, -, 16.70, 1, 112, < 0.001. Row 4: Model 2, Step 2, IADL-Self, 0.17, 0.04, 5.42, 1, 111, 0.022.
Note: N = 114. DAILIES = Daily Assessment of Independence and Living Skills, D-KEFS-speed = average speed Scaled Score across selected D-KEFS trials, IADL-self = self-reported IADL performance with higher scores reflecting more difficulties.
Incremental validity beyond DRS-2
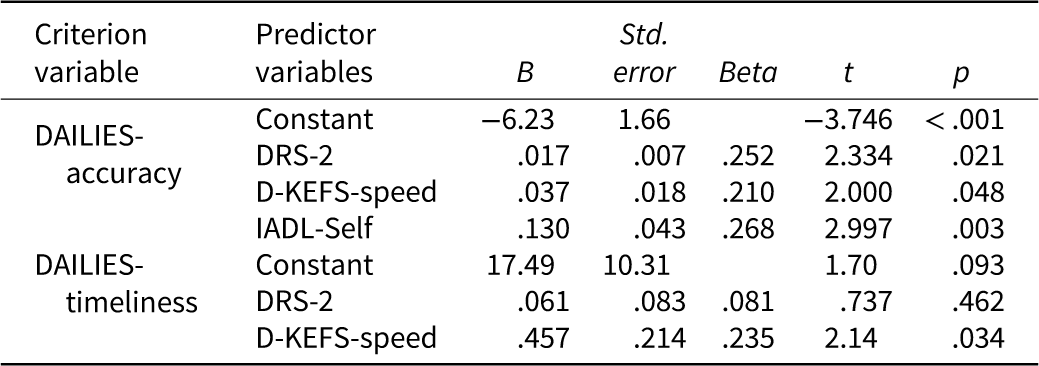
Because both predictor and outcome variables correlated with the performance on the DRS-2, we examined whether D-KEFS-speed and IADL-self incrementally predicted daily functioning beyond general cognitive status. As seen in Table 7, (a) D-KEFS-speed and IADL-self continued to uniquely predict DAILIES-accuracy, and (b) D-KEFS-speed continued to uniquely predict DAILIES-timeliness, demonstrating the tests’ incremental validity beyond general mental status. Additionally, DRS-2 itself accounted for unique variance in DAILIES-accuracy, adding 4% of variance to the model (R 2Δ = .039, FΔ = 5.45, p = .02), but did not contribute uniquely to DAILIES-timeliness beyond D-KEFS-speed.
General linear regression predicting accuracy and timeliness on the DAILIES protocol while controlling for the DRS-2

Table 7. Long description
A table with two rows of criterion variables: DAILIES-accuracy and DAILIES-timeliness. Each criterion variable has a constant and predictor variables: DRS-2, D-KEFS-speed, and IADL-Self. The table includes columns for B, Std. error, Beta, t, and p values. For DAILIES-accuracy, the constant is -6.23 with a p value of less than .001. DRS-2 has a B value of .017, Std. error of .007, Beta of .252, t of 2.334, and p of .021. D-KEFS-speed has a B value of .037, Std. error of .018, Beta of .210, t of 2.000, and p of .048. IADL-Self has a B value of .130, Std. error of .043, Beta of .268, t of 2.997, and p of .003. For DAILIES-timeliness, the constant is 17.49 with a p value of .093. DRS-2 has a B value of .061, Std. error of .083, Beta of .081, t of .737, and p of .462. D-KEFS-speed has a B value of .457, Std. error of .214, Beta of .235, t of 2.14, and p of .034.
Note: N = 114. DAILIES = Daily Assessment of Independence and Living Skills, DAILIES-accuracy = accuracy on the Daily Assessment of Independence and Living Skills, DAILIES-timeliness = timeliness on the Daily Assessment of Independence and Living Skills, DRS-2 = Dementia Rating Scale – 2nd edition total raw score, D-KEFS-speed = average speed Scaled Score across selected D-KEFS trials, IADL-self = self-reported IADL performance with higher scores reflecting more difficulties. Full model statistics for regressions predicting DAILIES-accuracy and DAILIES-timeliness, respectively: R = .458; R 2Δ = .117; p < .001, R = .289; R 2Δ = .038; p = .034.
Clinical utility of the D-KEFS and IADL self-report
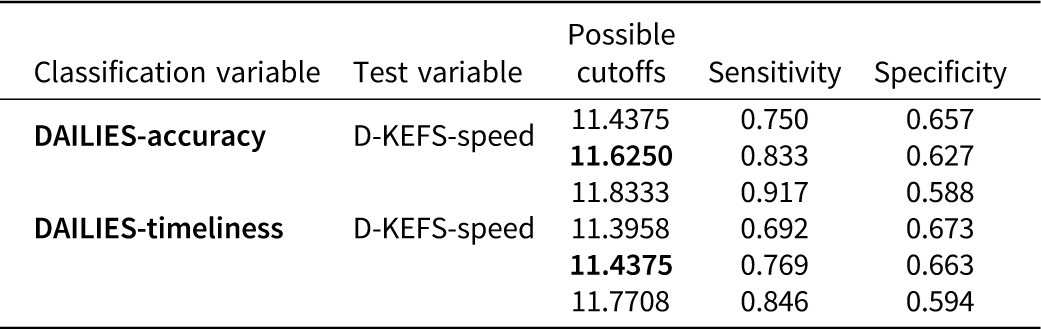
Lastly, while parametric statistics (e.g., regressions) can demonstrate whether a variable contributes variance to prediction beyond chance they do not, in and of themselves, demonstrate clinical utility since clinicians aim to classify patients into those who are versus are not at risk for IADL lapses. Therefore, we examined whether those variables that yielded statistically significant results in a regression would also reliably identify those participants whose ability to complete the DAILIES protocol was below average relative to the sample mean (according to the labeling adopted by the American Academy of Clinical Neuropsychology; Guilmette et al., Reference Guilmette, Sweet, Hebben, Koltai, Mahone, Spiegler, Stucky and Westerveld2020, i.e., 1.3 SDs below the sample mean; n = 12 for DAILIES-accuracy and n = 13 for DAILIES-timeliness). To that end, we subjected the statistically significant predictors identified in the regression analyses (i.e., D-KEFS-speed, IADL-self, and DRS-2) to a receiver operating characteristic (ROC) analysis, using the DAILIES “below-average” designation as the criterion. The results showed that D-KEFS-speed was able to classify participants into those whose DAILIES-accuracy was below average versus those who were average and above (AUC = .778, p < .001, 95% CI = .645 to .910). In contrast, IADL-self (AUC = .589, p = .351, 95% CI = .402 to .775) and DRS-2 (AUC = .654, p = .114, 95% CI = .463 to .844) did not reliably classify participants, despite having contributed unique variance in regression models. Additionally, D-KEFS-speed also identified individuals who were below average in terms of their DAILIES-timeliness (AUC = .702, p = .015, 95% CI = .537 to .866). See Table 8 for specific sensitivities and specificities.
Possible D-KEFS-speed cut-off scores for DAILIES impairment

Table 8. Long description
A table with three rows and five columns. The columns are labeled Classification variable, Test variable, Possible cut-offs, Sensitivity, and Specificity. The rows are as follows: Row 1: Classification variable, DAILIES-accuracy; Test variable, D-KEFS-speed; Possible cut-offs, 11.4375, 11.6250, 11.8333; Sensitivity, 0.750, 0.833, 0.917; Specificity, 0.657, 0.627, 0.588. Row 2: Classification variable, DAILIES-timeliness; Test variable, D-KEFS-speed; Possible cut-offs, 11.3958, 11.4375, 11.7708; Sensitivity, 0.692, 0.769, 0.846; Specificity, 0.673, 0.663, 0.594.
Note: Scores were chosen to maximize sensitivity while maintaining an acceptable sensitivity. Bolded scores represent the maximized score, and surrounding scores demonstrate sensitivity and specificity with higher and lower possible cut-off scores. Classification is positive (i.e., evidence of DAILIES impairment) if less than or equal to the presented cutoff scores.
Discussion
This study compared three common methods for estimating daily functioning (i.e., lab-based IADL tasks, self-report of IADLs, and traditional measures of EF) in their ability to predict two functional variables: (a) accuracy of performance on at-home IADL tasks (i.e., DAILIES-accuracy) and (b) ability to complete tasks during required timeframes (i.e., DAILIES-timeliness). The key findings are that (a) performance on traditional EF tests (i.e., D-KEFS-speed) and self-reported IADLs (i.e., IADL-self) emerged as unique predictors of at-home IADL accuracy, while performance on lab-based IADL tasks (i.e., IADL-lab) did not; (b) only D-KEFS-speed was associated with the ability to perform tasks during correct timeframes; (c) these relationships remained after controlling for general cognitive status (DRS-2 scores); and (d) only D-KEFS-speed was able to identify individuals who’s at-home daily functioning was below average relative to the sample mean.
The face-validity paradox
Office-based IADLs
The present findings contribute to a growing literature showing that face-valid assessment (i.e., tasks designed to resemble real-life situations) add little incremental utility beyond traditional measures of EF (Suchy et al., Reference Suchy, Lipio Brothers, DesRuisseaux, Gereau, Davis, Chilton and Schmitter-Edgecombe2022; Suchy et al., Reference Suchy, Gereau Mora, Brothers and DesRuisseaux2024; Suchy et al., Reference Suchy, Ziemnik, Niermeyer and Brothers2020a). However, prior research in this area has typically pitted EF tests with low versus high verisimilitude against each other. In contrast, the present study pitted traditional measures of EF against tasks designed to assess IADL capacity. Despite the similarity between the office-based IADL tasks and tasks performed at home, traditional EF tests paradoxically outperformed face-valid tasks in predicting functioning at home. There are at least three possible explanations for this finding.
First, independent daily functioning requires mental flexibility to move between tasks, the ability to inhibit distractions, and initiation and maintenance without prompting. Traditional EF tests have been specifically designed to repeatedly tax such EF processes (e.g., repeated need for inhibition during Color-Word Interference tasks). In contrast, office-based IADL tasks were not designed to tap EF processes, but rather to test previously learned (or even overlearned/routinized) skills such as counting money or reading pillbox labels. While an examinee may need to rely on EF processes to some extent while performing such tasks, the EF demands are relatively minimal compared to the demands of the real world. In other words, in contrast to measures of EF, office-based IADL tasks do not effectively tax the aspects of EF needed to complete real-life daily activities (Hering et al., Reference Hering, Kliegel, Rendell, Craik and Rose2018).
Second, office-based IADL tasks are performed in the structured environment of a laboratory, which alone makes them less executively taxing than tasks performed independently at home. While performance-based measures of EF are similarly performed in the structured confines of a laboratory or an office, they do, as explained above, require repeated and sustained reengagement of EF processes.
Third, there may be a discrepancy between what the DAILIES was designed to measure (e.g., independent IADLs; Brothers & Suchy, Reference Brothers and Suchy2022) and what it actually measures. Specifically, it is possible that performance on office-based IADL tasks does relate to real-world functioning, but not to DAILIES performance. In the DAILIES, participants knew well in advance the specified timeframe the tasks were to be completed in, providing participants with opportunities to plan ahead. This differs somewhat from daily life, where individuals do not always know ahead of time that they need to, for example, reschedule an appointment at the last minute. It is possible that the immediacy of office-based tasks of IADLs (captured by having participants complete tasks as quickly and accurately as they can with little preparation) relates to the immediacy of tasks in daily life not captured by the DAILIES. Moreover, although DAILIES tasks are embedded in participants’ daily routines, the study design measures only one task per day. As a result, it does not account for possible decreases in performance on other activities that might be affected by the added task.
Unfortunately, measurement of actual daily functioning (as opposed to a mockup of daily functioning, as was done in the present study) represents a major challenge in this line of research. Utilizing smart home methods (Schmitter-Edgecombe et al., Reference Schmitter-Edgecombe, Luna, Dai and Cook2024) in combination with complex AI-driven statistics (Cook & Schmitter-Edgecombe, Reference Cook and Schmitter-Edgecombe2025) may offer a yet closer approximation to actual daily life, although much more research is needed to determine the validity of this approach.
Self-report
In contrast to past research (Rueda et al., Reference Rueda, Lau, Saito, Harvey, Risacher, Aisen, Petersen, Saykin, Farias and Initiative2015; Schmitter-Edgecombe et al., Reference Schmitter-Edgecombe, Parsey and Cook2011; Suchy et al., Reference Suchy, Kraybill and Franchow2011; Votruba et al., Reference Votruba, Persad and Giordani2015), in the present study, self-reported IADLs incrementally contributed to the variance in at-home IADL performance above and beyond traditional measures of EF. However, ROC analyses failed to show self-report’s clinical utility, as the IADL self-report failed to generate acceptable sensitivities and specificities in identifying participants who had difficulties completing the DAILIES protocol.
Other predictors
D-KEFS accuracy and psychometrics
Contrary to our hypotheses, D-KEFS-accuracy did not emerge as a unique predictor of at-home IADL performance, likely due to its shared variance with D-KEFS-speed. D-KEFS-speed likely outperformed D-KEFS-accuracy due to better psychometric properties. Specifically, D-KEFS-accuracy, relative to the D-KEFS-speed, has a lower reliability (e.g., 0.68 and 0.85, respectively) and smaller variance (e.g., 1.28 and 3.30, respectively). Importantly, it is possible that our D-KEFS-accuracy variable would have a higher reliability and higher variance in a more cognitively impaired sample. In other words, the lower reliability may, in part, be a function of the low variance in our high functioning sample.
General cognitive status
Aligning with prior research (Johnson et al., Reference Johnson, Lui and Yaffe2007), the DRS-2 also accounted for a statistically significant, albeit small, amount of variance (∼4%) in accuracy of daily activities above and beyond EF. Nevertheless, it was not able to classify participants into groups based on daily task performance. Additionally, although one might expect a dementia screener to be sensitive to errors in timeliness (possibly due to participants forgetting tasks), our sample was largely cognitively intact. Thus, it is possible that the DRS-2 is sensitive to IADL timeliness, but likely only in samples with subtle to moderate memory difficulties.
Limitations and future directions
This study has some limitations. First, the sample is largely homogeneous, with over 90% of participants identifying as non-Hispanic White. Thus, as the proportion of non-Hispanic Whites in the general population declines over time (Ortman & Guarneri, Reference Ortman and Guarneri2009), the generalizability of our results may also decline. Additionally, our sample is generally high functioning with respect to cognition and educational achievement (M = 15.93 years), which further limits generalizability to older adults with lower educational attainment or cognitive abilities and/or with neurodegenerative conditions.
Second, daily task performance in the present study was likely impacted by several factors. For instance, research has shown that monetary incentives increase engagement in study activities (Abdelazeem et al., Reference Abdelazeem, Hamdallah, Rizk, Abbas, El-Shahat, Manasrah, Mostafa and Eltobgy2023). Thus, because participants were monetarily incentivized for completion of each of the daily tasks, their IADL performance may have reflected motivation for the incentive rather than their typical IADL functioning. Moreover, research has demonstrated that individuals behave differently when they are aware that performance is being monitored (i.e., Hawthorne effect; Berkhout et al., Reference Berkhout, Berbra, Favre, Collins, Calafiore, Peremans and Van Royen2022). Although the DAILIES tasks are completed outside of the research lab, it is possible that performance was impacted merely because participants knew their daily performance was being tracked. Finally, although the DAILIES tasks were relevant at the time of the protocol creation, some of the tasks have more recently begun to be outdated with the availability of online password management or electronic bill autopayment methods. However, because these advancements are fairly recent, it is unlikely that participants’ performance on the DAILIES was unduly confounded by the lack of familiarity with these tasks.
Third, our results rely only on one self-report measure and one office-based measure of IADLs. It remains possible that other common self-report and office-based measures could have yielded different results. The ability of other self-report and performance-based measures of IADLs to predict daily functioning beyond traditional EF tests should be evaluated in future studies. Nonetheless, in the very least, the present study shows that face validity alone cannot be expected to automatically result in superior prediction of daily life.
Conclusions
To our knowledge, this is the first study to directly compare the ability of self-reports of IADL performance, performance-based IADL assessment in the lab, and performance-based measures of EF as predictors of accuracy and timeliness of IADLs completed independently at home. The current study found that EF scores accounted for the greatest amount of unique variance in at-home IADL performance. While the self-report measure of IADLs also accounted for a statistically significant variance in a regression model, the amount of variance was small. Importantly, only the speed of performance on traditional tests of EF was able to identify participants with below-average at-home IADL accuracy and timeliness. These findings suggest that traditionally measured EF, compared to certain self-report and performance-based IADL measures, may have the most incremental and clinical utility in identifying individuals who are at risk for IADL lapses, especially in cognitively healthy community samples.
Acknowledgements
None.
Funding statement
None.
Competing interests
None.




 Open access

