The presence of the Northern Cities Shift (NCS) formed the basis on which the Atlas of North American English (Labov, Ash, & Boberg, Reference Labov, Ash and Boberg2006; henceforward ANAE) defined the dialect region of the Inland North, focused on the urban areas south of the Great Lakes, from central New York to Wisconsin. The NCS involves a rotation of the short vowels, including the raising and fronting of trap,Footnote 1 the fronting of lot, the backing and/or lowering of dress, and other changes. The most distinctive feature of the NCS is the raising of trap, which is the focus of this paper.
The NCS has received a great deal of attention in sociolinguistic research (e.g., Durian, Reference Durian2014; Eckert, Reference Eckert1988; Labov, Reference Labov1994; Labov, Yaeger, & Steiner, Reference Labov, Yaeger and Steiner1972; McCarthy, Reference McCarthy2010). Although most of these studies focused on urban environments (e.g., Chicago, Buffalo, Rochester), and the NCS has generally been described as an urban phenomenon, research into small-town communities has shown that the shift has also been adopted by rural speech communities. For example, Dinkin's (Reference Dinkin2009, Reference Dinkin2013) study of several smaller cities and rural communities in central and northern New York found moderate NCS participation in some of these, which he termed Inland North fringe communities. A study of the shift in small-town Michigan (Gordon, Reference Gordon2000) led to similar conclusions. The results from all these studies suggested that, in both rural and urban communities, raised trap was a stable feature.
More recent research, however, has found that NCS communities are starting to lose this vowel shift. Apparent-time backing of NCS-fronted lot was observed first in Chicago (McCarthy, Reference McCarthy2011) and upstate New York (Dinkin, Reference Dinkin2011). Retreat from raised trap has been observed in Chicago (D'Onofrio & Benheim, Reference D'Onofrio and Benheim2020; Durian & Cameron, Reference Durian and Cameron2018), Buffalo (Milholland, Reference Milholland2018), Rochester (Kapner, Reference Kapner2019; King, Reference King2017), Syracuse (Driscoll, Reference Driscoll2016; Driscoll & Lape, Reference Driscoll and Lape2015), and Lansing (Nesbitt, Reference Nesbitt2018, Reference Nesbitt2019; Wagner, Mason, Nesbitt, Pevan, & Savage, Reference Wagner, Mason, Nesbitt, Pevan and Savage2016). In Lansing, Wagner et al. (Reference Wagner, Mason, Nesbitt, Pevan and Savage2016) and Nesbitt (Reference Nesbitt2018, Reference Nesbitt2019) reported the development of an allophonic alternation: prenasal trap remains in raised position while preoral trap retracts, producing what ANAE (p. 174) terms the nasal short-a system; King (Reference King2017) and Kapner (Reference Kapner2019) both reported the same in Rochester. Driscoll and Lape (Reference Driscoll and Lape2015) found that this retraction seems to be progressing faster among speakers in the rural environs of Syracuse than among urban speakers, which suggests that urban and rural communities might be treating trap differently in terms of its reversal.
The force behind the retraction of trap may be related to an increased level of social salience. Sociolinguists have frequently described the NCS as transparent to its speakers and, therefore, apparently unavailable for negative social evaluation. For example, Gordon (Reference Gordon2000:178) wrote that “For the most part, speakers… do not seem to be aware of the variation”; and Preston (Reference Preston1998) has reported that residents of Michigan regard their state, despite the presence of the NCS there, as one where unmarked standard English is spoken. Labov (Reference Labov2010:194) argued that “NCS variables appear to be indicators rather than markers, with little style-shifting associated with their social distribution and with no evidence of conscious awareness in the Inland North.” If style-shifting was observed in the usage of NCS features at all, their incidence seems to have increased in more careful speech styles: Labov (Reference Labov2010:59) cited Ash (Reference Ash1999) as finding that “the comparison of word lists and spontaneous speech in ANAE interviews showed that the raising of short a in the Northern Cities Shift was more advanced in word lists.”
Recent research, however, has found that at least some NCS variables have become subject to social evaluation. In Lansing, attitude studies have shown that the fronted NCS variant of lot is evaluated negatively, while the retracted NCS variant of dress is evaluated more favorably than its unshifted counterpart (Nesbitt & Mason, Reference Nesbitt and Mason2016; Savage, Mason, Nesbitt, Pevan, & Wagner, Reference Savage, Mason, Nesbitt, Pevan and Wagner2016). For trap, the evidence of social evaluation is less substantial. Accounts from focus-group interviews and anecdotal evidence in Lansing and Syracuse show that raised realizations of trap have attracted overt comment (Savage et al., Reference Savage, Mason, Nesbitt, Pevan and Wagner2016) and suggest an increasing stigma around raised trap (Driscoll & Lape, Reference Driscoll and Lape2015). However, since none of the above studies took style-shifting in speech production into account, the question of how potential negative evaluations might affect the treatment of trap in production remains unanswered.
The goal of this study is to address two of the questions posed above. Is raised trap retreating in a remote rural area, as it has been found to be in urban areas and their environs?Footnote 2 And how does suspected negative evaluation of trap affect its production? To answer these questions, we will track the production of trap in different speech styles in apparent and real time in the small, rural community of Ogdensburg in northern New York. So far, few studies have looked at speech patterns in this rural part of the state, and none have focused in depth on a single speech community; Dinkin (Reference Dinkin2009, Reference Dinkin2013) grouped Ogdensburg with the Inland North fringe based on data collected in 2008. This paper reports on new data from the same community, collected in 2016. We observe interaction between year of birth and speech style for preoral trap, and an unexpected effect of year of interview; we argue that the NCS raising of trap has virtually disappeared from the community. This retraction appears to be driven by a growing stigma around raised trap, as we find speakers avoiding raising especially in careful speech.
PAST RESEARCH AND MOTIVATION
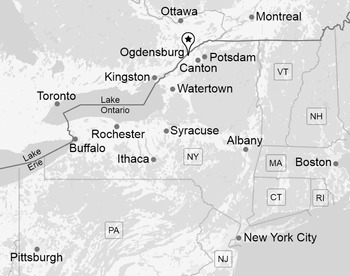
Ogdensburg is a small community of about 11,000 people in northern New York, located in sparsely populated St. Lawrence County. Despite its small size, Ogdensburg is one of the most populous settlements in the county and the only one with the legal status of a city. It is situated on the St. Lawrence River, the national border between the US and Canada, and is home to the Ogdensburg–Prescott International Bridge that connects the city to Ontario. As shown in Figure 1, Ogdensburg is relatively remote from American population centers; the nearest cities with populations greater than 50,000 are Ottawa and Kingston, both in Ontario.
Ogdensburg's location in New York State.

Ogdensburg was once a vibrant industrial city. Benefiting from its position on the St. Lawrence River, which connects it to Lake Ontario, it was an important shipping and railroad hub. The city entered a sharp economic decline in the second half of the twentieth century and never fully recovered; today, Ogdensburg performs below average in terms of socioeconomic success compared to the rest of St. Lawrence County and New York State. As of 2016, only half of Ogdensburg's residents over the age of sixteen were in the city's labor force, while an estimated 9.2% were unemployed.Footnote 3 St. Lawrence County has a relatively low median household income ($46,000), among the ten lowest of the sixty-two counties in the state of New York. Even by these low standards, Ogdensburg's median household income is well below average: at $36,832, it was third lowest in the county in 2016. Although there are several institutions of higher education in the vicinity,Footnote 4 only about 16% of Ogdensburg's population had attained a college degree in 2016, while the average in New York State was more than twice as high (U.S. Census Bureau, n.d.).
Dinkin (Reference Dinkin2009, Reference Dinkin2013) found NCS vowel realizations, including raised trap, in Ogdensburg, but not in the nearby village of Canton less than twenty miles to the southeast, leading him to describe Ogdensburg as the northeasternmost limit of the NCS. This description was corroborated by a later study (Dinkin, Reference Dinkin2020) sampling more villages in the vicinity. Ogdensburg's only geographical connection to other known NCS communities lies to the southwest, toward the city of Watertown. To the northwest of Ogdensburg lies Canada, and to the east is the dialect region Dinkin (Reference Dinkin2009) termed the North Country; in both of these neighboring regions, the NCS is absent (Dinkin, Reference Dinkin2009, Reference Dinkin2013; Labov et al., Reference Labov, Ash and Boberg2006).
Dinkin's corpus includes nine native Ogdensburg speakers, interviewed in 2008. These nine speakers include five born in the 1980s, one each born in the 1970s, 1960s, and 1950s, and one old outlier born in 1922. Seven are female, two are male; all nine are white. Seven were interviewed in person, following the protocol for a Short Sociolinguistic Encounter (Ash, Reference Ash2002) that lasted 15–25 minutes and included the reading of a wordlist and other targeted elicitation tasks in addition to free conversation. Two participants were interviewed by telephone following the ANAE methodology. Vowel formants were extracted at points chosen manually in Praat (Boersma & Weenink, Reference Boersma and Weenink2005) and originally normalized using the same algorithm and group norm used in ANAE, based on Nearey (Reference Neary1977). Phoneme means were calculated following ANAE methodology, excluding tokens before sonorants, after glides, and after stop+liquid clusters. An average of 395 vowel tokens per speaker were measured, of which an average of thirty-seven were trapFootnote 5: twenty-four in spontaneous speech, nine elicited through wordlist reading, and four elicited through other procedures. Full methodological details can be found in Dinkin (Reference Dinkin2009).
The analysis of trap in Dinkin (Reference Dinkin2009, Reference Dinkin2013) was based on two criteria defined by ANAE, designated AE1 and EQ. The AE1 criterion considers a speaker to have NCS-raised trap if their mean normalized F1 of trap is less than 700 Hz. The EQ criterion defines raised trap as being both higher (i.e., having a lower F1) and fronter (i.e., having a higher F2) than dress. The AE1 and EQ criteria are both valuable for measuring participation in trap-raising: AE1 measures trap directly, but its value depends on the normalization methodology chosen and on the somewhat arbitrary value of 700 Hz; EQ is based on more objective criteria but cannot necessarily distinguish between the raising of trap and the lowering of dress.
All Ogdensburg speakers interviewed in 2008 produced a relatively high trap. Out of the nine speakers, three fulfilled the AE1 criterion, raising trap to a mean F1 less than 700 Hz; the others all had mean trap F1 less than 770 Hz. Four of the five youngest speakers fulfilled the EQ criterion, raising trap above dress, indicating an apparent-time trend toward the EQ criterion, as shown in Figure 2; Dinkin (Reference Dinkin2009:92–3) concluded that this trend was the result of ongoing lowering and backing of dress. Ogdensburg was the only community sampled by Dinkin (Reference Dinkin2009) where apparent-time trends toward NCS features could be observed. In all other sampled NCS communities, most of which had greater EQ participation than Ogdensburg, the NCS was apparently no longer in progress. Full details on their production can be found in Dinkin (Reference Dinkin2009).
The relative height of trap and dress in 2008, according to Dinkin (Reference Dinkin2009). On this and other scatterplots, the LOESS curve shows the overall trend.

Ogdensburg's status as a small city squeezed between non-NCS regions to the north and the east, but where NCS was nonetheless seemingly increasing, motivated an in-depth follow-up study of the community. There is no obvious reason why Ogdensburg should have been behind in adopting NCS features. Communities of similar sizes and with similar median household incomes and geographical distances to urban NCS communities had completed the adoption of the NCS despite these characteristics. Gloversville, for example, is only slightly bigger, and has an even lower median household income than Ogdensburg. Glens Falls, while somewhat bigger and wealthier, is just as remote from urban NCS communities as Ogdensburg. In neither of these two communities did the NCS seem to still be in progress.
While Ogdensburg was apparently late in adopting the NCS, it showed relatively strong signs of incipient change toward the low back merger of lot and thought, contrary to the traditional maintenance of the distinction in NCS communities. This suggested that Ogdensburg might be subject to influence from Canada and/or the North Country, neighboring dialects with more thorough low back merger.
Thus, Ogdensburg appeared to be a fruitful site for an in-depth sociolinguistic study examining how two linguistic changes that have been thought to be mutually exclusive (Labov et al., Reference Labov, Ash and Boberg2006) co-exist and interact in such close proximity. As will be shown below, however, Ogdensburg's status as an NCS community may have been short-lived. This paper will focus on unexpected findings relating to the raising of trap in Ogdensburg, which will illuminate the means by which retreat from dialect features such as the NCS takes place; analysis of the low back merger in Ogdensburg will be left for future work. In our analysis we emphasize the effect of style-shifting, which has apparently gone underexamined in other recent studies of NCS trap.
METHODS
New Ogdensburg data
The 2016 data was collected by Anja Thiel during a three-month fieldwork stay in Ogdensburg. Participants were recruited through social and print media, as well as by using the “snowball” technique (i.e., interviewees recruited friends or family members as participants). Interviews were scheduled in advance and lasted 1–2 hours. The interviews generally included spontaneous speech elicitation in a casual conversation that lasted 30–90 minutes, followed by wordlist and minimal-pair readings. In total, the 2016 corpus comprises thirty-nine speakers born between 1932 and 2002 (mean: 1969), including twenty-five women and fourteen men. All speakers except oneFootnote 6 are white. The data were subjected to automated vowel extraction using FAVE (Rosenfelder, Fruehwald, Evanini, & Yuan, Reference Rosenfelder, Fruehwald, Evanini and Yuan2011), which produced formant values normalized using the Lobanov (Reference Lobanov1971) algorithm, setting each speaker's overall mean F1 equal to 650 Hz (with a standard deviation of 150) and mean F2 equal to 1700 Hz (standard deviation 420). Phoneme means were calculated according to the ANAE methodology as described above. Formant measurements for an average of 2,016 vowel tokens per speaker were extracted, including an average of 150 tokens of trap: nine in wordlist style and 141 in spontaneous speech. Regression analyses for F1 of trap reported below exclude tokens of trap preceding nasals or /r/. Full details on this corpus can be found in Thiel (Reference Thiel2019).
In this paper, we compare the production of trap in this new corpus to that in Dinkin (Reference Dinkin2009)'s data collected in 2008. For comparability with the new Ogdensburg data in the present paper, the 2008 data were renormalized using the Lobanov method,Footnote 7 with the same standardized FAVE means. As the summary of methodological characteristics of the 2008 and 2016 data in Table 1 shows, there are noteworthy differences between the two studies. For example, in 2008, subjects were interviewed for twenty minutes by a native English speaker who recruited them on the spur of the moment, whereas in 2016 they were interviewed for more than an hour by a nonnative speaker during a scheduled appointment. But for reasons to be discussed below, we do not believe these methodological differences are responsible for the differences between the treatments of trap in the two corpora. Potentially of more importance, formant measurements in the 2008 data were selected by choosing a measurement point by hand, while in the 2016 data they were automatically extracted. Severance, Evanini, and Dinkin (Reference Severance, Evanini and Dinkin2015) contended that the differences between these two measurement methods are in general small, and recent studies such as Turton and Baranowski (Reference Turton and Baranowski2020) have productively combined hand-measured data with FAVE measurements; but to be sure, in the next section we will verify that, in our data, the two methods yield sufficiently comparable results to be includable in the same analysis.
Comparison of methods for the 2008 and 2016 data sets

Comparing automated and hand measurements
We compare hand measurements of a selection of the 2016 data to the automated measurements of the same. We randomly selected fifteen speakers from the thirty-nine interviewed in 2016; and from these speakers we randomly selected 393 preoral trap tokens. F1 of these 393 tokens was measured in Praat 6.1 (Boersma & Weenink, Reference Boersma and Weenink2020), at measurement points chosen by hand according to the same methodology used for the 2008 data. These F1 measurements were then compared to the unnormalized FAVE measurements for the same set of tokens.
For the majority of tokens, the two measurements differ by less than 25 Hz; three quarters differ by less than 50 Hz, although there are outliers ranging beyond 300 Hz in either direction (see Figure 3). The mean absolute magnitude of the difference between the two measurements is 39 Hz. There is a very slight tendency for hand measurements to produce larger F1 values than FAVE measurements (p ≈ 0.02 in a paired t-test); the mean difference between the two measurements is 7.6 Hz, which we believe is small enough to consider negligible on the scale of the F1 differences that will be relevant in this paper.
The difference between F1 measured by hand and by FAVE-extract for 393 randomly selected trap tokens from the 2016 corpus. Positive values mean that hand measurement produced a larger F1 value.

We may also calculate the mean difference between hand and FAVE measurements of trap F1 for each speaker (see Figure 4). The absolute value of this mean difference is less than 15 Hz for the majority of speakers, and less than 30 Hz for all but one. The mean of the speakers’ mean differences is 7.8 Hz.
Unnormalized mean FAVE and hand measurements of trap F1 for fifteen randomly selected speakers interviewed in 2016.

Table 2 shows the results of a mixed-effects regression model investigating whether any factors systematically bias FAVE to produce results higher or lower than hand measurements on this subsample of 393 tokens. We find that hand measurements tend to be slightly more extreme than FAVE measurements: for large F1 values,Footnote 8 the hand measurements tend slightly larger than FAVE, and for small F1 values, the hand measurements tend slightly smaller. There also appears to be an age correlation: hand measurements are more likely to be larger than FAVE measurements for older speakers than for younger speakers. However, the sizes of the effects are fairly small. For tokens with F1 between 500 Hz and 900 Hz (within which the vast majority of tokens lie), produced by a speaker born in 1986, the model predicts that hand and FAVE measurements will differ on average by less than 25 Hz; and as we will see below it is among speakers born in the 1980s that the differences between the 2008 data (measured by hand) and the 2016 data (measured by FAVE) are of greatest interest. Even for 75-year-old speakers, the model predicts that hand-measured F1 values will exceed FAVE values within that range by an average of less than 42 Hz. We infer from this that F1 values in the hand-measured data from 2008 and the FAVE-measured data from 2016 appear sufficiently comparable to be included in the same analysis.
A linear mixed-effects regression model for the F1 difference between hand measurements and FAVE-extract measurements of a subsample of trap tokens

Note: “Estimated F1” denotes the mean of the two measurements of F1; “age” denotes age in 2016. Positive coefficients favor hand measurements being larger than FAVE measurements. Model calculated by a step-down procedure.Footnote 9 Not significant: speaker gender, speech style, coda place of articulation, onset. Random factors: speaker, word.
RESULTS
Overall results
Unlike in the 2008 data, speakers in the 2016 sample fail to meet the two criteria for NCS trap. Based on overall means, none of the speakers interviewed in 2016 raise trap to a (normalized) F1 less than the AE1 benchmark of 700 Hz.Footnote 10 In the 2008 data, five speakers satisfy AE1, four of them born after 1980. Figure 5 shows the comparison between the 2008 and 2016 interviews in this regard. Similarly, as shown in Figure 6, none of the 2016 speakers raise trap above dress to fulfill EQ. In the 2008 data, on the other hand, four of the youngest speakers fulfill EQ.
Overall F1 trap means and AE1 participation in 2008 and 2016.

Overall EQ participation in 2008 and 2016.

Because of the patterns in trap production in the 2008 data, the lack of AE1 and EQ participation in 2016 is highly unexpected. To find potential explanations for the sudden absence of raised trap in the community, more detailed insight into the data is necessary. To conduct this more in-depth analysis, we separate the data by style, and examine F1 of trap in spontaneous speech and the more careful wordlist style individually. We begin with a distributional inspection of each combination of style and sample year, and then calculate a multiple linear regression on the combined data set.
Spontaneous Speech
The results for trap in spontaneous speech resemble the overall patterns described above very closely; this is unsurprising, since the majority of the data is spontaneous speech. While the 2008 data show moderately advanced trap-raising among younger speakers, such raising is absent in the 2016 data, indicating a real-time change away from NCS trap.
As can be seen in Figure 7, six of the nine speakers in the 2008 sample satisfy the AE1 criterion in spontaneous speech: the six women other than the old outlier. For four of the five women born in the 1980s, trap is higher than dress in this style. The fact that the two male speakers have lower trap than all seven women suggests that the NCS may have been a female-led change in Ogdensburg, though the number of speakers in the data is too small to enable a firm conclusion to be drawn in this regard. Similarly, the slope of the trendline in Figure 7 suggests an apparent-time change toward trap-raising, though we must exercise caution in drawing conclusions from this small sample. In any event, with the majority of speakers in this sample satisfying the AE1 criterion, we might expect to find substantial raising of trap in the 2016 data as well, at least among younger women, and perhaps an apparent-time trend toward further raising.
F1 trap means and AE1 participation in spontaneous speech in 2008. n = 136.

In fact, no speakers in the 2016 data satisfy the AE1 criterion in spontaneous speech, and there is no hint of gender patterning or apparent-time trend in F1 of trap (see Figure 8). Instead, the 2016 data suggests that trap F1 has remained between 720 and 850 Hz over the last seventy years, constituting a stable non-NCS trap system.
F1 trap means and AE1 participation in spontaneous speech in 2016. n = 3704.

Some of the speakers in 2016 do produce relatively high trap in spontaneous speech, but none of them produce it high enough to meet the 700-Hz mark, nor do any of them raise trap above dress in spontaneous speech. Indeed, all but one speaker in 2016 has mean spontaneous trap lower than all but one speaker in 2008. Thus, despite the robust presence of trap-raising in Ogdensburg in 2008, in 2016 we find trap substantially less raised, with no visible apparent-time trend in either direction.
Wordlist style
In wordlist style, apparent-time trends indicate a shift away from NCS trap, which is corroborated by real-time differences between 2008 and 2016, as 2016 speakers have lower trap in wordlist style than 2008 speakers. Five of the speakers interviewed did not participate in wordlist reading: the two interviewed by telephone in 2008 (including the oldest individual in the combined corpus) and three in 2016.
In the 2008 wordlist data, it is only in the two relatively older speakers that mean F1 of trap less than 700 Hz is found, satisfying the AE1 criterion (see Figure 9). This differs from spontaneous speech, in which it was the youngest speakers who produced the most raised trap. In the 2016 data, two speakers satisfy AE1 in wordlist style (see Figure 10), even though none satisfied it in spontaneous speech. Trap appears to be lowering in apparent time in this style, continuing the trend suggested by the 2008 data; the two speakers who satisfy AE1 are in the older half of the sample.
F1 trap means and AE1 participation in wordlist style in 2008. n = 56.

F1 trap means and AE1 participation in wordlist style in 2016. n = 344.

A real-time difference can be observed in wordlist style between the 2008 and 2016 datasets. As shown in Figure 11, speakers interviewed in 2008 produced trap in wordlist style on average about 85 Hz higher than 2016 speakers. Both data sets seem to show trap lowering in this speech style in apparent time, and the four speakers from both datasets who do raise trap to F1 less than 700 Hz in wordlist style were all born between 1958 and 1966.
F1 trap means and AE1 participation in wordlist style in 2008 and 2016. n = 400.

Style-shifting
Figure 12 displays each speaker's range of style-shifting: that is, the difference between each speaker's wordlist and spontaneous trap means. It shows that most older speakers shift toward raised trap in wordlist style, whereas younger speakers shift away from it. This pattern is visible in both the 2008 and the 2016 data. This indicates an apparent-time change in progress affecting the direction of style-shifting: the community is changing from treating raised trap as a target of more careful speech, as Ash (Reference Ash1999) reportedly found, to avoiding it in more careful speech.
Difference between spontaneous and wordlist trap F1 means. A positive value means the vowel is more raised in wordlist style than spontaneous speech.

Furthermore, a gender difference in style-shifting is visible: although all older male speakers shift toward raised trap in wordlist style, a handful of older female speakers do the opposite, showing the style-shifting pattern of younger speakers. This indicates that the change in style-shifting is a female-led change: some older women anticipate the direction of the change in progress, while older men uniformly have the more conservative pattern.
A mixed-effects linear regression model for the height of trap is shown in Table 3. The model includes terms for the four predictors whose effects on trap have been discussed so far—speaker age and gender, wordlist versus spontaneous speech style, and year of interview—as well as significant pairwise interactions between them.Footnote 11 Following consonant is also included as a predictor in the model; for the sake of conciseness, the coefficients for this predictor are omitted here but can be found in Appendix B. The coefficients in Table 3 support most of the key observations above.
• The effect of sample year indicates that speakers interviewed in 2008 have trap about 76 Hz higher (i.e., with smaller F1) than those in 2016.
• The main effect of style confirms that young people have trap lower in wordlist style than in spontaneous speech, while the interaction between style and age indicates that older speakers have trap higher in wordlist style.
• The interaction between style and gender confirms the significance of the gender difference in style-shifting noted above: women are more likely than men to style-shift away from raised trap in wordlist style (i.e., are leading the change toward this direction of style-shifting).
The negligibly small coefficient for the main effect of age indicates that there is no evident apparent-time change affecting spontaneous speech.
Social factors in a linear mixed-effects regression model for the height of trap

Note: Following consonant is included as a factor in the model; details are shown in Appendix B. Tokens of trap in styles other than wordlist or spontaneous are omitted from the model. Reference levels: female, spontaneous speech, 2016 interview. “Age” denotes age in 2016, even for speakers interviewed in 2008. Random factors: speaker, word. We omit p-values for main effects of predictors whose significant interactions are included in the regression.
Education
Durian and Cameron (Reference Durian and Cameron2018) cautioned that studies on the retreat of NCS must take care not to attribute to the community as a whole a retreat that may only be taking place in the middle class. Both Durian and Cameron (Reference Durian and Cameron2018) and Nesbitt (Reference Nesbitt2018, Reference Nesbitt2019) found indices of trap-raising persisting longer in speakers with blue-collar occupations; Milholland (Reference Milholland2018) found the same in speakers with less education. Similar patterns have been reported in the reversal of the Southern Shift (Dodsworth & Kohn, Reference Dodsworth and Kohn2012). It is, therefore, important to test whether the apparent loss of NCS in Ogdensburg is conditioned by social class, for which education is the most accessible indicator available in our data. However, since several of the youngest individuals in the corpus were high-school students when interviewed, their eventual ultimate education level is unknowable; for this reason, education level was not included in the regression model shown above in Table 3. Excluding students, the 2016 data include twenty-three individuals with a college education and nine without.
The trendlines on Figure 13 appear to suggest that the overall lack of age correlation in the data may actually be the combination of two contrary trends: trap in spontaneous speech is lowering in apparent time among speakers with a college education but is still raising among speakers without one. The difference between these two slopes, as estimated by the linear mixed-effects regression model in Table 4, does not quite reach the level of statistical significance (p ≈ 0.07), but, if authentic, it would fit the expected profile of speakers with more access to social prestige being the first to retreat from the NCS. This may mean that our discussion above overstates the degree to which trap-raising has retreated in Ogdensburg overall, since speakers with a college education are overrepresented in our sample relative to their actual proportion in Ogdensburg. However, even the non–college-educated individuals in the 2016 sample do not satisfy the AE1 or EQ criteria, which the younger speakers in 2008 almost uniformly do, regardless of education level. Thus, even if we assume that less-educated individuals retain the NCS to a greater extent than more-educated speakers, they do so to a much lower degree than appeared to be the case in 2008.
F1 of trap in spontaneous speech in 2016, by education level.

Social factors in a linear mixed-effects regression model for F1 of trap, including education, in the 2016 data

Note: Following consonant is included as a predictor in the model but omitted here for conciseness. Tokens of trap in styles other than wordlist or spontaneous are omitted from the model, as are speakers who were students when interviewed. Random factors: speaker, word.
Methodological concerns
The difference in trap F1 between the 2008 and 2016 data sets is so striking, and the real-time separation between them so short, that we must consider alternate possible explanations for the difference before accepting the conclusion that NCS raising of trap simply disappeared from spontaneous speech in Ogdensburg within a span of eight years. One possible explanation might be the methodological differences that do exist between the 2008 and 2016 studies.
As noted above, the formant measurements in the 2008 data were extracted at points selected by hand in Praat by Dinkin (Reference Dinkin2009), whereas the 2016 data had its formant measurements extracted by the FAVE software package (Rosenfelder et al., Reference Rosenfelder, Fruehwald, Evanini and Yuan2011). When we compared hand and FAVE measurements of a subsample of the 2016 tokens, although some individual tokens had large discrepancies, the mean difference between (unnormalized) measurements was less than 10 Hz, especially among younger age cohorts; and it is in younger cohorts that the difference between raised trap in the 2008 data and unraised trap in the 2016 data appears. It therefore seems unlikely that the difference between formant measurement methodologies could produce such a large-scale bias as to lead to a mean difference of 76 Hz. To the extent that a bias did exist, it was toward slightly larger F1 values in hand measurements; since our comparison between the 2008 data and 2016 data finds smaller F1 values in 2008, if anything this suggests that the difference in methodologies might slightly understate the difference between the two data sets.
The two data sets were also collected under somewhat different circumstances. In 2008, the interviews were conducted by a native speaker of (non-NCS) American English, mostly via the Short Sociolinguistic Encounter method (Ash, Reference Ash2002): individuals were recruited on the spur of the moment for brief interviews, the longest of which was twenty-five minutes. In 2016, interview subjects were recruited in advance, and interviews took place at scheduled times; these interviews lasted 1–2 hours and were conducted by a native speaker of German. It is possible that the difference in interview methodologies could have elicited a reduced rate of trap-raising in 2016.
It is not obvious a priori whether the long interviews in 2016 would be expected to elicit more or less monitored speech than the short interviews in 2008. On the one hand, the more involved procedure of setting up an appointment could have emphasized the formal nature of the interview, thus eliciting more careful speech in 2016; on the other hand, the greater length of the interviews in 2016 may have given speakers more time to become accustomed to the conversation and the interviewer, and relax into a more casual speech style (see Chambers, Reference Chambers2008; Milroy & Gordon, Reference Milroy and Gordon2003). The fact that the interviewer in 2016 was a nonnative English speaker may have prompted speakers to attempt a more standard or careful pronunciation, out of concern that she might not understand more regionally marked variants. Since young speakers usually shift away from trap-raising in careful style, any factor that might have produced more careful speech overall in the 2016 interviews might be responsible for the lower overall level of trap in that data.
However, even if we assume for these reasons that, in 2016, spontaneous speech was produced in a more careful style than in 2008, that hardly seems likely to account alone for the magnitude of the difference between the trap F1 measurements of these two supposed styles. As Table 5 shows, among speakers born in the 1980s or later in the 2016 data, the mean difference between wordlist and spontaneous trap F1 is about 33 Hz. The difference between the mean spontaneous trap F1 of these speakers and the mean spontaneous trap F1 of the speakers born in the 1980s in the 2008 data is about 118 Hz: more than three times that difference. If we compare only speakers born in the 1980s in both data sets, the ratio is even larger. In other words, if the difference between spontaneous speech in 2008 and spontaneous speech in 2016 is merely because these represent two different spontaneous styles, the difference between these two styles is at least three times as wide as the difference between the 2016 spontaneous and wordlist styles. While we cannot entirely rule out this possibility, it strikes us as improbable that the difference between two spontaneous-speech interview styles with different interviewers, even if one is a nonnative speaker, would be so much greater than the difference between spontaneous speech and wordlist style with a single interviewer. In other words, it seems very likely that at least some of the difference between the 2008 and 2016 trap F1 is the result of real-time change: that is, that the community at large actually produced trap less raised in 2016 than in 2008.
F1 trap means in young age cohorts

DISCUSSION
Overall, the results presented above suggest that raised trap has been abandoned in Ogdensburg fairly suddenly. This is most evident in the real-time comparison between 2008 and 2016 speakers, where 2016 speakers produce trap significantly lower than 2008 speakers in both spontaneous speech and wordlist reading. The suddenness of this change is indicated by the absence of any apparent-time trends away from trap-raising in the spontaneous-speech data, as if the entire community quit trap-raising abruptly sometime between the two studies.
Although the change in spontaneous speech is visible in real time but not in apparent time, apparent-time trends are visible in the lowering of trap in wordlist style—and even more clearly in the reversal of the difference between wordlist and spontaneous speech.Footnote 12 The difference between the two styles shows the sociolinguistic profile expected for a change in progress, with women favoring the innovative pattern and a clear age correlation. The apparent-time change in style-shifting is such that older Ogdensburgers raise trap more in careful style than spontaneous speech, and younger people do the opposite; though not statistically significant, the social stratification between speakers of different education levels also appears to reverse over apparent time. The apparent-time reversal of the effect of style-shifting suggests that what is changing in Ogdensburg may be people's attitudes toward raised trap, and the evaluation of it as a nonstandard feature: raising is coming to be interpreted as more nonstandard, leading speakers to retreat from it, especially in careful style. This is reminiscent of, for example, the recent history of thought raising in New York City, which was reversed owing to negative social perception (e.g., Becker, Reference Becker2014).
Therefore, we propose that a growing negative evaluation of raised trap may have been one of the motivations for speakers to have abandoned raised trap in favor of the nonlocal standard, unraised trap. The change in evaluation of raised trap follows the textbook profile of the process of a sociolinguistic “indicator” becoming a “marker,” defined by Labov (Reference Labov2001:196) as stages in the lifecycle of a language change from below:
Changes from below begin as indicators…. At this stage, they show zero degrees of social awareness…. As they proceed to completion, such changes usually acquire social recognition as linguistic markers, usually in the form of social stigma, which is reflected in… a steep slope of style-shifting, and negative responses on subjective reaction tests.
As NCS trap-raising becomes a marker in Ogdensburg,Footnote 13 we see the predicted steep slope of style-shifting. Thiel (Reference Thiel2019) also found negative responses to raised trap on subjective-reaction tests in Ogdensburg, meaning that both of Labov's predicted indices of social stigma have emerged.
The effect of gender is also consistent with what we might expect to see in a transition from an indicator to a marker. In 2008, the two male speakers appear to have lower spontaneous trap than the women do. In 2016, there is no gender difference in spontaneous speech, but women lead the trend toward lowering trap in wordlist style. This is reminiscent of the pattern found in the reversal of several sound changes in Philadelphia by Labov, Rosenfelder, and Fruehwald (Reference Labov, Rosenfelder and Fruehwald2013). Labov et al. found that changes such as the fronting of mouth and goat, which had been documented as changes from below (Labov, Reference Labov2001), are in the process of reversing, under pressure of negative social evaluation. They reported that the changes in both directions—both the original fronting of mouth and goat, and the retraction once the fronted variants had become stigmatized—were led by women. The data from Ogdensburg suggests the same pattern: in 2008, when trap-raising in spontaneous speech was still robust, it was apparently led by women; but the lowering of trap in wordlist style in 2016 is led by women as well.
The absence of any visible apparent-time trend away from raised trap in spontaneous speech is still a puzzle, given the clear apparent-time trend in style-shifting and the seemingly rapid change visible in the real-time comparison of the 2008 and 2016 data. While wordlist style shows what appears to be generational change—a change taking place as a result of younger generations acquiring a different set of standards than their elders held—spontaneous speech appears to display what Labov (Reference Labov1994:83–4) termed “communal change”: change due to all members of a community simultaneously adopting a linguistic innovation. It appears that, as perception of trap-raising as a nonstandard feature gradually grew, its nonstandard evaluation eventually became salient enough to drive speakers to avoid it in spontaneous speech. It seemingly achieved this level of salience in the community sometime between 2008 and 2016, leading to the absence of trap-raising even among speakers of an age cohort that had showed raising robustly in spontaneous speech in 2008. This, again, is reminiscent of patterns found in Philadelphia. Fruehwald (Reference Fruehwald2017) found some evidence of communal change (which he terms a “zeitgeist” effect) away from the fronting of goat, which, like trap in Ogdensburg, was transitioning from an indicator to a marker in Philadelphia: men, although not women, retreated from goat-fronting via a communal change in the 1980s. Goat was, however, the only one of the features that was becoming a marker to show evidence of communal change; it is not clear why some changes are subject to such “zeitgeist” effects and others are not.
Labov (Reference Labov1994) attributed communal change chiefly to lexical and syntactic change. It is well documented that members of a community may also participate in phonetic change in progress over their lifespans; but in those cases, the change is typically still visible in apparent time (e.g., Hollett, Reference Hollett2006; Sankoff & Blondeau, Reference Sankoff and Blondeau2007). Other studies reporting the loss of trap-raising in the Inland North, such as Driscoll and Lape (Reference Driscoll and Lape2015), have been apparent-time studies inferring the change in progress from differences between age groups. Why then in Ogdensburg do we see the retreat from trap-raising in spontaneous speech in real time but not in apparent time?
One possibility is that the NCS was relatively new to Ogdensburg even in 2008. In the 2008 data, there is a suggestion of an apparent-time trend toward trap-raising in spontaneous speech, though the details are sketchy because there are only two speakers born before 1960. It may be the case that younger speakers acquired the NCS and then abandoned it via communal change, while older speakers never had advanced trap-raising to begin with. This could result in a situation such that younger speakers’ retreat from trap-raising causes them to match the less-raised trap of their elders, producing a flat-seeming apparent-time profile. If the same change took place in a community in which the NCS was of longer standing, the result would look like the expected apparent-time age trend: Older speakers would have had higher trap to begin with, and, while younger speakers retreat from trap-raising due to stigma, older speakers would maintain raised trap due to lower sensitivity to the increasing stigma.
CONCLUSION
The findings presented in this paper contribute to the growing body of research on the recession of the NCS by addressing two issues that, so far, have remained unanswered in recent NCS research.
The first concern was to add a small city in a remote rural area to the mostly urban set of communities in which recent developments in the NCS have been studied. The findings indicate that trap-raising is on the retreat in Ogdensburg just as it has been found to be in more urban areas. There is evidence (albeit slight) that the change toward lower trap is led by college-educated speakers, while speakers without a college education are more likely to continue to make use of a somewhat raised variant. Since similar findings have been reported for Chicago, Buffalo, and Lansing, it seems that the reversal of trap affects this rural community in much the same ways as urban centers.
The second issue concerns the extent to which negative evaluations of raised trap affect its production. The reversal in the direction of style-shifting suggests that the abandonment of raised trap might be caused by an increasing social stigma that has become attached to raised trap. Unraised trap appears to be treated as the new standard that younger speakers favor in more careful speech. Exactly what caused the negative perception of raised trap in Ogdensburg remains to be investigated. However, it seems plausible that, as in Lansing (Nesbitt, Reference Nesbitt2018), the increased markedness of raised trap is connected to Ogdensburg's economic decline, which started in the 1960s—the same decade in which, in apparent time, we observe unraised trap beginning to become the favored variant in careful production (see Thiel, Reference Thiel2019).
The short real-time span between the data sets discussed in this paper presented an unexpected opportunity to catch a community just at the point of retreating from the NCS. Without the 2008 data, it would not have been clear that Ogdensburg had ever been an NCS community. Our results indicate a role for communal change, or change across the lifespan, in Ogdensburg's retreat from NCS. It is not just the case that younger speakers are generationally moving away from the raised trap of their elders; the very same age cohort whose trap was apparently most raised in 2008, those born in the 1980s, has trap no higher than anyone else in 2016. This allows us to propose that communal change can play a larger role in the transition of a linguistic indicator into a marker than Fruehwald (Reference Fruehwald2017) found in Philadelphia: once a dialect feature rises to the level of consciousness and develops sufficiently strong negative social evaluation, groups who share that evaluation may collectively retreat from the feature. In Ogdensburg, since the NCS was apparently relatively new to the community in the first place, the young cohorts’ retreat from trap raising left them about on par with the older generation, creating the apparent-time illusion that no change was in progress at all.
Appendix A
Density plots of speakers’ normalized spontaneous-speech TRAP F1 measurements, illustrating the degree to which speaker-level means approximate the central tendency of token density. Speakers’ mean F1 is shown with a vertical dotted line. Tokens before sonorants and after glides and stop+obstruent clusters are excluded, following the ANAE methodology for calculating speaker means.
table a1. 2008 Interviews 
table a2. 2016 Interviews 
Appendix B
table b1. The effect of the following consonant (p < 10–4) included in the regression model presented in Table 3