
I. INTRODUCTION
Magnesium resource widely exists in the earth minerals and the seawater; however, it has not been adequately refined and utilized in the rapidly developing industrial society. In the recent decades, there has been the rise of massive research studies about magnesium and its alloy, due to its certain special properties, leading to special applications. Compared with the traditional structural materials such as iron and steel, magnesium alloys have high stiffness/weight ratios, good castability, and high damping capacity. Reference Shreir1 Besides, magnesium and its alloys are non-magnetic and have relatively high thermal and electrical conductivity, good vibration, and shock absorption ability, thus being applied in transport and aerospace and 3C industries.
In general, magnesium alloys are divided into two major alloying systems: alloys containing 2–10% aluminum with minor addition of zinc and manganese (i.e., AZ and AM series) and alloys containing zirconium and various elements such as rare earth elements (REE), zinc, thorium, and silver without aluminum. Reference Wilson, Claus, Earlam, Hillis, Wilson, Claus, Earlam and Hillis2 Therein, the rare earth magnesium alloys are distinguished for their high specific strength and good creep resistance due to precipitation hardening, which are promising for aerospace applications. Reference Rokhlin3 Ding et al. Reference Ding, Li, Wang and Li4–Reference Zheng, Dong, Yin, Liu, Wang, Jin and Ding10 have carried out considerable research studies about Mg–Gd–Y–Zr and Mg–Nd–Zn–Zr alloys.
The quintuple Mg–Gd–Y–Zn–Zr alloys (GWZK) were distinguished for their excellent mechanical properties. Reference Honma, Ohkubo, Kamado and Hono11–Reference Zhang, Yuan, Lu and Ding20 With the addition of Zn, there could exist different kinds of long period stacking ordered (LPSO) structures and metastable phases in different heat treatment conditions, exhibiting different shapes, sizes, and distributions. Furthermore, the interactions between the LPSO structures and metastable β′ phase significantly improve the yield stress and the elongation. Reference Li, Zhu, Qiu, Yin, Rong and Zhang21 In the solution-anneal condition, the eutectic phase β-Mg24(GdYZn)5 in the grain boundary dissolves and 14H-LPSO structures form and grow. Reference Yin, Wang, Gao, Chen and Zheng22 In the aging stage, the LPSO structures nearly had no change, but the different metastable phase forms and transforms. The REE precipitation sequences of the GWZK alloys are as follows: ∝′ − Mg(S.S.S.S) → β′(cbco) → β1(fcc) → β(bcc). Reference Zhang, Liu, Gu, Lu, Yuan and Ding23–Reference Zheng, Li, Tan, Xu, Luo and Chen26 Before the peak-aged condition, the β′ phase precipitates and grows to be elliptical about 10–30 nm long and 15 nm wide. After the peak-aged stage, β′ phase becomes coarser in the average size of 100 nm, and accordingly the diamond β1 phase can precipitate. Reference Li, Zhu, Qiu, Yin, Rong and Zhang21,Reference Zhang, Liu, Gu, Lu, Yuan and Ding23 Therein, the 3-D network interconnection of β′ can precipitates and LPSO structures plays a significant role in the microstructure properties. Reference Li, Zhu, Qiu, Yin, Rong and Zhang21,Reference Zheng and Chen24 By means of reasonably adjusting the heat treatment and processing chains, sizes and distributions the of LPSO structures and REE precipitates could be well controlled. Especially when the dislocation and twin-crystal are introduced during deformation, the mechanical properties are improved to a large extent.
However, the drawback mostly restricting the adhibition of magnesium alloys is their corrosion resistance. So far, there are respectable corrosion research studies of magnesium and its alloys, several different corrosion mechanisms being established. Song and Atrens Reference Atrens27–Reference Song and Atrens33 gave preference to the unipositive Mg+ theory to explain the negative difference effect (NDE) and anode hydrogen evolution. And Birbilis and Williams Reference Thomas, Medhekar, Frankel and Birbilis34–Reference Williams, Dafydd, Mcmurray and Birbilis36 adopted an in situ scanning vibrating electrode technique (SVET) to characterize local current density distributions over anodically polarized Mg surfaces immersed in sodium chloride containing electrolyte, thus insisting on the local cathodic process in hydrogen evolution. Though partial controversies over the magnesium corrosion mechanism about the strange phenomena are still existing, undoubtedly the consensus is the poor corrosion resistance. Since the Pilling–Bedworth (PB) (MgO/Mg) ration is less than 1, not as compact as the aluminum alloys, the oxidation film could not protect the alloy from being further attacked. Reference Dong37,Reference Sachdeva38 Though at present many surface modification techniques are attempted, such as anodizing, ion implantation, laser direct melting, and plasma electrolysis, but once the protective surface is broken through in the defects, it would be still a tragedy. Therefore, it is very imperative to improve the integral corrosion resistance of alloys.
Similarly, even though GWZK alloys have remarkable mechanical properties, to think about putting into engineering use, it is greatly essential to investigate their corrosion behaviors. By far, there have been some research studies about the effect of the eutectic phase and β′ precipitates on corrosion behaviors of GWK alloys without LPSO structures Reference Wang, Wu, Wang, Huang and Ding7,Reference Chang, Guo, He, Fu, Peng and Ding39–Reference Zhang, Liu, Shao, Meng and Wang43 and relatively small amount of studies about the roles of LPSO structures playing in the corrosion resistance of GWZK or Mg–REE–Zn. Reference Zhang, Xu, Cheng, Chen and Kang44–Reference Zhang, Wu, Xue, Wang and Yang47 Nearly most studies reported that, with the second phase precipitating, the corrosion resistance would be worse, but when the continuous network second phase forms in the grain boundaries, especially in the refined grain boundaries, acting as corrosion penetration barriers, corrosion properties would be better, which could be promising materials. Accounting for the impurity of alloy materials in different studies, the discrepant measurements and calculations are not very reliable, especially in the electrochemical means. As to the influence of interactions between the β′ precipitates and LPSO structures on corrosion behaviors, there have been nearly few reports.
In this paper, the Mg–10Gd–5Y–2Zn–0.5Zr (wt%) alloy (GWZ1052K) in different aging stages was chosen, and the purpose was to investigate the influence of the above-mentioned phase interactions on corrosion behaviors. The immersion tests and electrochemical measurements were conducted in 3.5 wt% NaCl aqueous solution at ambient temperature. In addition, scanning electron microscopy (SEM) and transmission electron microscopy (TEM) were adopted to further investigate the corrosion behaviors and explore the corrosion mechanism of GWZK alloys.
II. EXPERIMENTAL
A. Specimen preparation
The GWZK alloy used in this research was prepared from high purity Mg, Mg–20Gd, Mg–30Y, Mg–30Zr master alloys (wt%), and pure zinc by melting the components in an electrical resistance furnace under the mixed protection gas of CO2 and SF6 with the ratio of 100:1. The ingot was solution-treated at 500 °C in a sulfur atmosphere for 5 h, immediately followed by quenching in water. The nominal chemical composition was Mg–10Gd–5Y–2Zn–0.5Zr (wt%). The alloy was cut into slices of 10 × 10 × 2 mm by the wire-electrode cutting machine. Then all the slice specimens were aged in silicon oil at 225 °C for different times. Meanwhile the aged specimens were used for the Vickers hardness (HV) test under the set 49N load and dwelling for 15 s. All the specimens used for the HV test, immersion test, and electrochemical measurement were wet ground through successive grades of silicon carbon abrasive papers from P120 to P2000, followed with diamond finishing to 0.1 μm, ultrasonically cleaning in deionized water and acetone, and drying in the warm flowing air.
B. Corrosion test
The immersion measurements were conducted in this research. To investigate the influence of the phases in different aging periods on corrosion behaviors, several typical comparison groups were chosen: solution-anneal, under-aged, peak-aged and over-aged. And two replicated specimens were measured for each chosen aging stage to avoid the experimental contingency. A piece of 3.5 wt% NaCl aqueous solution for immersion was prepared with analytical reagent (AR) grade NaCl and deionized water. The specimens underwent sandpapering, ultrasonically cleaning, and drying. One square area of 10mm × 10mm was exposed in the solution, and the other areas were smeared with one nylon wire outside for hanging. Each specimen was placed in the beaker containing 200 mL 3.5 wt% NaCl aqueous solution, with a funnel placed over the specimen to collect hydrogen, and the upended graduate cylinder to measure the volumes of hydrogen using the drainage method. The immersion test was conducted at ambient temperature about 25 ± 2 °C. And in this process, the corrosion rate could be calculated by hydrogen evolution. Reference Hryn48
C. Corrosion analysis and characterization
The corroded surface morphology of alloys was observed by visual inspection and photographed by the camera. Then the corroded surfaces and the cross section morphologys with corrosion products were investigated by means of field emission scanning electron microscope (FE-SEM) Versa 3D Dual Beam (FEI, Hillsboro, Oregon), equipped with Bruker XFlash 6I60 energy spectrum detectors (Bruker Nano GmbH, Berlin, Germany). And after removal of corrosion products through the way of immersing the corroded specimens into a mixed solution of 200 g/L CrO3 + 10 g/L AgNO3 at the temperature of 80 °C for 5 min, followed with ultrasonically cleaning in deionized water and acetone and drying in the warm flowing air, FE-SEM was again utilized to observe the morphology. The microstructure of the GWZ1052K alloy was characterized by atomic scale high angle annular dark field-scanning transmission electron microscopy (HAADF-STEM). Specimens for STEM were prepared by grinding to produce a foil of 50 μm thickness, followed by twin-jet electropolishing and then further modified by ion milling.
D. Electrochemical measurements
Open circuit potential (E oc), potentiodynamic polarization curves, and electrochemical impedance spectroscopy (EIS) of specimens were measured in 3.5% NaCl aqueous solution at ambient temperature (25 ± 2 °C), using the Ivium Compactstat.e mobile electrochemistry system (Ivium Technologies B. V., Eindhoven, the Netherlands). In this study, all the electrochemical measurements were conducted in a three-electrode electrochemical cell, with a saturated calomel electrode (SCE; 0.241 V versus the standard hydrogen electrode) as the reference electrode (RE) and a platinum electrode as the counter electrode (CE). The working electrode (WE) was the specimen with the exposure area of 10 × 10 mm. E oc measurements were carried out after the specimen was immersed into the solution for 300 s and were made prior to EIS and polarization curves to ensure the stability of the corrosion potential. Besides, E oc was recorded for 10 min to observe and obtain the stable value. In this process, E oc measurements were conducted between the RE and the WE without current being transferred to the counter electrode. EIS was measured immediately after the E oc test was over and was recorded at E oc in the frequency range from 100 KHz to 10 mHz, with a single-sine signal perturbation of 10 mV and 148 measured points. The current range was 10 mA, and the acquisition period was 2.0 s. The polarization curves started from the potential of −2.0 V and stopped at −1.0 V. The scanning rate was 10 mV/s, and the E-step was 10 mV. Each EIS measurement and polarization curve were repeated twice to ensure the validity of the electrochemical measurements.
III. RESULTS AND DISCUSSION
A. Age hardening behavior and microstructure
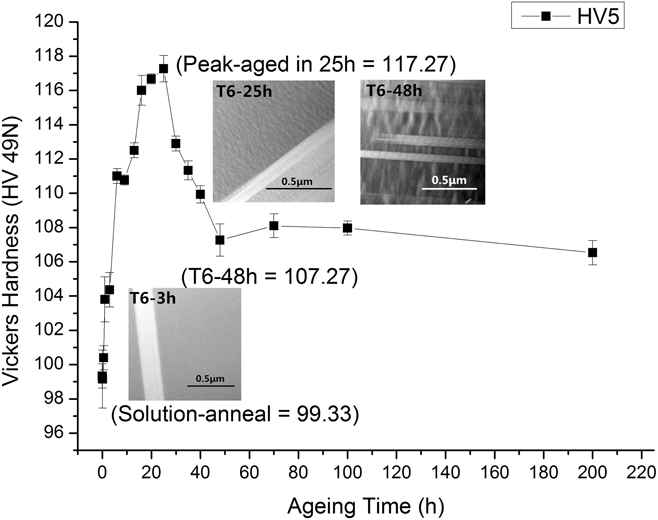
The hardness curve for the GWZ1052K alloy aged at 225 °C was shown in Fig. 1. HV of the solution-anneal was 99.33 (HV5). When it came to the peak-aged stage at 25 h, the hardness value climbed to the summit at 117.27 (HV5), due to strengthening of precipitates. And after that, the value declined quickly to 107.27 (HV5) at 48 h. In this period, the decreasing hardness could be attributed to the growth of the REE precipitates and/or the transformation of phases. Moreover, the hardness value had no distinct change after T6-48 h, and the HV was 106.53 (HV5) at T6-200 h. In this research, the main purpose was to investigate the influence of phase interactions on corrosion behaviors of the GWZ1052K alloy. For this, those typical aging periods solution-anneal, under-aged (T6-3 h and T6-13 h), peak-aged (T6-25 h), and over-aged (T6-48 h and T6-200 h) were determined according to the hardness curve in Fig. 1.
Aging hardness curve at 225 °C for the GWZ1052K alloy (including STEM images for the typical aging conditions).

Meanwhile STEM images of GWZ1052K alloys in several typical aging conditions were presented in Fig. 1 to investigate the transformation of phases and further the influence of microstructure evolution on the properties. The STEM image for the T6-3 h sample showed the typical under-aged microstructure: the LPSO structures were found in the ∝-Mg matrix and other second phases could not be clearly discovered in the grain. In the T6-25 h sample of the peak-aged condition, another fine second phase could be found along the LPSO structures in the grain, which was a certain elliptical particle in the size of about 50–100 nm long and exhibited certain orientation relationship with the LPSO structures. Referring to the previous studies, Reference Zhang, Yuan, Lu and Ding20–Reference Yin, Wang, Gao, Chen and Zheng22,Reference Zheng and Chen24 the elliptical particles were the β′ phase, and when the β′ phase grew to be of certain size, they could interact with the neighboring LPSO structures and grow along the [0001]Mg direction, eventually forming a 3-D network with the LPSO structures in the alloy. In T6-48 h condition, we could find much coarser β′ precipitates about 200–500 nm long, which had occupied the spaces among the lamellar LPSO structures and the sparse and coarse β′ phase broke through the edges of the LPSO structures. With the β′ phase growing and evolving among the nearly unchanged LPSO structures, the mechanical properties were affected, which could be confirmed by the peak hardness in the T6-25 h condition and sharply decreasing the hardness value in the T6-48 h stage. And corrosion behaviors of the alloy would be certainly affected by the LPSO structures and growing β′ phase in the different aging stages to some extent. The subsequent corrosion tests and electrochemical measurements were carried out to investigate the influence of phase interactions on corrosion behaviors.
B. Corrosion test
1. Hydrogen evolution
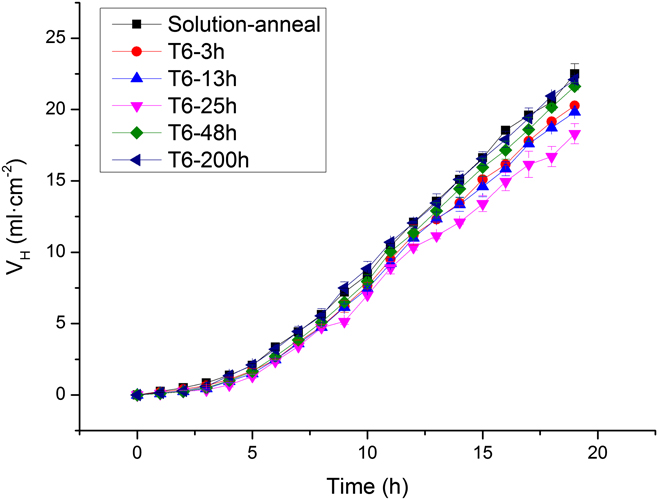
The immersion test in this research was conducted in 3.5 wt% NaCl aqueous solution at ambient temperature (25 ± 2 °C). The original target was to immerse all the comparison groups in the solution for 5 days to obtain long-term and stable corrosion data, consequently proving to be not ideal. Through the hourly regular observation of immersion, in the first 5 h, the corrosion behavior was moderate to collect hydrogen in the draining method. Then in the later 10 h, hydrogen evolution was fiercer. It was clear to find that the continuous and small bubbles formed on the surface of specimen rose through the funnel to the measuring cylinder. And in this period, the evolution was fairly stable, which could be certified in Fig. 2. After immersion in the aggressive NaCl solution for one day, the evolution was nearly out of control. The hydrogen evolution was very fast, and the heavy black corroded products covered the specimens. And furthermore, it could be seen that the corrosion products broke away from the alloy surface and dropped to the bottom of the beaker. With the immersion proceeding, the exfoliated corrosion products stacked more and more heavily until the specimens were completely dissolved and divorced. To analyze the reliable data, we repeated it several times and drew the hydrogen evolution curves of immersion for 19 h in Fig. 2. In this graph, the evolution data were in accord with the aforementioned phenomena. At first, the evolution was slow and after 4–5 h, it began to quickly climb and approximately tended to be stable. And it could be found that the hydrogen evolution curve in the peak-aged stage (T6-25 h) was below all the others, which indicated the lowest evolution rate and the best corrosion resistance. Meanwhile the overall tendency of the corrosion resistance was as follows: solution-anneal < under-aged < peak-aged > over-aged.
Hydrogen evolution curves for GWZ1052K alloys immersed in 3.5 wt% NaCl aqueous solution for 19 h.
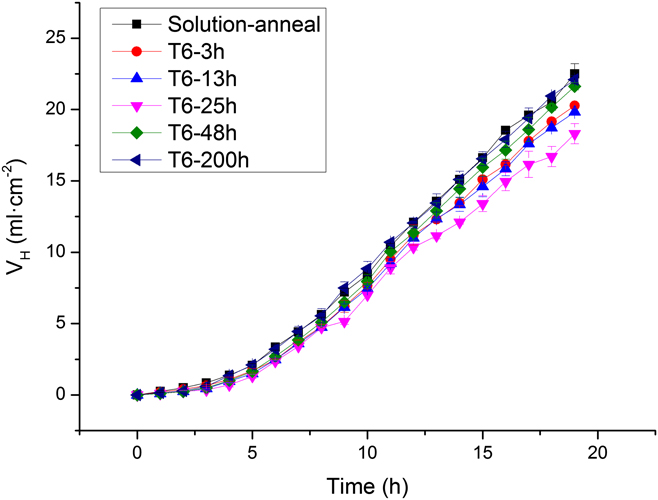
According to the hydrogen evolution data, the corrosion rate (CRH) could be calculated using the following equation Reference Cao, Shi, Hofstetter, Uggowitzer, Song, Liu and Atrens49–Reference Shi and Atrens51 :
 $${\rm{C}}{{\rm{R}}_{\rm{H}}} = 2.088{V_{\rm{H}}}\quad ,$$
where CRH unit is mm/y and V H is the hydrogen evolution rate [mL/(cm2/d)].
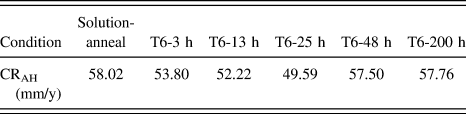
The average corrosion rate (CRAH) calculated by total hydrogen evolution was listed in Table I. From the table, it was not difficult to find the tendency: the peak-aged specimen had the best corrosion resistance, and the closer to the peak-aged stage the treatment was, the better the corrosion resistance was. The solution-anneal one has the fastest corrosion rate about 58.02 mm/y and was nearly equal to the long-time over-aged specimen (T6-200 h), both being the worst corrosion resistance groups.
The average corrosion rate calculated by total hydrogen evolution.

2. Corroded surface characterization and energy spectrum analysis
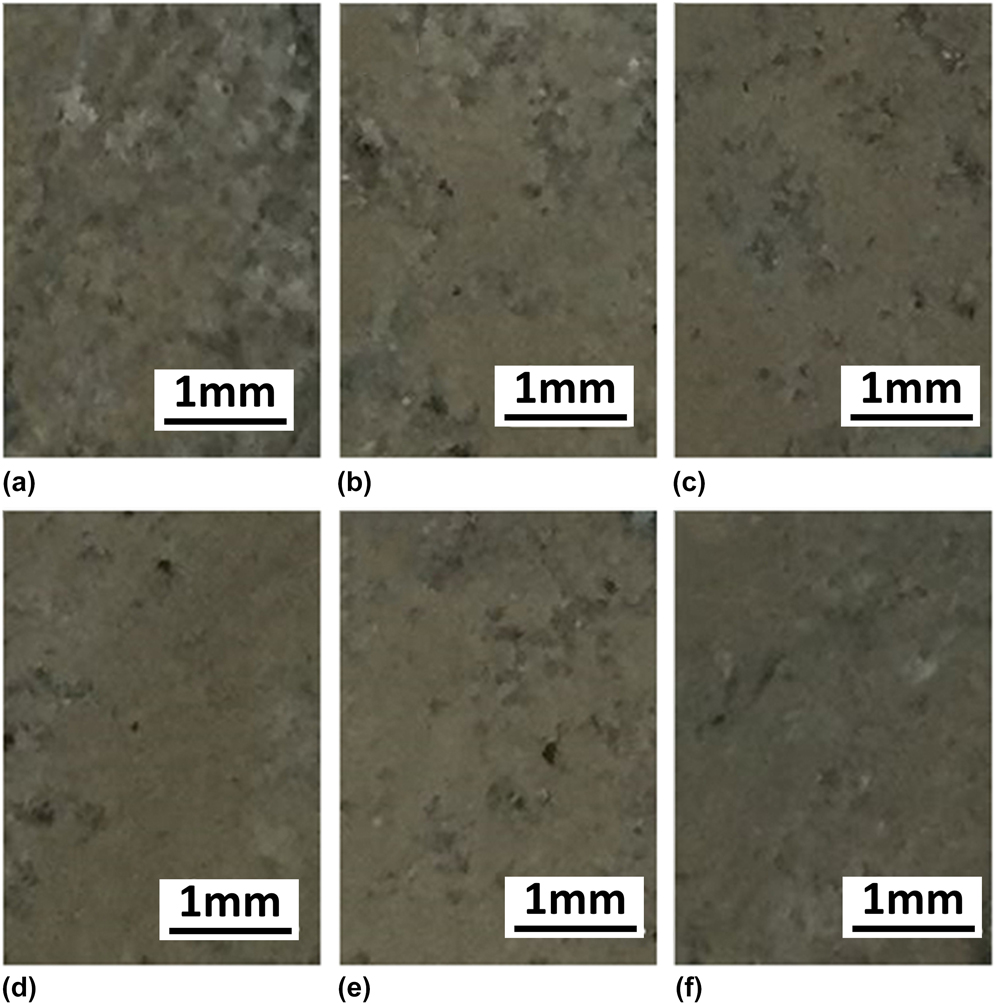
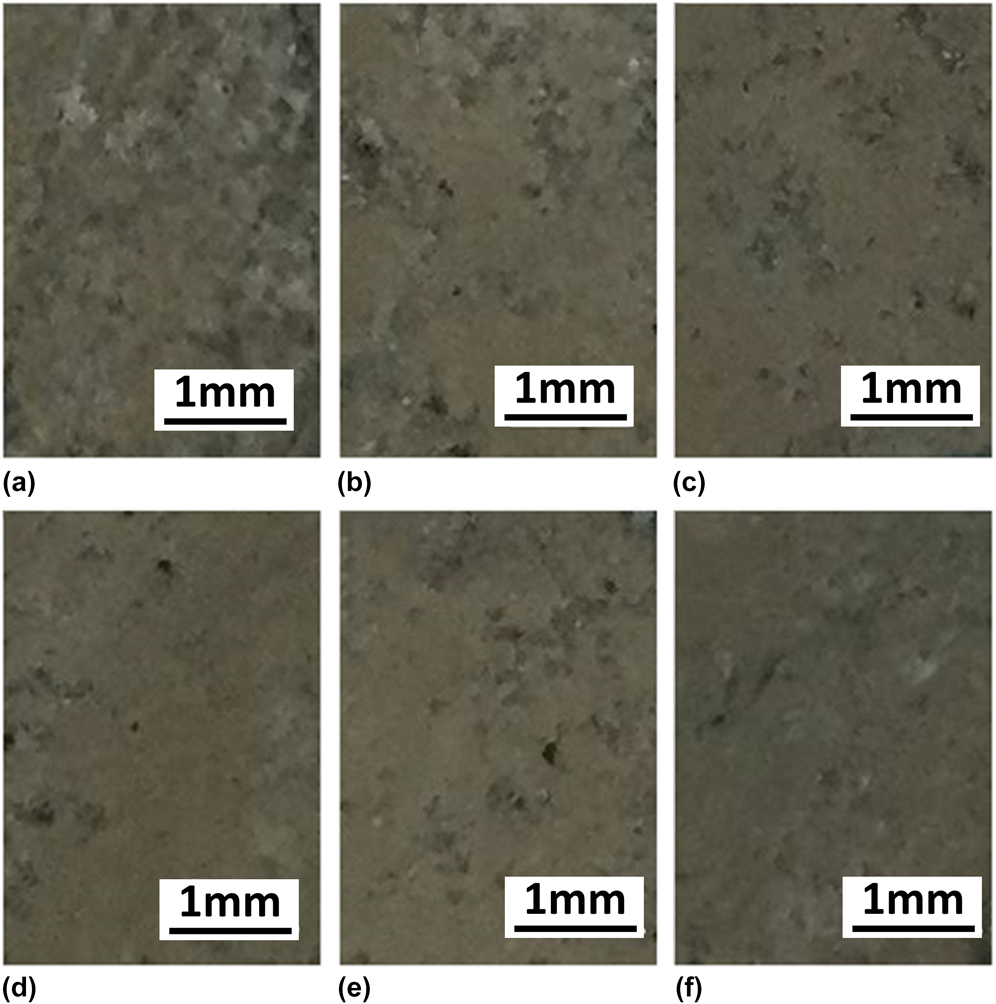
In consideration of the heavily eroded surfaces for all the samples after long-term immersion as described previously, it was hard to distinguish and evaluate the corrosion. Therefore the corroded surface photographs of GWZ1052K alloys after immersion in 3.5 wt% NaCl solution for 30 min were taken and shown in Fig. 3. From those we could find that the solution-anneal specimen was covered with white and gray corrosion products, small parts of the alloy matrix surface being exposed. The corrosion surface did not become much better until the peak-aged stage, and on the surface of alloy in the peak-aged stage, the large intact areas could be found. Still there were few white corroded areas and gray corrosion pits. After the peak-aged stage, the condition was inversed to be worse, the heavier corrosion products being found.
Corroded surface photographs of GWZ1052K alloys after immersion in 3.5 wt% NaCl solution for 30 min: (a) solution-anneal, (b) T6-3 h, (c) T6-13 h, (d) T6-25 h, (e) T6-48 h, and (f) T6-200 h.
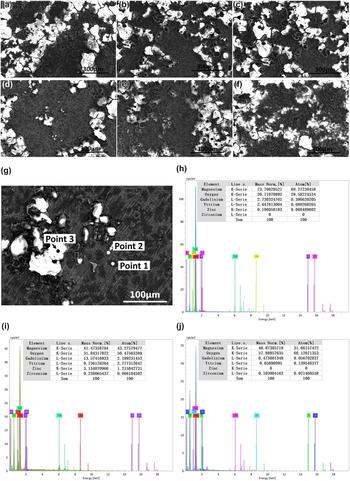
After immersion in 3.5% NaCl solution for 1 h, the FE-SEM images of the corrosion surfaces of GWZ1052K alloys in different aging stages were shown in Fig. 4. From Fig. 4(a), we could find that the solution-anneal specimen was covered with heavy black corrosion products with some cracks on the dry corrosion films and bright white particles were dispersively distributed on the surface. With the aging stage advancing, the black corrosion areas were clear, in which some gray net compositions were visible. However, the dispersively distributed corrosion particles on the surface did not show the clear change until the peak-aged stage. For the white particles, when they fell off, the left holes could be discovered, this phenomenon being clearly found in Figs. 4(b) and 4(c). In Fig. 4(d), the surface of the peak-aged specimen was much neater, on which there were less bright white particles and larger black areas with more visible gray net areas. After the peak-aged period, especially in the T6-200 h condition [Fig. 4(f)], the surfaces of specimen were again crawled with heavier corrosion products, which consisted of the bright white particles and the smaller black areas with numerous tiny black corrosion particles, the gray network products being no more clear. The whole phenomena showed the similar tendency of corrosion resistance to the hydrogen evolution and the peak-aged specimen had the best corrosion resistance.
FE-SEM images of the corroded surfaces of GWZ1052K alloys in different aging stages after immersion in 3.5 wt% NaCl solution for 1 h and EDS analysis of the peak-aged specimen after immersion for 1 h: panels (a)–(f) correspond to the solution-anneal, T6-3 h, T6-13 h, T6-25 h, T6-48 h, and T6-200 h specimens, respectively, and panels (h)–(j) correspond to EDS maps of point 1, point 2, and point 3 in (g).

To further investigate the effects of corrosion media on the surface of alloys, the peak-aged specimen after immersion in 3.5% NaCl solution for 1 h was chosen for energy spectrum analysis, shown in Figs. 4(g)–4(j). By contrast, the point 2 in the gray network area of Fig. 4(g) exhibited lower content of Mg element but higher rare earth contents than the point 1 in the bright white area. And combined with the size of the black area about 20–30 μm diameter, those could be the ∝-Mg phase containing lower contents of REEs. The gray network compositions were the eutectic phases, and besides, the LPSO structures and some β′ precipitates could also be included. And it was strange to find the more oxygen content in the gray network areas, which could be explained that the REE compositions had more absorption of oxygen than the matrix phase. Compared with the formers, the bright white particles had the most oxygen content and few zirconium content, no distinct zirconium signal being collected in the ∝-Mg matrix. Therefore, the black protuberant particles could be some rich-zirconium composition in the alloy matrix, which was severely oxidized and fell off, with some holes left on the surface.
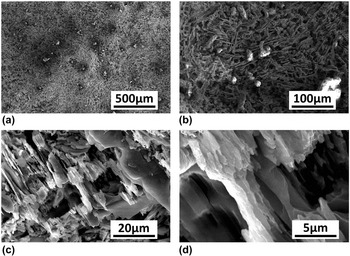
After immersion in 3.5% NaCl solution for 10 h and removal of corrosion products, the corroded surface of the peak-aged specimen was observed by FE-SEM, different magnification images being shown in Fig. 5. In Fig. 5(b), numerous differently oriented lamellas were discovered, and there were several layers in the identical orientation, which could be the LPSO structures. And meanwhile, some small particles were inset in the lamellar structures, which could be the remaining REE particles. In Figs. 5(c) and 5(d), we could find the more distinct structures of the lamellas. The differently oriented lamellas exhibited the 3-D network structures, and for each single lamella, actually the dumbbell-like plate, those existed different corrosion degrees. There were many planners on the thinner middle part, which seemed to be cut away. And the two ends were thicker, with many fracture edges left. From Fig. 5(d), it was obvious to see the fracture and dissolution occurred in the thinner middle part preferentially. Furthermore, all those could indicate the good corrosion resistance of REE phases. And with the dissolution of ∝-Mg, the insetting β′ precipitates fell off. Especially for the LPSO structures, they were the last remains including few small REE precipitates and more for the continuous and dense network structures and they could act as the abscission obstacles.
FE-SEM images of the corroded surface for the peak-aged specimen after immersion in 3.5 wt% NaCl solution for 10 h and removal of the corrosion products: panels (a)–(d) correspond to the different magnifications for the identical sample.

3. Cross section morphology
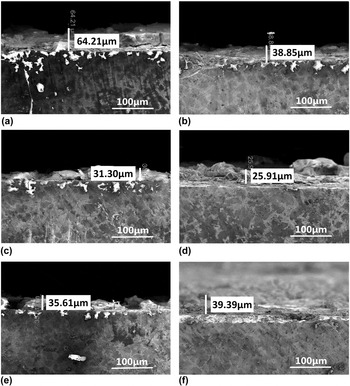
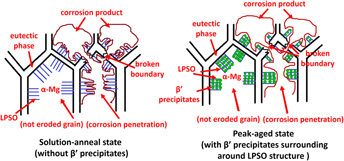
After observation of corroded surfaces, the cross section morphology was observed as shown in Fig. 6. From the figure, it was very clear to find distinct differences in the depth of corrosion films, from solution-anneal to T6-200 h, which were 64.21 μm, 38.35 μm, 31.30 μm, 25.91 μm, 35.61 μm, and 39.39 μm, respectively. Therefore in view of the corrosion depth of the cross section, we could easily identify the best corrosion resistance of the peak-aged specimen. And further to observe the corrosion films from cross section, we could find the cracked films, and in the interface between corrosion products and the alloy matrix, there existed loose gaps and cracks. In Fig. 6(a), we could find the bright white erose particles were inset in the alloy, and there were the corrosion ditches between the particles and the gray network structures, which could be the interphase corrosion. The gray network compositions were the eutectic phase with certain amounts of LPSO structures in the edges. Reference Zhang, Yuan, Lu and Ding20,Reference Li, Zhu, Qiu, Yin, Rong and Zhang21 And it was stranger to find the corrosion ditches that acted as the channels for the corrosion medium to permeate into the next grain, so the white erose particles far to the corrosion surface could be found. In Fig. 6(c), we could discover the zigzag corrosion ditches in the phase boundaries. Referring to Fig. 4, it was not hard to confirm that the gray phase with the zigzag boundary were the LPSO structures. And we could find that the corrosion originated from the phase boundary due to the different corrosion potential, and in general the second phase has more positive corrosion potential thus acting as the cathode in the interface. Following this, the black area of ∝-Mg corroded and dissolved at first due to the more negative corrosion potential, and some small REE precipitates like β′ phases would fall off, and at last, the network LPSO structures were left behind until they dissolved or fell off without enough sustaining as well. And in Fig. 6(d), there were few inset corrosion particles in the peak-aged specimen, and on the corrosion surface, we could find the thin corrosion films with some big protuberant particles. After the peak-aged stage, the inset bright particles increased. In Fig. 6(f), we did not find the inset particles as well, but corrosion films were uniform and heavy. The phenomena could be explained that the LPSO structures had more positive corrosion potential to promote the corrosion in the interface between the LPSO structures and ∝-Mg matrix, and the main REE precipitate β′ phases were not big and not enough to surround the LPSO structures and hinder the contact of LPSO structures and ∝-Mg phases until the peak-aged stage is reached, which made the corrosion resistance better. After that, in the over-aged stage, the overlarge second phases did not surround LPSO compactly well like before, which worsens the corrosion resistance.
SEM observation of cross section of GWZ1052K alloys in different aging stages after immersion in 3.5 wt% NaCl solution for 1 h: (a) solution-anneal, (b) T6-3 h, (c) T6-13 h, (d) T6-25 h, (e) T6-48 h, and (f) T6-200 h.

C. Electrochemical behavior
1. Open circuit potential
Open circuit potential (E oc) experiments were conducted in 3.5 wt% NaCl aqueous solution. E oc values from solution-anneal to T6-200 h were −1.620 V, −1.616 V, −1.613 V, −1.610 V, −1.614 V, and −1.620 V, respectively. We could find the small difference among all the comparison groups despite all about −1.6 V (versus SCE), which was the lower value compared with other metals. The E oc value in the peak-aged stage was the most positive, which indicated the best corrosion resistance in the peak-aged stage, and the farther to the peak-aged stage the aging treatment was, the more negative the E oc was, which was consistent with the tendency in the above experiments.
2. Potentiodynamic polarization curves
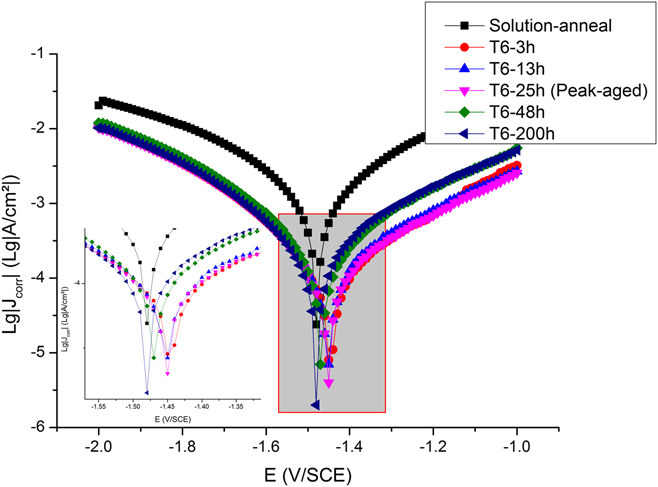
Figure 7 showed the potentiodynamic polarization curves for the specimens after EIS measurements in 3.5% NaCl aqueous solution. In general, the anode polarization branch represented the anode dissolution in the solution and the cathodic polarization branch represented the cathodic hydrogen evolution via water. From Fig. 7, we could find that the polarization curve of the solution-anneal condition was on the top, in which both anode branch and cathodic branch were much higher than the others. However as to the others, the cathode branches were nearly coincident, which indicated no clear effects on influencing cathodic kinetics. The anode branches were divided into two distinct groups, of which the specimens in the under-aged and peak-aged stages had lower anode current density, and the specimens in over-aged stages had the higher anode current density and the curves in the over-aged stage lay between those in the solution and under-aged stages. Furthermore, it could be still found that the peak-aged specimen had the lowest anode current density, thus exhibiting the best corrosion resistance. And from the whole curve in each group, the passivation current (I pa) and the break-down potential (E bk) could not be distinguished and determined clearly. In the polarization measurements of the anode branch, we found the apparent fall-off of corrosion products, the drastic hydrogen evolution exacerbating this process. Therefore, the corrosion film had little protection for the alloy in the drastic corrosion course.
Polarization curves for GWZ1052K alloys in 3.5 wt% NaCl aqueous solution.

According to the cathodic branch of polarization curve, the corrosion current density, J corr (mA/cm2), could be estimated by the Tafel extrapolation method. And further, the corrosion rate (CR i , mm/y) could be calculated by J corr according to ASTM G102-89 (2015). The equation was as follows:
 $${\rm{C}}{{\rm{R}}_i} = 25.99{J_{{\rm{corr}}}}\quad .$$
In addition, the polarization resistance (R p, kΩ) could be calculated by the following equation:
 $${R_{\rm{p}}} = {{{\beta _{\rm{a}}}{\beta _{\rm{c}}}} \over {2.3\left( {{\beta _{\rm{a}}} + {\beta _{\rm{c}}}} \right){J_{{\rm{corr}}}}}}\quad ,$$
where βa and βc are, respectively, the slopes of Tafel regions of the logarithmic anodic and cathodic polarization curves and J corr is the corrosion current density as aforementioned.
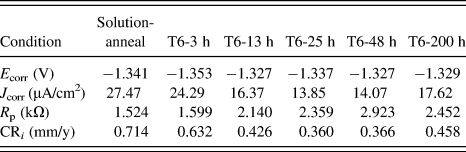
Whereas the electrochemical workstation in this study had the module used for the corrosion analysis and the modules had adopted the identical theoretical formulas to calculate, it was very convenient to automatically calculate the corresponding corrosion current density (J corr), polarization resistance (R p), and corrosion rate (CR i ) according to the chosen Tafel regions. The calculated values of polarization curves were presented in Table II. From the table, we could find that the more positive corrosion potential (E corr) and the lowest corrosion current density (J corr) were in the peak-aged stage, which indicated the best corrosion resistance. And the calculated polarization resistance had small fluctuations: the values in the over-aged stage were even the maximum. But according to the CR i values, it was still clear to distinguish the lowest corrosion rate out in the peak-aged stage. Furthermore, comparing the CR i values with the corresponding CRAH values, we could find that the former was much lower than the latter. And according to ASTM G102-89 (2015), all the sets of corrosion calculations based on Faraday’s law were on the assumption of the uniform corrosion, nonuniform corrosion certainly resulting in a substantial underestimation of true values. Accounting for much fall-off of corrosion products (especially for the REE compositions, such as β′ precipitates), which caused no more uniform corrosion penetration, we could find that the corrosion rate values were not very reliable to estimate the corrosion behaviors for this magnesium alloy of poor corrosion resistance. In several times of polarization measurements, it was hard for us to choose the appropriate curve because of the curve drifting in the long time tests. That suggested that the composition of corrosion films changed very quickly in several times of tests, which indicated that it was not accurate to evaluate the corrosion behavior by adopting the CR i value at some moment.
The values of corrosion rate analysis in the polarization curves.

3. Electrochemical impedance spectroscopy measurements and equivalent circuit
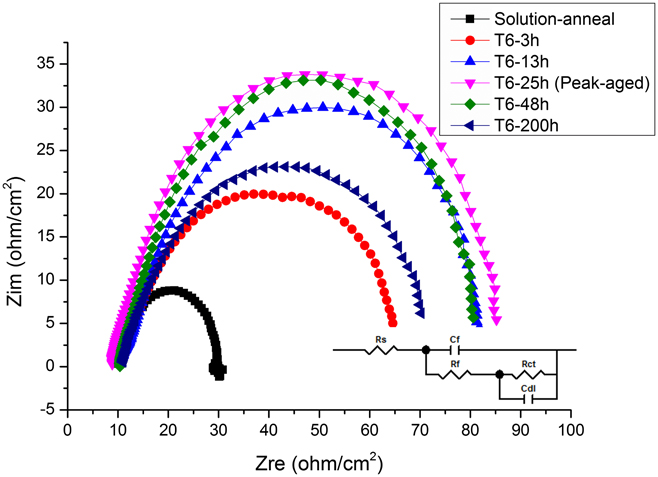
The measured EIS Nyquist plots in different aging stages at the value of E oc were presented in Fig. 8. Comparing the plots with each other, we could find that the curves exhibited the two distinct capacitive loops with the high frequency (HF) section and medium frequency (MF) section, whereas the low frequency (LF) inductive loop did not occur clearly. Referring to the previous studies, Reference Chang, Guo, He, Fu, Peng and Ding39,Reference Baril, Blanc, Keddam and PéBèRe52–Reference Tong, Zhang, Jiang, Zhang, Meng, Cheng and Zhang55 the HF loop appeared to be both the charge transfer process and the formation of the corrosion film. The MF capacitive loop was ascribed to the relaxation of mass transport in the solid phase and disappearance at long immersion times. And the pit formation leaded to the low frequency inductive loop in the impedance spectra. The disappearance of the LF inductive loop could be supported by the evidence in Figs. 4 and 6, in which few pit areas could be found and the corrosion tended to be the uniform corrosion due to the corrosion spread obstacles of the continuous and network second phases, which was beneficial to the corrosion resistance. According to Fig. 8, we could clearly distinguish the distinct discrepancies of the corrosion resistance in different aging stages. The radius of the semicircular Nyquist plot in the solution-anneal condition was the least, which indicated the worst corrosion resistance. And the radius in the peak-aged stage had the maximum, indicating the best corrosion resistance.
Compared Nyquist plots for GWZ1052K alloys in different aging stages after E oc measurement in 3.5 wt% NaCl aqueous solution with the additional equivalent circuit model.

Based on the morphology of the corrosion products and the measured Nyquist plots, an equivalent circuit was proposed to analyze the experimental data of EIS for GWZ1052K, presented in Fig. 8. R s was the solution resistance, which usually ranged from 1 to 100 Ω, thus generally being ignored for its small value. R f and R ct were the resistance of corrosion film and the charge transfer resistance for corrosion of the electrode surface, respectively. C dl was the capacitance at the electrolyte–metal interface. To simulate the equivalent circuit, the capacitance was generally mathematically modeled as one constant phase element (CPE). And there existed the equation defining the impedance,
 $$Z\left( {j\omega } \right) = {\left( {{Y_0}} \right)^{ - 1}}j{\omega ^{ - n}}\quad ,$$
where Y 0 is the constant, j is the imaginary unit, ω is the angular frequency (ω = 2πf, f is the frequency), and n could range from −1 to 1. When n = 1, Z represents an ideal capacitance; when n = 0, Z represents an resistance; when n = −1, Z represents an inductance; and when n = 0.5, Z represents a Warburg impedance.
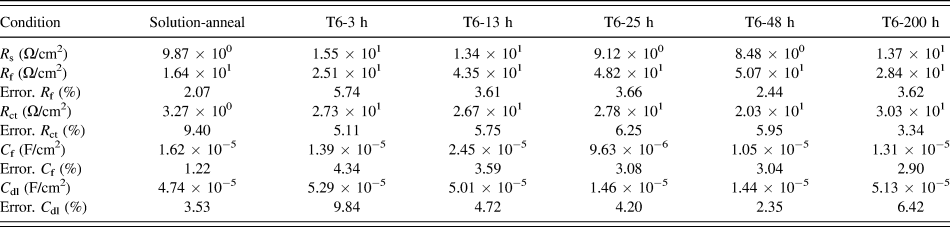
In this study, the equivalent circuit fitting module in the electrochemical workstation was adopted. And to simplify the simulation, the CPE in the equivalent circuit module of our workstation was treated as the ideal capacitance element C f, representing the uniform corrosion film. And the detailed fitted values of each element were listed in Table III. From the table, we could find the nearly highest R f value and the lowest C f value in the peak-aged stage, which indicated that the corrosion film in the peak-aged stage had the nearly highest corrosion resistance. When observing the corrosion film morphology in Figs. 5 and 6, we could find the more compact and thinner corrosion film in the peak-aged stage than the others, which could contribute to the above-mentioned difference in the element values. But when it came to the R ct value, which could be used to evaluate the corrosion resistance of the alloy directly, we did not find the distinct changing law due to the fluctuations in the values. As a whole, the results of the electrochemical measurements were consistent with the immersion tests and the corroded surface morphology, though existing fluctuant values to a certain extent, especially for the EIS measurements, which were easily disturbed by the external signals. And for the identical EIS, there were not only one circuit to satisfy the analysis, and for the identical circuit, adopting the different values of elements, the totally different types of EIS could be obtained. Therefore, it was not very accurate to speculate the polarization dynamics mechanisms by the equivalent circuit of EIS.
The fitted values of the circuit elements in the equivalent circuit.

IV. CONCLUSIONS
-
(1) For GWZ1052K alloys, the broken LPSO structures were detrimental to the corrosion resistance, but when they are continuous network, the circumstance could be a little better. And the fine and uniformly distributed β′ phases surrounding the LPSO structures could improve the corrosion resistance of alloys.
-
(2) The corrosion morphology of cross section showed that the uniform corrosion is the main corrosion form of GWZ1052K with localized pitting corrosion. And the corrosion permeation is obstructed by the continuously distributed second phases in the grain boundary.
-
(3) The polarization curves show the similar tendency of corrosion resistance to the immersion tests, and the peak-aged alloy exhibits the best corrosion resistance. However, the calculated corrosion rate by polarization curves is much lower than the corresponding calculated corrosion rate by hydrogen evolution. The polarization curves could not well reveal the actual corrosion rate quantitatively when the corrosion resistance is too poor and the second phases severely fall off with the corrosion products.
-
(4) The established equivalent circuit combined with EIS measurements is fitted into each element values corresponding to the different conditions to investigate the corrosion mechanism of GWZ1052K alloys, the results of which are consistent with the immersion tests. And in the peak-aged condition, the fitted corrosion film resistance (R f) is nearly the maximum and the corrosion film capacitance (C f) is the minimum, which have relations with thinner and more compact corrosion films.
ACKNOWLEDGMENTS
This research is supported by open fund of the State Key Laboratory of Refractories and Metallurgy (Grant No. G201702). Thanks to Frontier Research Center for Materials Structure, Shanghai Jiao Tong University, for its supports of JEM-ARM200F Atomic Scale High Angle Annular Dark Field-Scanning Transmission Electron Microscopy (HAADF-STEM) and FEI Versa 3D Dual Beam Field Emission Scanning Electron Microscope (FE-SEM).