





Introduction
Commercial pasture-raised poultry production systems have existed in agriculture for decades (Jeni et al., Reference Jeni, Dittoe, Olson, Lourenco, Seidel, Ricke and Callaway2021) but have gained more attention in recent years due to growing consumer demand for pasture-raised products (Stampa, Schipmann-Schwarze, and Hamm, Reference Stampa, Schipmann-Schwarze and Hamm2020). Consumer studies have shown that access to outdoor space and reduced time in confinement are among the most valued welfare attributes in poultry production, and that consumers are willing to pay premium prices for products from systems that prioritize animal welfare (Spain et al., Reference Spain, Freund, Mohan-Gibbons, Meadow and Beacham2018; Thibault, Pailler, and Freund, Reference Thibault, Pailler and Freund2022). Interest in pasture-raised organic poultry products is particularly pronounced among younger consumers; however, higher prices associated with such products remain the primary factor limiting more widespread adoption (Varziri, Zhao, and Woods, Reference Varziri, Zhao and Woods2024). Low infrastructure entry costs, growing consumer interest, and associated price premiums have encouraged an increasing number of small-scale farmers to adopt these systems (Rothrock et al., Reference Rothrock, Gibson, Micciche and Ricke2019).
Despite these incentives, there are several production and management challenges associated with organic pasture-raised poultry systems. Compared to conventional indoor production, outdoor systems can have increased space requirements and higher labor inputs while exposing birds to more variable environmental conditions (Bist et al., Reference Bist, Bist, Poudel, Subedi, Yang, Paneru, Mani, Wang and Chai2024). Moreover, the breeds traditionally used in pasture-raised systems are often associated with higher feed conversion ratios (Chan, Franks, and Hayek, Reference Chan, Franks and Hayek2022) and slower growth rates (Dal Bosco et al., Reference Dal Bosco, Mattioli, Cartoni Mancinelli, Cotozzolo and Castellini2021). Therefore, successful adoption requires knowledge of pasture management, predator control, and biosecurity practices, which increases management complexity and can limit adoption (Sossidou et al., Reference Sossidou, Dal Bosco, Elson and Fontes2011). Consequently, balancing animal welfare with production efficiency and economic sustainability remains a challenge for organic pasture-based poultry operations (Johnston, Weiler, and Baumann, Reference Johnston, Weiler and Baumann2022).
In the face of these challenges, integrated crop-livestock systems (ICLS) offer a viable alternative framework for pasture-raised poultry production. An ICLS integrates crop and animal components to generate synergistic interactions, such that the combined system provides greater benefits than if its components were managed individually (Sekaran, Kumar, and Luis Gonzalez-Hernandez, Reference Sekaran, Kumar and Luis Gonzalez-Hernandez2021; Bhagat et al., Reference Bhagat, Walia, Sharma, Singh, Singh and Hossain2024; Franzluebbers and Hendrickson, Reference Franzluebbers and Hendrickson2024). By intentionally integrating crops and livestock within the same production system, ICLS aims to improve resource and land use efficiency, while enhancing nutrient cycling and reducing reliance on external inputs (Lemaire et al., Reference Lemaire, Franzluebbers, Carvalho and Dedieu2014).
ICLS are particularly relevant for small-scale organic producers seeking to diversify their farms and income sources while strengthening their farm resilience and sustainability (Hilimire, Reference Hilimire2011; Garrett et al., Reference Garrett, Ryschawy, Bell, Cortner, Ferreira, Garik, Gil, Klerkx, Moraine, Peterson, Dos Reis and Valentim2020). Chickens are a viable livestock component in ICLS, particularly among small-scale organic producers (Bilenky et al., Reference Bilenky, Nair, McDaniel, Shaw, Bobeck and Delate2024; Carey et al., Reference Carey, Dutter, Mbacke, McDaniel and Nair2025). Chicken-based ICLS have shown strong potential in regions such as Southeast Asia, where integrated farming systems—a form of ICLS—are considered among the most viable strategies for small-scale farms and are crucial for regional food security (Bhagat et al., Reference Bhagat, Walia, Sharma, Singh, Singh and Hossain2024; Ramana et al., Reference Ramana, ChP, Karthik, Md, Reddy, Chiranjeevi, Kumar, Chandra, Ravisankar, Bhatt, Gaber and Hossain2025). Moreover, integrating chickens into cropping systems has been shown to provide multiple agronomic and economic benefits, including weed and insect pest control (Clark and Gage, Reference Clark and Gage1996), improved on-farm nutrient cycling and soil fertility, and economic advantages for producers through income diversification, increased marketing opportunities, and price premiums on farm products (Hilimire, Reference Hilimire2012; Garrett et al., Reference Garrett, Ryschawy, Bell, Cortner, Ferreira, Garik, Gil, Klerkx, Moraine, Peterson, Dos Reis and Valentim2020).
The benefits farmers obtain from ICLS come from the interaction among multiple system components. Among these components, the use of cover crops is a key factor influencing the success of an ICLS. Traditionally, cover crops maintain soil cover during periods when land is not being cultivated (Kaspar and Singer, Reference Kaspar, Singer, Hatfield and Sauer2011). However, cover crops provide multiple benefits beyond covering the ground, such as positively influencing key soil chemical, biological, and physical properties (Kaspar and Singer, Reference Kaspar, Singer, Hatfield and Sauer2011; Adetunji et al., Reference Adetunji, Ncube, Mulidzi and Lewu2020). Beyond the soil health benefits, pastures and cover crops within ICLS serve additional functions, including contributing to the closure of on-farm nutrient loops (Soares et al., Reference Soares, Lopes, Conceição, Santos and Oliveira2022) or acting as nutrient sources for grazing livestock (Rakkar and Blanco-Canqui, Reference Rakkar and Blanco-Canqui2018).
In chicken-based ICLS, ‘pasture areas’ provide environmental enrichment that can promote animal welfare (Jurjanz et al., Reference Jurjanz, Germain, Juin and Jondreville2015; Stadig et al., Reference Stadig, Rodenburg, Reubens, Aerts, Duquenne and Tuyttens2016) and may also contribute to animal nutrition by providing micronutrients and other desirable bioactive compounds to a chicken’s diet (Fotou et al., Reference Fotou, Moulasioti, Papadopoulos, Kyriakou, Boti, Moussis, Papadami, Tellis, Patsias, Sarrigeorgiou, Theodoridis, Lymberi, Tsiouris, Tsikaris and Tsoukatos2024). Although chickens in outdoor systems consume forage in meaningful quantities (Rivera-Ferre, Lantinga, and Kwakkel, Reference Rivera-Ferre, Lantinga and Kwakkel2007; Karsten et al., 2010; Almeida et al., 2012; Jurjanz et al., Reference Jurjanz, Germain, Juin and Jondreville2015; Tufarelli et al., Reference Tufarelli, Ragni and Laudadio2018; Thongjued et al., Reference Thongjued, Garcia, Halmos, Pulliam, Gonthier and Dupuis2025), its effects on growth performance and development remain inconsistent.
Dietary fiber, which is abundant in grasses and other plant materials, has been associated with negative effects on poultry growth performance and feed efficiency in some cases (Sadeghi, Toghyani, and Gheisari, Reference Sadeghi, Toghyani and Gheisari2015; Jha and Mishra, Reference Jha and Mishra2021). Conversely, benefits in body weight gain and feed conversion ratio have also been reported (Jiménez-Moreno et al., Reference Jiménez-Moreno, González-Alvarado, González-Sánchez, Lázaro and Mateos2010), along with benefits in gastrointestinal tract development (Röhe and Zentek, Reference Röhe and Zentek2021; Bedford, Svihus, and Cowieson, Reference Bedford, Svihus and Cowieson2024). However, the extent to which forage intake affects growth performance within a chicken-based ICLS remains insufficiently explored.
Chicken engagement with pasture is impacted by several factors, including bird genotype, stocking density, feed availability, and shelter location (Fanatico et al., Reference Fanatico, Pillai, Cavitt, Emmert, Meullenet and Owens2006; Rivera-Ferre, Lantinga, and Kwakkel, Reference Rivera-Ferre, Lantinga and Kwakkel2007). Differences in genotypes and behavioral traits have been shown to affect how chickens use outdoor areas, with slower-growing chickens often exhibiting more interest in pasture use than faster-growing chickens (Dal Bosco et al., Reference Dal Bosco, Mattioli, Cartoni Mancinelli, Cotozzolo and Castellini2021). Management practices can also affect a chicken’s use of pasture. For example, Jurjanz et al. (Reference Jurjanz, Germain, Juin and Jondreville2015) reported that chickens were more interested in interacting with pasture that was in good condition, as at the beginning of the spring, than with highly deteriorated pasture, or that chickens preferred a more diverse outdoor environment over simpler ones (Dal Bosco et al., Reference Dal Bosco, Mugnai, Rosati, Paoletti, Caporali and Castellini2014). Furthermore, management practices such as stocking density and short-term food restrictions have the potential to influence the diversity of organisms that chickens consume (Thongjued et al., Reference Thongjued, Garcia, Halmos, Pulliam, Gonthier and Dupuis2025).
Despite the growing interest in pasture-raised chicken and chicken-based ICLS, limited information is available on how cover crop management influences chicken performance and product quality in pasture-raised operations and organic chicken-based ICLS systems. Moreover, there is a lack of research and guidance on cover crop management for use as forage for chickens (Elkhoraibi et al., Reference Elkhoraibi, Pitesky, Dailey and Niemeier2017), and the influence cover crops may have on growth performance, feed consumption, feed efficiency, and meat quality indicators. Addressing this gap is critical for providing management recommendations for small farmers seeking to integrate pasture-raised chickens into their farms.
Therefore, the objective of this study was to evaluate the effects of cover crop management and chicken integration within an organic ICLS on chicken performance and meat quality across two production seasons. Specifically, it assessed how access to high or low forage affects growth, feed conversion ratio, and carcass and meat quality traits in slow-growing broilers. Through this work we aim to contribute to a deeper understanding of the role of cover crop management in chicken-based ICLS.
Materials and methods
The study was conducted during the 2024 and 2025 growing seasons at the Purdue University Meigs Horticulture Research Farm in Lafayette, Indiana (latitude 40.288, longitude −86.884) on certified organic land. The soil type is a Drummer silty clay loam (fine silty, mixed, superactive, mesic Typic Endoaquolls). The climate is characterized as humid continental with four distinct seasons. The mean annual temperature and precipitation are presented in Table 1. This study was part of a broader project evaluating chicken-based ICLS with an emphasis on soil health, food safety, crop and animal performance, and viability for adoption on small-scale organic farms.
Mean monthly temperature (°C) and total monthly precipitation at the research site

Table 1. Long description
The table consists of seven columns. The first column lists months from January through November, followed by Growing season mean and Season Total (April through November). The next three columns are grouped under Mean temperature (degrees C), subdivided into 22 year average, 2024, and 2025. The final three columns are grouped under Total precipitation (m m), also subdivided into 22 year average, 2024, and 2025.
Key data points include:
* January: Temperatures range from minus 5.1 to minus 2.5 degrees C; precipitation varies from 11.4 to 108.0 m m.
* July: Temperatures range from 23.0 to 25.4 degrees C; precipitation varies from 82.6 to 134.1 m m.
* Growing season mean: Temperatures are 17.0 (average), 18.2 (2024), and 17.5 (2025) degrees C. Mean monthly precipitation for the season is 68.9 (average), 69.2 (2024), and 78.9 (2025) m m.
* Season Total (April through November): Precipitation totals are 551.4 (average), 553.5 (2024), and 631.1 (2025) m m.
Note: Data retrieved from the Purdue University/Indiana State Climate Office after consulting the TPAC (Throckmorton Purdue Ag Center) weather station.
Experimental design
The experiment was arranged in a randomized complete block design with four blocks. The total experimental area measured 62.8 m wide and 36.6 m long and was divided into four blocks to account for spatial variability across the field. Within each block, treatments were randomly assigned and maintained in the same plot across both years. Each plot measured 9.14 m × 12.19 m. The treatments were chicken integration with access to high forage (ICLS-HF) and chicken integration with access to low forage (ICLS-LF). The terms cover crop and forage are used interchangeably throughout this paper, as the cover crops in this experiment served the dual purpose of soil cover and nutritional supplementation for the chickens.
All experiments involving animals were reviewed and approved by the Purdue University Animal Care and Use Committee (protocol #: 0723002408).
Cover crop establishment and determination of available forage
Each year of the study began with cover crop establishment. On 13 March 2024, a cover crop mixture composed of oats (Avena sativa) at a rate of 77.34 kg ha−1, field peas (Pisum sativum) at a rate of 51.56 kg ha−1, and turnips (Brassica rapa) at a rate of 1.12 kg ha−1 was applied to the whole experimental area using a no-till Great Plains drill (Solid Stand, Great Plains, Salina, KS). For 2025, cover crops were seeded on 11 October 2024 with a cover crop mixture composed of cereal rye (Secale cereale) at 80.70 kg ha−1 and peas at a rate of 33.63 kg ha−1. Cover crops grew for 56 days in 2024 and 202 days in 2025 before cover crop management treatments were implemented.
When cover crops (rye and oats) were approximately 45 cm tall, the ICLS-LF plots were mowed using a bush hog mower (Bush Hog 2212, Selma, AL) to a height of about 7 cm, while no modifications were made to the ICLS-HF. Before chickens were integrated, forage availability was determined by sampling cover crop biomass using a 0.3 × 0.3 m square quadrat placed over two seeded rows. Five samples were collected per plot, totaling 20 samples per treatment. All plant material within the quadrat was clipped at the soil level and placed in a forced-air oven to dry at 65°C for 3 days or until constant weight. Plant material was weighed on an analytical balance (Mettler-Toledo, Greifensee, Switzerland) to the nearest 0.01 g. Forage availability was determined based on dry weight of cover crops in kg ha−1. Cover crops were ground to 2 mm and sent to A&L Laboratories (Fort Wayne, Indiana) for determination of acid detergent fiber (ADF), neutral detergent fiber (NDF), and chemical composition including nitrogen, crude protein, phosphorus, potassium, magnesium, calcium, sulfur, sodium, iron, aluminum, manganese, boron, copper, and zinc.
Low forage plots in 2024 were sampled prior to mowing, and therefore direct measurements of post-mowing forage availability were not obtained for that year. Instead, forage availability was approximated for descriptive purposes using the proportional difference observed between the low forage and high forage plots in 2025. Estimated forage availability was used to illustrate the amount of biomass to which the chickens had access.
Chicken integration
In both years, slow-growing broiler breeds of the Red Ranger type were used because their phenotypic characteristics make them better suited to pasture-raised systems than fast-growing strains (Bilenky et al., Reference Bilenky, Nair, McDaniel, Shaw, Bobeck and Delate2024). Freedom Ranger (Freedom Ranger Hatchery, Reinholds, PA) and Red Sasso (Myers Poultry, South Fork, PA) breeds were used in 2024 and 2025, respectively. The change of breed between years was due to chick availability.
One-day-old chickens were transported to the Purdue University Animal Sciences Research and Education Center (ASREC; West Lafayette, IN) for brooding (approximately 5 weeks). During brooding, chickens were provided ad libitum access to water and an organic, non-GMO starter feed and later to a grower non-GMO feed primarily comprised of organic corn (Zea maize) and organic soybeans (Glycine max) (Central Indiana Organics LLC, Lebanon, IN).
After the initial brooding period and application of cover crop treatments (mowing or not mowing), chickens were transported to the Purdue Meigs Horticulture Research Farm (Lafayette, IN) and randomly allocated to one of the poultry integration treatments.
Chickens were housed in floorless moveable chicken coops (one coop per grazing plot) (Carey et al., Reference Carey, Dutter, Mbacke, McDaniel and Nair2025). In the first year of the experiment, there were 50 chickens in ICLS-HF treatment and 49 chickens in the ICLS-LF treatment, with each coop housing between 10 and 12 chickens. In the second year, there were 46 chickens in each treatment (ICLS-HF and ICLS-LF), with each coop housing between 10 and 12 chickens. For added predator protection, the whole experimental area was enclosed with electric poultry netting (10/42/12, Premier 1 Supplies, Washington, Iowa, USA) and supplied with electricity from a solar electric fence charger (Speedrite 6000 UNIGIZER 6.0 Joule Fence Energizer, DATAMARSSA, Lamone, Switzerland) powered by a 100-watt solar panel (Traveler Series™: Voyager Renogy, Ontario, CA) both purchased from (Kencove Inc Earl Park, IN) and deep cycle marine battery. Chickens were integrated into the cover crop area on 8 May 2024 and on 30 April 2025. Chickens remained on the plots for 46 days in 2024 (removed 20 June) and 42 days in 2025 (removed 10 June).
Daily monitoring and feed consumption
Chickens were monitored and moved daily to ensure continuous access to fresh forage throughout the experiment (Fig. 1). During the integration period, chickens received ad libitum access to an organic, non-GMO grower feed (Central Indiana Organics LLC, Lebanon, IN). The guaranteed analysis of the starter and grower feeds used in both years is presented in Supplementary Table S1. During each daily visit, caretakers performed a visual inspection of the flock to confirm bird health and normal behavior. Feed remaining from the previous day was weighed together with the feeder, new feed was added, and the amount added was recorded; these values were used to calculate daily feed consumption per treatment after removing the weight of the feeder. Water containers were emptied, washed, and refilled with fresh water daily.
Schematic representation of chicken coop movement within the plot. Positions and distances are not to scale. Source: Created in BioRender. Cabezas Alvarez (Reference Cabezas Alvarez2026) https://BioRender.com/asi7eg5.

Live weight, feed conversion ratio, and average daily gain
Live weights for each chicken were recorded prior to allocating chickens to their treatment groups and at the end of the experiment prior to processing for all the chickens in the plots. These measurements and recorded feed consumption were later used to calculate pasture feed conversion ratios (FCR) using

Live weights were also used to calculate average daily gain (ADG) in pasture using

Slaughter and carcass processing
After 46 and 42 days of foraging on cover crops in 2024 and 2025, respectively, feed was withheld for approximately 12 hours, after which chickens were removed from the plots and transported to the Purdue University meat processing facility (West Lafayette, IN), where the chickens were sacrificed and processed following standard poultry processing procedures. Briefly, chickens were electrically stunned for 6 s to induce unconsciousness using a stunning knife (Midwest Production Systems, Minneapolis, Minnesota, US) and immediately exsanguinated by manual bleeding in a poultry cone. Following bleeding, carcasses were scalded in hot water at approximately 60 °C for 60–90 s to allow feather release without causing any type of damage to the carcass. Feathers were removed using a mechanical drum plucker for approximately 3 min. Following defeathering, birds were eviscerated by hand, and the carcasses were thoroughly rinsed using potable water. A final carcass wash was performed using a food-grade citric acid solution. Carcasses were subsequently chilled in ice water gondolas until an internal temperature of 4 °C was reached.
Carcass and meat measurements
Whole dressed carcass weight was obtained by weighing each fully eviscerated and washed carcass on a balance (n = 40 per treatment). Dressing percentage was calculated as the ratio of carcass weight to final live weight, multiplied by 100. Weights of both breast halves, both whole legs (including thigh and drumstick), and both wings were recorded for each of the sampled chickens and combined into a single measurement per part (n = 20 for each treatment). Carcass component yield was calculated for each body part as the ratio of part weight to carcass weight, multiplied by 100, and expressed as a percentage of carcass weight. Carcasses were stored at 4 °C until the following day, when color was measured from breast and leg meat after dissection on the day after slaughter using a Minolta CR-400 Chroma Meter (Konica Minolta, Chiyoda, Tokyo, Japan).
Statistical analysis
All statistical analyses were conducted using R software (RStudio®, PBC, Boston, MA). Feed conversion ratio (FCR), average daily gain (ADG), total feed consumed while on cover crops, total feed consumed per chicken, final live weight, dressed carcass weight, and carcass quality indicators were analyzed using linear mixed-effects models using the package afex with the mixed function. For each response variable, treatment (ICLS-LF and ICLS-HF), year, and their interaction were included as fixed effects, while (1|block: Year) was included as a random intercept to account for the random complete block design.
Cover crop chemical composition was compared separately for each of the years using linear mixed effects models and the previously mentioned packages and functions. For each response variable, treatment was included as a fixed effect while (1|block) was included as a random intercept to account for the complete block design. For the year-to-year comparisons, cover crop chemical composition was analyzed using linear mixed-effects models using the previously mentioned package and functions. For each response variable, treatment, year, and their interactions were included as fixed effects, while (1|Year: block) was included as a random intercept to account for the complete block design and the experimental differences from year to year.
Model assumptions were evaluated through visual inspection of residual versus fitted values and normal quantile-quantile plots. Fixed effects were evaluated using Type III analysis of variance (ANOVA) with denominator degrees of freedom estimated using Kenward–Roger approximation. Estimated marginal means (EMMs) were calculated using the emmeans package and pairwise comparisons among treatments within each year, as well as comparisons between years, were conducted using Tukey’s honest significance tests. Compact letter displays were used to summarize pairwise comparisons, with Sidak adjustment applied instead of Tukey when only two groups were being compared, as determined automatically by the emmeans package. Differences were considered statistically significant at P < 0.05.
Results
Mortality rates during the experimental period
In the first year of the experiment, no flock mortality occurred during brooding or while on pasture. In the second year, six chickens died during brooding, and six during the pasture (integration) phase. During the pasture phase, one bird was accidentally crushed beneath the movable coop; the other five resulted from a predator attack on 5 May 2025.
Weather effect on daily feed consumption
Daily feed consumption and daily weather conditions for both years of the chicken integration period are presented in Fig. 2. In 2024, daily feed consumed per chicken increased steadily after integration began, stabilizing between 100 and 200 g per chicken by mid-May and remaining relatively constant thereafter in both treatments. In contrast, the 2025 integration period exhibited lower feed consumption (89.3 g on average vs. 112 g in 2024), and the increase in feed consumption over time observed in 2024 was not repeated, with daily values remaining around 50–100 g across both treatments throughout the integration period. The proportion of days with consumption below 100 g roughly doubled, from 27% in 2024 to 54% in 2025, in both treatments.
Daily feed consumption (kg) and weather conditions during the chicken integration period in 2024 and 2025. The upper panels show mean daily feed consumed per plot (±SE) for ICLS-HF (green) and ICLS-LF (red) treatments. The lower panels show daily precipitation (mm, blue bars) and mean air temperature (°C, red line ± shaded SE) recorded at the study site. Integration periods spanned 7 May–18 June 2024 and 30 April–9 June 2025.

Figure 2. Long description
A multi-panel graph with four sections arranged in a two-by-two grid.
Upper Left Panel: Daily Feed Consumption 2024. The y-axis represents Feed Consumed per Chicken in grams from 0 to 250. The x-axis shows dates from May 07 to June 16. Two lines track consumption: I C L S hyphen H F in green and I C L S hyphen L F in red. Both lines show a sharp increase from zero in early May, followed by a fluctuating but generally stable trend between 100 and 200 grams, with shaded error bands indicating S E.
Upper Right Panel: Daily Feed Consumption 2025. The axes are identical to the 2024 panel, covering May 02 to June 11. The green and red lines show similar high-frequency fluctuations, generally ranging between 50 and 150 grams, with significant overlap in the shaded error regions.
Lower Left Panel: Daily Weather 2024. The left y-axis shows Precipitation in millimeters from 0 to 40, represented by blue vertical bars. The right y-axis shows Air Temperature in degrees Celsius from 0 to 40, represented by a red line with a shaded S E band. Precipitation peaks around May 24 at approximately 35 millimeters. Temperature fluctuates between 15 and 30 degrees Celsius.
Lower Right Panel: Daily Weather 2025. The axes and visual elements match the 2024 weather panel. Precipitation events are scattered, with a peak near May 20 at 30 millimeters. The temperature line shows a dip in early May followed by a steady rise, fluctuating between 10 and 25 degrees Celsius.
Cover crop establishment and forage availability
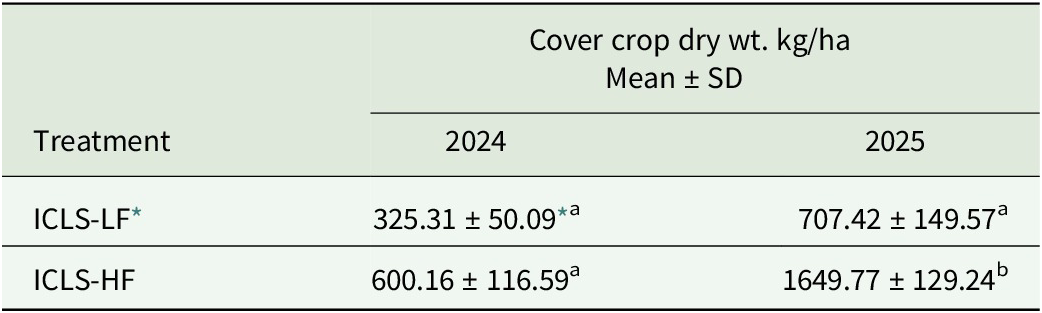
In the low forage plots, cover crops were mowed to about 7 cm. Biomass (kg ha−1) was significantly affected by forage management (F 2,15 = 27.017, P < 0.001), year (F 1,15 = 75.512, P < 0.001), and their interaction (F 2,15 = 6.315, P = 0.01024). ICLS-HF had significantly more biomass than ICLS-LF in 2025, whereas the two treatments did not differ in 2024. Both treatments accumulated more biomass in 2025 than in 2024. The estimated amount of forage available for the chickens each year is presented in Table 2.
Forage availability in a chicken-based ICLS under high forage and low forage management treatments across 2 years

Table 2. Long description
The table consists of three columns and three main rows.
Column headers:
1. Treatment.
2. 2024 Cover crop dry weight kilograms per hectare Mean plus or minus S D.
3. 2025 Cover crop dry weight kilograms per hectare Mean plus or minus S D.
Data rows:
1. I C L S dash L F: 325.31 plus or minus 50.09 in 2024; 707.42 plus or minus 149.57 in 2025.
2. I C L S dash H F: 600.16 plus or minus 116.59 in 2024; 1649.77 plus or minus 129.24 in 2025.
Footnotes indicate that I C L S dash L F stands for chicken integration with access to low forage and I C L S dash H F stands for chicken integration with access to high forage. Values with different superscripts are significantly different at P less than 0.05. The 2024 value for I C L S dash L F was estimated based on Year 2 proportional differences.
Note: Values with different superscripts are significantly different at P < 0.05 (Sidak-adjusted pairwise comparisons). Abbreviations: ICLS-LF, chicken integration with access to low forage; ICLS-HF, chicken integration with access to high forage.
* ICLS-LF treatment forage availability in 2024 was estimated using the proportional difference observed between the ICLS-LF and ICLS-HF plots in Year 2.
In 2024, cover crop management treatment was not a significant source of variation for any of the analyzed variables (Table 3). This is most likely attributed to cover crop sampling in 2024, which occurred before cover crops were mowed. In contrast, in 2025 when sampling occurred after mowing, nutritional differences in cover crops were observed between the ICLS-HF and the ICLS-LF treatment, the low forage chicken integration treatment (ICLS-LF) showed significantly higher acid detergent fiber (ADF; F 2,6 = 5.21, P = 0.049) and, significantly lower crude protein (F 2,6 = 15.10, P = 0.004) and nitrogen (F 2,6 = 15.27, P = 0.004) compared to the high forage chicken integration (ICLS-HF) treatment. This pattern suggests that forage present in the ICLS-LF plots in 2025 was lower in both nutrients and digestibility than the non-mowed treatment, possibly because mowing the new vegetative tissue from the cover crop left only the more fibrous and mature plant material for chickens to graze. Neutral detergent fiber, phosphorus and potassium contents did not differ significantly across treatments in either year. Conversely, cover crops in ICLS-LF plots exhibited significantly higher calcium (F 2,6 = 7.54, P = 0.023) and magnesium (F 2,6 = 11.03, P = 0.010) concentrations than the ICLS-HF plots in 2025.
Analysis of variance (Type III) for cover crop chemical composition in a chicken-based ICLS

Table 3. Long description
The table presents Type I I I analysis of variance for nine variables: C P, A D F, N D F, Nitrogen, Calcium, Phosphorous, Potassium, Magnesium, and Sulfur. For each variable, four metrics are provided across three categories: F-value, D f, Den D f, and P-value.
* C P: Integration treatment P equals 0.125; Year P is less than 0.001; Interaction P equals 0.026.
* A D F: Integration treatment P equals 0.635; Year P equals 0.004; Interaction P equals 0.797.
* N D F: Integration treatment P equals 0.721; Year P is less than 0.001; Interaction P equals 0.811.
* Nitrogen: Integration treatment P equals 0.128; Year P is less than 0.001; Interaction P equals 0.02.
* Calcium: Integration treatment P equals 0.078; Year P is less than 0.001; Interaction P equals 0.956.
* Phosphorous: Integration treatment P equals 0.979; Year P equals 0.008; Interaction P equals 0.891.
* Potassium: Integration treatment P equals 0.328; Year P is less than 0.001; Interaction P equals 0.102.
* Magnesium: Integration treatment P equals 0.026; Year P is less than 0.001; Interaction P equals 0.912.
* Sulfur: Integration treatment P equals 0.033; Year P is less than 0.001; Interaction P equals 0.329.
Abbreviations include A D F for acid detergent fiber, C P for crude protein, and N D F for neutral detergent fiber. Asterisks indicate significance at P less than 0.05.
Abbreviations: ADF, acid detergent fiber; CP, crude protein; NDF, neutral detergent fiber.
* Indicates significance at (P < 0.05).
Cover crop quality was lower in 2025 than in 2024, likely reflecting the stage of the cover crop at sampling and the quantity of peas present in the mixture (Bo et al., Reference Bo, Bai, Dong, Shi, Soe Htet, Samoon, Zhang, Tanveer and Hai2022): oats were vegetative in 2024 with ~28.21% of the mixed composed of peas, whereas cereal rye had reached stem extension in 2025 when tillering has ceased and the stem is elongating (Koehler-Cole, Reference Koehler-Cole2021), with only ~1.03% of the mixed composed of peas. Crude protein (CP) and nitrogen showed significant year and treatment × year effects, whereas magnesium and sulfur were affected by year and treatment as main effects but not their interaction (Table 3); CP roughly halved between years and nitrogen fell by more than 40% in both treatments (Table 4). ADF, NDF, calcium, phosphorus, and potassium were affected by year only (Table 3): ADF and NDF increased (by ~3 and ~13 percentage points, respectively), while calcium, phosphorus, and potassium declined from 2024 to 2025 (all P ≤ 0.008; Table 4).
Mean forage quality variables from a chicken-based ICLS under high forage and low forage management across 2 years

Table 4. Long description
The table displays forage quality variables measured as percent dry matter mean plus or minus standard deviation. The columns are: Treatment, C P, A D F, N D F, Nitrogen, Calcium, Phosphorus, Potassium, Magnesium, and Sulfur.
For the year 2024:
* I C L S minus L F: C P 21.0 plus or minus 1.70 super B, A D F 25.4 plus or minus 2.27 super A, N D F 36.7 plus or minus 4.60 super A, Nitrogen 3.36 plus or minus 0.27 super B, Calcium 0.89 plus or minus 0.17 super B, Phosphorus 0.63 plus or minus 0.11 super B, Potassium 4.28 plus or minus 0.53 super B, Magnesium 0.27 plus or minus 0.03 super B, Sulfur 0.27 plus or minus 0.03 super B.
* I C L S minus H F: C P 20.4 plus or minus 1.65 super B, A D F 25.3 plus or minus 2.31 super A, N D F 37.4 plus or minus 2.96 super A, Nitrogen 3.27 plus or minus 0.26 super B, Calcium 0.79 plus or minus 0.14 super B, Phosphorus 0.64 plus or minus 0.09 super B, Potassium 4.08 plus or minus 0.13 super B, Magnesium 0.24 plus or minus 0.04 super B, Sulfur 0.27 plus or minus 0.02 super B.
For the year 2025:
* I C L S minus L F: C P 9.04 plus or minus 0.97 super a A, A D F 29.1 plus or minus 0.98 super B, N D F 49.2 plus or minus 1.11 super B, Nitrogen 1.45 plus or minus 0.15 super a A, Calcium 0.48 plus or minus 0.05 super A, Phosphorus 0.45 plus or minus 0.03 super A, Potassium 3.28 plus or minus 0.16 super A, Magnesium 0.17 plus or minus 0.01 super b A, Sulfur 0.14 plus or minus 0.01 super a A.
* I C L S minus H F: C P 11.6 plus or minus 0.29 super b A, A D F 28.4 plus or minus 0.47 super B, N D F 50.0 plus or minus 0.95 super B, Nitrogen 1.86 plus or minus 0.05 super b A, Calcium 0.38 plus or minus 0.03 super A, Phosphorus 0.45 plus or minus 0.03 super A, Potassium 3.26 plus or minus 0.18 super A, Magnesium 0.13 plus or minus 0.02 super a A, Sulfur 0.16 plus or minus 0.02 super ab A.
Note: Lowercase letters indicate significant differences between treatments within each year. Uppercase superscript letters indicate significant differences between years within each treatment. Values with different superscripts are statistically different at P < 0.05 (Sidak-adjusted pairwise comparisons, P < 0.05). Abbreviations: ADF, acid detergent fiber; CP, crude protein; ICLS-LF, chicken integration with access to low forage; ICLS-HF, chicken integration with access to high forage; NDF, neutral detergent fiber.
Feed consumption
The amount of feed each chicken consumed on average differed by year (F 1,6 = 47.73, P < 0.001). Chickens ate less feed per bird while on pasture in 2025 compared to 2024 (ICLS-LF: 3.74 g vs. 4.76 kg/bird; ICLS-HF: 3.61 vs. 4.56 kg/bird; Table 5). Forage management had no significant effect on feed consumption (F 1,6 = 0.042, P = 0.844), and no treatment × year interaction was detected (F 1,6 = 0.0005, P = 0.982).
Feed conversion ratio (FCR), average daily gain (ADG), and feed consumption of cover crop-raised slow-growing broilers in an ICLS under low-forage and high forage management treatments across 2 years

Table 5. Long description
The table consists of five columns. The first column lists the variables, followed by two columns for 2024 (I C L S-L F and I C L S-H F) and two columns for 2025 (I C L S-L F and I C L S-H F).
* F C R (Feed Conversion Ratio): In 2024, values were 2.85 plus or minus 0.09 for L F and 2.90 plus or minus 0.33 for H F. In 2025, values increased to 3.13 plus or minus 0.88 for L F and 3.51 plus or minus 0.25 for H F.
* A D G (Average Daily Gain in kg/day): In 2024, both treatments were 0.04 plus or minus 0.01 (labeled with superscript a). In 2025, both treatments decreased to 0.02 plus or minus 0.01 (labeled with superscript b), indicating a significant difference between years.
* Feed consumed in brooding (kg/chicken): Values were 1.91 for both treatments in 2024 and 1.95 for both treatments in 2025.
* Feed consumed in pasture (kg/chicken): In 2024, values were 4.76 plus or minus 0.23 for L F and 4.56 plus or minus 0.714 for H F. In 2025, values decreased to 3.74 plus or minus 0.396 for L F and 3.61 plus or minus 0.541 for H F.
Note: I C L S-L F refers to low forage access and I C L S-H F refers to high forage access.
Note: Superscript letters indicate significant differences between years (Tukey adjusted pairwise comparisons, p ≤ 0.05). Abbreviations: ICLS-LF, chicken integration with access to low forage; ICLS-HF, chicken integration with access to high forage.
† Calculated by dividing the quantity of feed consumed while on cover crop by the weight gained.
‡ Calculated by dividing the weight gained by the number of days chickens were on cover crop.
§ Average feed consumption during brooding phase.
∥ Mean total feed consumption by chicken while in pasture.
Average daily gain (ADG)
Average daily gain (ADG) was significantly affected by year (F 1,6 = 27.85, P = 0.01). Chickens in 2025 had a significantly lower ADG than the chickens in 2024 (0.02 vs. 0.04 kg/day in both treatments; Table 5). Cover crop management treatment had no significant effect (F 1,6 = 0.248, P = 0.636) on ADG. Similarly, there was no interaction between forage management treatment and year (F 1,6 = 0.036, P = 0.855).
Feed conversion ratio (FCR)
Despite year differences in feed consumption and ADG, FCR on cover crops was not significantly affected by year (F 1,6 = 2.88, P = 0.14), forage management (F 1,6 = 0.85, P = 0.39), or their interaction (F 1,6 = 0.51, P = 0.50).
Carcass characteristics and body composition
Final live weight and carcass weight were both significantly affected by year (P < 0.001; Table 6). Chickens in 2024 were heavier than chickens in 2025 for both variables (Table 7), while no significant treatment or year × treatment interaction effects were detected for either variable. Dressing percentage was not significantly affected by year, treatment, or interaction effect (Table 6).
Analysis of variance (Type III) for live weight, carcass characteristics, and body part composition in a chicken-based ICLS

Table 6. Long description
The table presents Type I I I analysis of variance results across three main factors: Year, Treatment, and Year by Treatment interaction. Each factor includes columns for F, Num d f, Den d f, and P.
Under Carcass characteristics:
- Live weight (kg): Year P is less than 0.001, Treatment P is 0.64, Interaction P is 0.200.
- Carcass weight (kg): Year P is less than 0.001, Treatment P is 0.94, Interaction P is 0.300.
- Dressing percentage (%): Year P is 0.070, Treatment P is 0.13, Interaction P is 0.297.
Under Body part weights:
- Breasts weight (g): Year P is less than 0.001, Treatment P is 0.522, Interaction P is 0.671.
- Legs weight (g): Year P is less than 0.001, Treatment P is 0.472, Interaction P is 0.234.
- Wings weight (g): Year P is 0.058, Treatment P is 0.358, Interaction P is 0.528.
- Breast yields (%): Year P is less than 0.001, Treatment P is 0.168, Interaction P is 0.689.
- Leg yield (%): Year P is 0.246, Treatment P is 0.251, Interaction P is 0.286.
- Wing yield (%): Year P is 0.379, Treatment P is 0.358, Interaction P is 0.528.
Asterisks indicate significance at P less than 0.05, which occurs primarily in the Year factor for weight-based variables.
* Indicates significance at (P < 0.05).
Live weight, carcass characteristics, and body part compositions of slow-growing broilers in an organic ICLS with access to low and high amounts of forage

Table 7. Long description
The table presents Mean plus or minus S D for two treatments: I C L S minus L F (low forage) and I C L S minus H F (high forage).
For the year 2024:
* I C L S minus L F: Final live weight 2.77 plus or minus 0.23 kg; Carcass weight 1.97 plus or minus 0.17 kg; Dressing percentage 71.00 plus or minus 0.97; Breast weight 516 plus or minus 55.40 g; Breast percentage 26.1 plus or minus 0.86; Leg weight 623.00 plus or minus 70.30 g; Leg percentage 31.6 plus or minus 0.89; Wing weight 259.00 plus or minus 189.00 g; Wing percentage 13.30 plus or minus 4.78.
* I C L S minus H F: Final live weight 2.79 plus or minus 0.31 kg; Carcass weight 2.00 plus or minus 0.29 kg; Dressing percentage 71.68 plus or minus 0.19; Breast weight 514 plus or minus 67.2 g; Breast percentage 25.6 plus or minus 0.97; Leg weight 631.00 plus or minus 80.40 g; Leg percentage 31.5 plus or minus 2.05; Wing weight 225.00 plus or minus 26.80 g; Wing percentage 11.20 plus or minus 0.66.
For the year 2025:
* I C L S minus L F: Final live weight 2.07 plus or minus 0.28 kg; Carcass weight 1.43 plus or minus 0.20 kg; Dressing percentage 69.80 plus or minus 1.13; Breast weight 249.00 plus or minus 36.00 g; Breast percentage 17.5 plus or minus 0.95; Leg weight 485.00 plus or minus 68.70 g; Leg percentage 34.0 plus or minus 0.61; Wing weight 194.00 plus or minus 28.20 g; Wing percentage 13.60 plus or minus 0.411.
* I C L S minus H F: Final live weight 2.00 plus or minus 0.29 kg; Carcass weight 1.40 plus or minus 0.19 kg; Dressing percentage 70.3 plus or minus 2.47; Breast weight 237.00 plus or minus 41.4 g; Breast percentage 16.6 plus or minus 1.77; Leg weight 454.00 plus or minus 69.90 g; Leg percentage 31.8 plus or minus 3.14; Wing weight 187.00 plus or minus 21.30 g; Wing percentage 13.2 plus or minus 0.786.
Superscript letters a and b indicate significant differences between years for the same treatment.
Note: Lowercase superscript letters indicate significant differences between treatments within each year (P ≤ 0.05). Variables with no superscript letters had no significant differences detected for year, treatment, or their interaction. Abbreviations: ICLS-LF, chicken integration with access to low forage; ICLS-HF, chicken integration with access to high forage.
Breast weight and combined leg weight were both significantly affected by year (P < 0.001; Table 6). Chickens in 2024 had approximately 53% heavier breasts than in 2025 (Table 7), with no significant treatment or interaction effects. Breast yield declined from about 26% of carcass weight in 2024 to 17% in 2025 (P < 0.001; Table 6 and Table 7), again with no treatment or interaction effects. Legs were also 25% heavier in 2024 than in 2025. In contrast, leg weight as a percentage of carcass weight was not significantly affected by year, treatment, or their interactions (Table 6), remaining stable between 31.5% and 34% of carcass weight across all treatments and years (Table 7).
Neither combined wing weight nor wing weight as a percentage of carcass weight were significantly affected by year, treatment, or their interactions (Table 6). The wing yield ranged from 11.2% to 13.6% of carcass weight across all groups (Table 7).
Color results
Lightness (L*) of meat (Table 8) was significantly affected by Year (F 1,6 = 28.388, P < 0.05). Higher L values for all evaluated body parts were measured in 2025 compared to 2024 across treatments. Forage treatment had no significant effect on lightness (F 1,282 = 0.024, P = 0.878), and there was no significant interaction between year and forage treatment (F 1,282 = 0.068, P = 0.794).
CIELAB color values of breast and leg meat of cover crop-raised slow-growing broilers in an ICLS under mowing and non-mowing cover crop management treatments across 2 years

Table 8. Long description
The table presents Mean plus or minus S D for color parameters.
For 2024:
- L star: Values range from 58.2 plus or minus 5.46 for I C L S-L F Leg to 60.65 plus or minus 7.07 for I C L S-H F Breast.
- A star: I C L S-L F Breast is 5.41 plus or minus 2.61; Leg is 5.78 plus or minus 2.75. I C L S-H F Breast is 8.20 plus or minus 4.21; Leg is 5.99 plus or minus 2.00.
- B star: Values range from 18.4 plus or minus 6.53 for I C L S-H F Leg to 22.7 plus or minus 6.93 for I C L S-H F Breast.
For 2025:
- L star: Values are higher than 2024, ranging from 62.3 plus or minus 4.56 for I C L S-L F Leg to 66.9 plus or minus 2.90 for I C L S-L F Breast.
- A star: Values are generally lower than 2024, with Breast meat at 1.72 plus or minus 1.93 for I C L S-L F and 1.82 plus or minus 1.34 for I C L S-H F.
- B star: Values range from 14.0 plus or minus 5.55 for I C L S-L F Breast to 20.6 plus or minus 9.80 for I C L S-H F Leg.
Superscript capital letters indicate significant differences between treatments within a year, and lowercase letters indicate differences between years (P less than or equal to 0.05).
Note: Superscript capital letters indicate significant differences between treatments within each year. Superscript non-capital letters indicate significant differences between years (Sidak-adjusted pairwise comparisons, P ≤ 0.05). Abbreviations: ICLS-LF, chicken integration with access to low forage; ICLS-HF, chicken integration with access to high forage.
Redness (a*) was significantly affected by year (F 1,6 = 24.29, P < 0.005) and by body part (F 1,280 = 8.04, P < 0.005). Significant interactions occurred between year and forage management (F 1,280 = 12.20, P < 0.001), year and body part (F 1,280 = 33.26, P < 0.001), and forage management and body part (F 1,265 = 8.72, P < 0.005). In 2024, breast meat from high forage plots had higher redness values than breast meat from low forage plots (8.20 ± 4.21B vs. 5.41 ± 2.61A, P < 0.0001; Table 8), and no differences were detected between leg meat. In the second year, forage treatment had no effect on breast redness, but leg meat from low forage plots had higher redness scores than leg meat from high forage plots (5.39 ± 3.23 vs. 4.05 ± 3.01).
Yellowness (b*) (Table 8), was significantly affected by Year (F 1,6 = 17.823, P < 0.01). Lower b* values were measured in the second year compared to the first year. There were significant interactions between year and part of the body (F 1,283 = 19.538, P < 0.001) and between forage management treatment and part of the body (F 1,283 = 4.34, P = 0.038). The three-way interaction was not significant. b* value declined from 2024 to 2025. Pairwise comparisons showed no differences between treatments based on year or part of the body.
Discussion
The primary finding was that cover crop management, and the associated differences in forage quantity and quality, did not significantly affect growth performance, feed efficiency, carcass characteristics, or most meat quality indicators in slow-growing broilers raised in an organic ICLS. Instead, production year was the dominant source of variation across most measured variables. It is important to note that year is not a single explanatory variable but a composite term encompassing several sources of variation that could not be separated within the present experimental design, including climatic conditions, cover crop species mix and maturity at integration, sampling timing and broiler genetics.
Forage availability and nutritional composition
Cover crop management treatment application resulted in different amounts of forage available to chickens. Surprisingly, cover crop management also resulted in forages of differing quality. In 2025, when forage was sampled after mowing, ICLS-LF plots had higher acid detergent fiber, lower crude protein and nitrogen compared to the high forage treatment (Tables 3 and 4). This pattern could be attributed to the removal of leafy, nitrogen-rich vegetative tissue during mowing, which leaves behind more mature and fibrous material from the plant base for chickens to graze (Bo et al., Reference Bo, Bai, Dong, Shi, Soe Htet, Samoon, Zhang, Tanveer and Hai2022). In 2024, when sampling and measurement of cover crop quality occurred before treatments were implemented, there were no differences in cover crop nutrient profiles (Snapp and Borden, Reference Snapp and Borden2005).
Forage nutritional quality also differed considerably between years. Crude protein, nitrogen, and several minerals decreased, and fiber increased from 2024 to 2025. These differences are most likely attributed to the cover crop growth stage at sampling and the quantity of peas present in the mix; a larger proportion of peas was present in 2024 compared to 2025. Oats and peas were vegetative while cereal rye was close to flowering, which led to higher structural carbohydrate content and lower protein concentration (Bo et al., Reference Bo, Bai, Dong, Shi, Soe Htet, Samoon, Zhang, Tanveer and Hai2022). Moreover, (Kantar et al., Reference Kantar, Sheaffer, Porter, Krueger and Ochsner2011) observed that crude protein in cereal rye declines continuously with advancing maturity while NDF increases quadratically, peaking near anthesis, supporting that the stage at which the cover crop was sampled was one of the drivers of forage nutritional composition. If farmers wish to maximize the potential gains from cover crop supplemental consumption, the stage of the cover crop when chickens are integrated is a factor that should be taken into consideration.
Growth performance and feed efficiency
Despite the considerable differences in forage availability and quality between treatments, chickens in the ICLS-LF and ICLS-HF treatments did not differ in final live weight, ADG, FCR, or feed consumption within either year. The limited effect of forage management is consistent with the role of cover crops as a supplemental feed source rather than a primary source in this type of system (Thongjued et al., Reference Thongjued, Garcia, Halmos, Pulliam, Gonthier and Dupuis2025). Given that chickens had access to a balanced feed provided ad libitum, differences in forage availability likely did not translate into performance differences due to the limited consumption and digestibility of the forage. In free-range and pasture-raised systems where birds receive a complete diet, forage consumption contributes mainly to micronutrient intake and to bioactive compounds such as polyunsaturated fatty acids, carotenoids, and tocopherols in meat and eggs (Dal Bosco et al., Reference Dal Bosco, Mugnai, Mattioli, Rosati, Ruggeri, Ranucci and Castellini2016), rather than to macronutrient-driven growth (Sales Reference Sales2014). Rivera-Ferre, Lantinga, and Kwakkel (Reference Rivera-Ferre, Lantinga and Kwakkel2007) reported that free-range broilers on pasture obtained only 3–7% of their daily energy from herbage. Consistent with this, a meta-analysis by Sales (Reference Sales2014) found no significant effect of pasture access on growth rate, feed intake, or FCR across a wide range of systems and genotypes; the only consistent effects were on meat fat concentration and fatty acid composition. These findings suggest that contrasting forage environments do not result in detectable differences in chicken performance.
The FCR values recorded in this study, 2.85–2.90 in 2024 and 3.13–3.51 in 2025, were slightly higher but comparable to previously published performance indicators for slow-growing broiler genotypes raised on pasture. In 2024, for the Freedom Ranger broiler breed, the observed feed conversion ratios were similar to those reported by Bilenky et al. (Reference Bilenky, Nair, McDaniel, Shaw, Bobeck and Delate2024), who reported FCR values of 2.43–3.25 for Red Ranger and Imperial chickens integrated into organic vegetable cover crop rotation at 70–75 days of age, and Elmore et al. (Reference Elmore, Ahn, Dickson, Nair and Bobeck2025) who reported FCR values of 2.19–2.44 for organically raised Freedom Ranger broilers grown outdoors in movable coops comparable to the ones used in the present study at 9 weeks of age. Across the broader slow-growing genotype literature, Rezaei et al. (Reference Rezaei, Yngvesson, Gunnarsson, Jönsson and Wallenbeck2018) reported an FCR of 2.9 for slow-growing Rowan Ranger chickens reared indoors for 71 days on organic diets, and Sözcü et al. (Reference Sözcü, İpek, Gündüz and Gunnarsson2024) observed FCR values of 2.28 for Sasso XL44 × SA51A slow-growing broilers raised in a free-range system at 63 days. At the upper end of the range, Mattioli et al. (Reference Mattioli, Angelucci, Castellini, Cartoni Mancinelli, Chenggang, Di Federico, Chiattelli and Dal Bosco2024) reported an FCR value of 4.10 at 81 days for the Robusta Maculata × Sasso crossbreed in a free-range system, attributing this to the high physical activity of that genotype and the associated increase in energy expenditure for nonproductive activities. The FCR values therefore fall within the expected range for slow-growing broilers in pasture-based ICLS, while the higher 2025 values approach the upper end reported under outdoor conditions and likely reflect the reduced feed intake and increased energy expenditure discussed below.
The lower live weights, ADG, and feed consumption observed in 2025 relative to 2024 likely reflect the combined influence of several factors. First, the breed change from Freedom Rangers to Red Sasso between years could be one of the drivers since different genotypes often exhibit different behaviors and responses to the same management practices (Dal Bosco et al., Reference Dal Bosco, Mattioli, Cartoni Mancinelli, Cotozzolo and Castellini2021). Beyond breed, feed intake disruption in 2025 was likely a significant driver of reduced performance. A predator attack early in the integration period resulted in mortality and injury of several birds. Predator pressure is a stressor in pasture-raised broiler systems and has been associated with reduced growth performance (Delgadillo et al., Reference Delgadillo, Glidden, Pollak, Rysenga, Jolles and Beechler2021). Feed caking was also frequently observed in 2025, coinciding with a wetter June compared to 2024, which may have physically limited feeder access and reduced feed intake on multiple occasions. Temperature and humidity fluctuations outside the thermoneutral zone (16–26 °C) for broilers have also been shown to negatively affect feed intake and growth performance (Lara and Rostagno, Reference Lara and Rostagno2013; Kim et al., Reference Kim, Seong, Seol, Park, Kim, Park, Cho and Lee2025), and the warmer temperatures recorded in 2025 relative to 2024 (25.4°C vs. 23.0°C; Table 2) may have contributed as a secondary factor. Finally, the substantially lower crude protein and higher fiber content of the cover crop in 2025 relative to 2024 raises the possibility that birds consuming forage in 2025 received lower quality supplementation than those in 2024, potentially compounding the effects of reduced supplemental feed intake, although this cannot be confirmed from the available data.
Live weight, carcass characteristics, and body part composition
Despite the considerable differences in forage availability and quality between treatments, chickens in the ICLS-LF and ICLS-HF treatments did not differ in final live weight, ADG, FCR, or feed consumption within either year. The limited effect of forage management is consistent with the role of cover crops as a supplemental feed source rather than a primary source in this type of system (Thongjued et al., Reference Thongjued, Garcia, Halmos, Pulliam, Gonthier and Dupuis2025). Given that chickens had access to a balanced feed provided ad libitum, differences in forage availability likely did not translate into performance differences due to the limited consumption and digestibility of the forage. In free-range and pasture-raised systems where birds receive a complete diet, forage consumption contributes mainly to micronutrient intake and to bioactive compounds such as polyunsaturated fatty acids, carotenoids, and tocopherols in meat and eggs (Dal Bosco et al., Reference Dal Bosco, Mugnai, Mattioli, Rosati, Ruggeri, Ranucci and Castellini2016), rather than to macronutrient-driven growth (Sales Reference Sales2014). Rivera-Ferre, Lantinga, and Kwakkel (Reference Rivera-Ferre, Lantinga and Kwakkel2007) reported that free-range broilers on pasture obtained only 3–7% of their daily energy from herbage. Consistent with this, a meta-analysis by Sales (Reference Sales2014) found no significant effect of pasture access on growth rate, feed intake, or FCR across a wide range of systems and genotypes; the only consistent effects were on meat fat concentration and fatty acid composition. These findings suggest that contrasting forage environments do not result in detectable differences in chicken performance.
The FCR values recorded in this study, 2.85–2.90 in 2024 and 3.13–3.51 in 2025, were slightly higher but comparable to previously published performance indicators for slow-growing broiler genotypes raised on pasture. In 2024, for the Freedom Ranger broiler breed, the observed feed conversion ratios were similar to those reported by Bilenky et al. (Reference Bilenky, Nair, McDaniel, Shaw, Bobeck and Delate2024), who reported FCR values of 2.43–3.25 for Red Ranger and Imperial chickens integrated into organic vegetable cover crop rotation at 70–75 days of age, and Elmore et al. (Reference Elmore, Ahn, Dickson, Nair and Bobeck2025) who reported FCR values of 2.19–2.44 for organically raised Freedom Ranger broilers grown outdoors in movable coops comparable to the ones used in the present study at 9 weeks of age. Across the broader slow-growing genotype literature, Rezaei et al. (Reference Rezaei, Yngvesson, Gunnarsson, Jönsson and Wallenbeck2018) reported an FCR of 2.9 for slow-growing Rowan Ranger chickens reared indoors for 71 days on organic diets, and Sözcü et al. (Reference Sözcü, İpek, Gündüz and Gunnarsson2024) observed FCR values of 2.28 for Sasso XL44 × SA51A slow-growing broilers raised in a free-range system at 63 days. At the upper end of the range, Mattioli et al. (Reference Mattioli, Angelucci, Castellini, Cartoni Mancinelli, Chenggang, Di Federico, Chiattelli and Dal Bosco2024) reported an FCR value of 4.10 at 81 days for the Robusta Maculata × Sasso crossbreed in a free-range system, attributing this to the high physical activity of that genotype and the associated increase in energy expenditure for nonproductive activities. The FCR values therefore fall within the expected range for slow-growing broilers in pasture-based ICLS, while the higher 2025 values approach the upper end reported under outdoor conditions and likely reflect the reduced feed intake and increased energy expenditure discussed below.
The lower live weights, ADG, and feed consumption observed in 2025 relative to 2024 likely reflect the combined influence of several factors. First, the breed change from Freedom Rangers to Red Sasso between years could be one of the drivers since different genotypes often exhibit different behaviors and responses to the same management practices (Dal Bosco et al., Reference Dal Bosco, Mattioli, Cartoni Mancinelli, Cotozzolo and Castellini2021). Beyond breed, feed intake disruption in 2025 was likely a significant driver of reduced performance. A predator attack early in the integration period resulted in mortality and injury of several birds. Predator pressure is a stressor in pasture-raised broiler systems and has been associated with reduced growth performance (Delgadillo et al., Reference Delgadillo, Glidden, Pollak, Rysenga, Jolles and Beechler2021). Feed caking was also frequently observed in 2025, coinciding with a wetter June compared to 2024, which may have physically limited feeder access and reduced feed intake on multiple occasions. Temperature and humidity fluctuations outside the thermoneutral zone (16–26°C) for broilers have also been shown to negatively affect feed intake and growth performance (Lara and Rostagno, Reference Lara and Rostagno2013; Kim et al., Reference Kim, Seong, Seol, Park, Kim, Park, Cho and Lee2025), and the warmer temperatures recorded in 2025 relative to 2024 (25.4°C vs. 23.0°C; Tables 1 and 2) may have contributed as a secondary factor. Finally, the substantially lower crude protein and higher fiber content of the cover crop in 2025 relative to 2024 raises the possibility that birds consuming forage in 2025 received lower quality supplementation than those in 2024, potentially compounding the effects of reduced supplemental feed intake, although this cannot be confirmed from the available data.
Conclusion
Organically raised meat chickens with constant access to cover crops as forage resulted in similar performance as traditional pastured meat chickens despite differing levels of forage quantity and quality. This suggests that cover crop management of the type evaluated in this study does not meaningfully affect chicken performance when birds have continuous access to a nutritionally complete diet. However, future research should evaluate performance on a variety of cover crops used on diversified farms. Production year was the dominant source of variation across all measured variables. However, because breed, cover crop species composition, sampling timing, feed intake disruption, and climate differed between years, these factors are confounded within the present design, and their individual contribution cannot be determined. Future work using a single breed across years, or multiple cover crop mixtures within a year, would be required to isolate these effects. The stable leg and wing yields observed across both years and breeds point to outdoor rearing as a consistent driver of body composition in slow-growing broilers, independent of forage management. Overall, these findings suggest that cover crops can serve as a viable pasture component in organic poultry-based ICLS without compromising animal performance.
Supplementary material
The supplementary material for this article can be found at http://doi.org/10.1017/S1742170526100660.
Acknowledgments
We would like to thank all of those involved in this project, including undergraduate assistants who helped with chicken care, data collection, field work, and sample processing; Isaac Damer, Jenny Flesher, Keirsyn Amponsah, Ashlynn Smith, Natalie Soupeys, Nathan Jarboe, Mia Schecter, and Makayla Bennett. We would like to extend our gratitude to the staff of the Meigs Research Horticulture Farm, including Brian Schilling, Will Brown-Grimm, Chloe Henscheid, and the staff of the Animal Science Research and Education Center (ASREC) poultry division, including Jason Fields and Olivia Hinkle. We would also like to thank Emily Ford and Laura Kerr and the staff at the Purdue University Meat Processing facility for their support with chicken processing and Dr. Stacy Zuelly for the use of her lab’s handheld colorimeter. Without their help and support this project would not have been possible. We would also like to thank Julie Brown and Dr Kellie McGrady for advice and guidance on animal health and welfare.
Authors declare AI was not used to generate text, create figures, or collect and analyze data.
Author contributions
Conceptualization: M.T.B.; Data curation: J.C.A.; Formal analysis: J.C.A.; Funding acquisition: P.D.E., A.P.T., A.J.D., A.A., L.A.H., M.T.B.; Investigation: J.C.A., H.E.R.A., J.A.T., M.T.B.; Methodology: J.C.A., P.D.E., M.T.B.; Project administration: M.T.B.; Resources: M.T.B.; Supervision: P.D.E., M.T.B.; Validation: P.D.E., M.T.B.; Visualization: J.C.A.; Writing—original draft: J.C.A.; Writing—review and editing: L.A.H, A.A., P.D.E., A.P.T., M.T.B.
Funding statement
This work was supported by Organic Center-FFAR Joint Organic Research Program TOCFFAR-RES-2023-001.
Competing interests
The authors declare none.
Ethical Standards
All experiments involving animals were reviewed and approved by the Purdue University Animal Care and Use Committee (protocol#: 0723002408).







 Open access

