Politicians in democracies have strong partisan and electoral incentives to manipulate the amount, nature and timing of the provision of crucial collective goods.Footnote 1 India, a long-standing democracy, with strong distributive coalitions and interest groups, should be no exception to these expectations.Footnote 2 Yet, as Franzese insists, we need better analysis and tests of the contextual conditions under which politicians make decisions about public expenditure.Footnote 3 A large number of political economy studies have advanced our knowledge about the motivations of policy makers (office-seeking or policy-seeking),Footnote 4 voter expectations, and their effect on the supply of public and economic goods in Western contexts,Footnote 5 but analyses of political-institutional incentives in shaping economic activity across different contexts, especially, non-Western contexts are rarer.Footnote 6 This article assesses the role of the institutional, partisan and political contexts in shaping public decisions across the states of India, contributing to an understanding of public goods provision in an important developing country.
Almost all studies of public expenditures focus on one or two types of public expenditure – either infrastructure or social sector spending. Such empirical studies yield markedly mixed results with some showing the effect of the number of parties while others showing the effect of election cycles. We, in contrast, examine the full range of public expenditure – education, health, irrigation and agriculture, and social security – together in one study. Since changes in different types of government spending do not follow a unified trend, it is very important to test the reasons for varying changes in types of government expenditure. This article, then, aims to assess which specific aspect of democratic functioning and institutions – extent of political competition, election timing, margin of victory, the ideology of the ruling party, among others – has an impact on a government’s fiscal commitment to a wide range of public expenditure in education, health, social security and, in a largely rural country like India, irrigation and agriculture.
Our theoretical aim of fine-tuning the effect of democracy and adding a full range of public expenditure fits well with India’s regional and subnational diversity as well as regional control over economic and social services.Footnote 7 The provision of public goods and general social expenditure seems to vary widely across provincial arenas within India.Footnote 8 Despite common national pressures towards declining social and economic services in the 1990s, Bihar and Uttar Pradesh, for example, invest much less in developmental expenditure than Haryana and Gujarat.Footnote 9 This puzzling variation within a common context raises a crucial question: what explains these subnational differences in the provision of public goods in a democracy?Footnote 10 Given India’s ideological diversity, especially across its states, there is an expectation that partisan ideology could matter across Indian states.Footnote 11 Is this true?
These questions also suggest a subnational research design. Those who have highlighted the role of contextual variables rely on a cross-national methodology, which enables the testing of such macro-political variables as electoral systems (winner take all versus proportional representation), and regime type (democracy versus authoritarian) as well as macro-economic variables such as central bank independence and the exchange rate regime.Footnote 12 This preferred methodology, though, is unable to account for more subtle distinctions among macro-institutions and, in our view, leaves under-studied micro-contextual variables, such as the timing of elections, margin of victory, presence of coalition governments, number of parties and ideology of the parties. For this reason, it is our contention that some of these variables may better be studied with the help of a subnational rather than an international comparative method.Footnote 13
In brief, we find strong and enduring effects of cyclical (timing of elections and alteration of power) and institutional variables (the extent of party competition) on public expenditure choices and minimal effect of ideology. These effects across a range of social (education, and health) and economic goods (agriculture and irrigation) are striking and important. What are the implications of these findings? We start by outlining a theoretical argument that brings together three different mechanisms – compensation, political uncertainty and the fiscal constraints of regional rulers – to explain these results. The second section develops this broad theoretical debate into narrower, empirically testable, hypotheses. Our hypotheses are enriched by factors that are specific to our case study, but we believe that they offer generalizable insights elsewhere. The third section explains our methodology and data sources. The fourth section illustrates a simple model to test these hypotheses. The fifth section discusses our empirical results and elaborates on the implications of the finding.
Theoretical Argument
Globalization pressures on public expenditures increases the role of political and institutional factors through three important mechanisms: imperatives of stability under conditions of political uncertainty; demand for insurance and protection as a result of rising vulnerabilities, declining revenues and fiscal pressures; and specific fiscal and political dilemmas of subnational rulers (strong anti-incumbency patterns and re-election imperatives). The conclusions in the literature on public expenditures are divided and fragmented (some finding the effect of elections cycles and others the effect of institutional factors like number of parties), because analysts focus on different mechanisms exclusively. In contrast, we argue that elected politicians are faced with a trade-off between political supply-side (political uncertainty arising out of re-election possibilities) and demand-side (demand for greater insurance and compensation) imperatives. Public choices about government expenditures are an attempt to balance these trade-offs. We further differentiate between political and economic uncertainty: one caused by increasing interest burdens, and declining central transfers and revenues and political uncertainty arising out of intense anti-incumbency trends in India. We further note that both these factors are more urgent at the subnational rather than the national level and it is important to theorize dilemmas of subnational rulers separately from those of central and other actors in any system.
A powerful argument in the literature on economic globalization argues that in an open economy, policy makers and politicians may retain less autonomy over some policies, so that partisan cycles will be less pronounced than in the erstwhile less-exposed period (for India that was 1960–90). Alternatively, Karl Polanyi writing about an earlier period of market liberalization (i.e., the nineteenth century) presented a fascinating and powerful argument, which suggested that market pressures may, in fact, catalyse societal demands for greater protection and insurance.Footnote 14 Geoffrey Garrett incorporated this classic argument into his analysis of a more recent globalization, arguing that international exposure and market integration increases ‘the demand on government to mitigate the insecurities, instabilities and inequalities it has generated’, leading governments to evolve policies that ameliorate market-generated inequalities and risks.Footnote 15 Our findings and evidence confirms of the possibility of this alternative effect. In India’s federal system, similar to other federal systems, subnational governments are responsible for the welfare measures of its citizens and face these compensation pressures directly. In fact, for subnational rulers, the opening up of the economy creates more opportunities for re-regulation of their regional economy as well as more fiscal pressure.Footnote 16 Thus, while, on one hand, economic liberalization increases the policy manœuvrability and policy autonomy of subnational actors,Footnote 17 on the other, by increasing interest payment pressures and by reducing revenue resources and transfers, it puts additional downward pressures on public expenditure in the crucial social sectors. Thus, it is likely that we shall see governments faced with such pressures at the local and regional level more strongly than at the central level.
Yet we argue that this theory of compensation needs an additional theoretical mechanism to undergird it. We suggest that we go deeper and posit political and economic uncertainty as the root cause of such societal demands (a Polanyi mechanism) as well as the politician’s receptiveness to such demands from the population. Thus, we argue that this demand-led factor, driven by economic uncertainty faced by the voters, would not affect government choices unless it affected political uncertainty and the pressures that political actors faced. In addition to the vulnerabilities of the voters, institutional factors that affect the possibility of the election of officials are crucial. This is why an increase in party competition – a larger effective number of parties, for instance – contributes to an upward movement in education expenditure, for example. India has also seen strong anti-incumbency trends at the subnational level in recent times, in that very few governments are re-elected after the five-year cycle. The scholarly and empirical literature on India concludes that India does have a strong anti-incumbency bias in contrast to the pro-incumbency trends in United States, for example.Footnote 18 This strong alternation of governments is an additional source of political uncertainty, driving expenditure towards ‘lumpy goods’ that are visible and increasing the role of cyclical and institutional factors. In this sense, uncertainty and fiscal pressure combined with anti-incumbent cycles in India also generate incentives for paying attention to the alternation of power and cyclical variables.Footnote 19 Thus, under some conditions, signals derived from both electoral cycles and institutional incentives enable subnational rulers to deal with political (anti-incumbency trends) and economic uncertainty (fiscal pressure).
These arguments need not exclude the importance of some of the general conclusions found in the public choice literature. The conventional approach has been to model local political decision making over the provision of local public goods as a median voter procedure,Footnote 20 which assumes homogeneous populations and perfect information about the median voter.Footnote 21 The assumption is that in each political unit a government is elected by majority rule. Competition between governments leads to the election of a government that chooses policies identical to the position of the median voter. This modelling technique fails to incorporate attention to political institutions or to the fact that political elites are faced with uncertain information and uncertain prospects and use their ideological signposts as orientating devices and framing tools. We suggest that a richer understanding of median voter models can be achieved by having an understanding of more nuanced partisan and ideological variables.
Empirical Hypotheses
We generate many of our hypotheses by building on the work of Khemani, Chhibber and Nooruddin, and Bardhan and Mookerjee.Footnote 22 For instance, based on a study of fifteen major states in the period 1972–95, Stuti Khemani showed that subnational governments have higher spending and higher fiscal deficits when their government belonged to the same party as that in the central government.Footnote 23 Another study by Khemani is similar in approach to our study, in that she specifically models the effect of election timings on the provision of road infrastructure.Footnote 24 Our results, though, appear to extend the scope of her findings by suggesting that electoral political cycles may also have an effect on social infrastructure spending at the subnational level. However, our results offer mixed evidence as to whether electoral cycles and alternation of power have a consistently positive effect on such fiscal spending. We believe that the potential disparity in our results stems from her narrower choice of variables. In her study, she only considers two related politically independent variables – the scheduled election year, and the midterm election year – and three economic variables – state domestic product, share of agriculture in state domestic product (SDP) and the extent of urbanization. We test a wider variety of independent political variables and are able to get a sense of the relative weights of each of those effects.
Our study also has much in common with the study by Pradeep Chhibber and Irfan Nooruddin. Departing from the constraints of the fiscal federalism literature, Chhibber and Nooruddin study fifteen states during 1967–97 and find that states that are governed by a two-party system tend to provide a greater share of public goods than states that are governed by multi-party systems.Footnote 25 Our results (using a wider range of independent political variables and fully disaggregated variables dependent on state government expenditure) appear to confirm the importance of the number of effective parties in the provision of public goods, but we show that other factors have a more consistent effect across different types of public service expenditure. For instance, our article builds upon their conclusions to find that alternation of power and the timing of elections have a sustained effect on the financing of disaggregated developmental expenditure (education versus health versus irrigation versus social services).
In order to test the effect of both political business cycle variables comprehensively, as well as variables important for institutional analysis, we have compiled a dataset of a range of political variables. We have divided our political variables into three broad categories: institutional, ideological and cyclical.
By institutional variables, we understand those features that refer to the key characteristics of the political system, namely the effective number of political parties and the margin of victory of the winning political party. By ideological variables, we understand the ideological component of the main political parties in India. In India, the standard ideological spectrum (left, right or centre) may be roughly translated into the ideology of the three main national political parties in India (the Congress Party, a broad centre-left party; the Bharatiya Janata Party, a broad centre-right party; and the Communist Party of India (Marxist), a leftist party). We also incorporate into our analysis of regional parties, namely political parties that have a regional base based on a given linguistic or geographic area. Finally, by cyclical variables, we understand those variables that deal with the timing of an election or those episodes in which there is alternation of power (namely whether one election cycle is followed by rule by a different political party than prior to the election).
Our set of ideological, cyclical and institutional political variables can be summarized. The key political variables that we will be examining include:
Institutional
— Effective number of parties in the state legislature
— Margin of victory in previous state assembly election
Ideological
— Ideological focus of a political party as head of state government
— Regional vs. national party as head of state government
— Coalition government vs. single party as head of state government
Cyclical
— Election timing
— Change from previous party in power.
From this large set of political variables we are able to develop some specific hypotheses relating to their likely effect on fiscal expenditures. First of all, we examine what we have labelled as ‘institutional variables’: extent of party competition and the margin of victory. We hypothesize that the extent of party competition within the regional state could also affect the provision of public goods. Lizzeri and Persico have shown that, in proportional representation systems, the margin of victory is important because it determines the candidates’ expected payoff.Footnote 26 However, they argue that in a winner-takes-all electoral system, the margin of victory is irrelevant. In India’s subnational winner-takes-all system, we anticipate that political parties that win with a large margin of victory are less likely to bribe voters with local public goods expenditure.
Moreover, we also want to test whether an increase in the number of parties reflects a demand for more public expenditures. Chhibber and Nooruddin have shown that states with two-party competition provide more public goods than states with multi-party competition.Footnote 27 In contrast, we hypothesize that the extent of party competition increases political uncertainty and pressures on state-level incumbents, which is likely to increase public expenditure. This is consistent with our theoretical arguments about the role of uncertainty on rulers.
These expectations about institutional variables generate a series of formal hypotheses:
HYPOTHESIS 1: An increase in the effective number of parties represented in a state legislature results in an increase in public service expenditure.
HYPOTHESIS 2: Political parties that have obtained a large margin of victory in a state assembly election are less likely to increase its expenditure on public services than political parties that have obtained a slim victory.
We also want to examine the role that ideological variables play in public service expenditure. In parliamentary democracies like India, party loyalty and ideologies are likely to be salient. At the national level, numerous ideologically orientated parties shape the nature of party competition in distinct ways: the Bharatiya Janata Party (BJP), the Communist Party of India (Marxist) and Shiv Sena are strongly ideological and cadre-based.Footnote 28 Moreover, India has a proliferation of regional parties with strong programmatic orientations wedded to issues and not merely to office. The Congress Party, a centrist party, also took a turn to the left in the 1970s and has attempted to articulate a strong ideological core in favour of a broader, but coherent, coalition. In the 2004 general elections, it won power on a mandate of a more rural and public goods strategy and has expressed commitment to increase public investment in infrastructure and rural public goods. Thus, in India’s parliamentary and federal democracy, parties, their ideologies and mandates are likely to have a significant effect on policy and the provision of public goods.
The effect of ideological variables is a contested issue in the literature. The median voter model of political economy suggests that the preferences and ideology of political parties are not relevant since every political party has to adjust to the preferences of the median voter. In contrast, classical partisan theory provides some room for the effect of ideological differences.Footnote 29 For example, Boix shows that a significant variation in public expenditure in education in OECD countries can be explained by partisan differences.Footnote 30 Therefore, we ask whether leftist parties show a preference for local public goods expenditures that favour the expansion of physical and human capital, particularly health and education in India. Likewise, we also want to examine whether India’s two principal national parties, the Hindu nationalist BJP and the Congress Party, show a divergence in preference for any type of public goods provision. Our anticipation is that, given its explicit preference for improving the fiscal health of states,Footnote 31 BJP-led governments are less likely to increase fiscal expenditures on certain types of public service expenditures, such as health and education. In contrast, we anticipate that, based on its explicit electoral claims to increase social and physical infrastructureFootnote 32 and in an effort to distinguish itself from other parties that do not have a strong national base in the rural sector, state governments led by the Congress Party are more likely to increase public service expenditures in certain types of public service expenditures, particularly in items of interest in rural sectors (such as agriculture and irrigation).
We also want to determine whether regional parties differ from national parties in their emphasis on the provision of some public goods. Some important strands of the decentralization literature on fiscal federalism tend to argue that subnational jurisdictions systematically incorporate their own distributional preferences into their spending decisions.Footnote 33 In this framework, regional political parties can reflect local preferences better than national parties. On the other hand, regional political parties can, at the same time, be clientelistic, rather than programmatic (as national political parties tend to be). In this sense, the expectation is that the spending preferences of state governments controlled by regional parties ought to differ substantially from that of national parties due to their need to maintain the party’s clientelistic system of support. Therefore, we ask whether regional parties reflect local preferences better or differently from national parties. We also want to find out whether the fact that some state governments are a coalition has an effect on the provision of public goods. We anticipate that a coalition government at the subnational level is likely to produce greater local public goods expenditure because it has to appeal to a more heterogeneous constituency.
The above questions about the effect of ideology on public service expenditure can be expressed formally as follows:
HYPOTHESIS 3: A state government controlled by a national centre-left party, like the Congress Party, prefers to spend more on certain types of public service expenditure, such as agriculture and irrigation, compared with other political parties.
HYPOTHESIS 4: A state government controlled by a national centre-right party, like the BJP, prefers to spend less on certain types of public service expenditure, such as health and education, compared with other political parties.
HYPOTHESIS 5: A state government controlled by a national leftist party, like the CPI (M), prefers to spend more on certain types of public service expenditure, such as health and education, compared with other political parties.
HYPOTHESIS 6: A state government controlled by a regionalist political party, like the DMK, the AIADMK or the AGP, prefers to spend more on certain types of public service expenditure, such as health and education, than does a government controlled by a national political party.
HYPOTHESIS 7: Coalition governments spend more on public service goods than non-coalition governments.
Finally, in addition to the ideological variables described above, our article examines several cyclical variables. They include alternation of power and the timing of elections. First, we want to determine whether alternation of power could affect the level of public expenditure. Some political cycle models seek to enhance our understanding of the causes of systematic alternation of different political parties implementing different policies, either by focusing on the policy constraints faced by the incumbent’s policy space,Footnote 34 or by the challenger’s adaptive strategy in search of an electoral advantage over the incumbent.Footnote 35
As empirical observations have demonstrated, incumbent vote swings, electoral volatility and alternation of power have been important features of India’s political system, both at the national and the subnational level.Footnote 36 Although scholars disagree on the causes and magnitude of its effects, the fiscal dimension of such a phenomenon has not been studied sufficiently. The political business cycle literature tends to suggest that politicians increase expenditure during election years in anticipation of a potential alternation of power in the electoral cycle.Footnote 37 Given India’s experience with anti-incumbency voting at the subnational level over the last two decades, we anticipate that a rapid alternation of power is likely to increase public expenditure, as new governments are likely to attempt to bribe voters with additional public expenditure. Likewise, we want to determine whether the fact that an election is taking place is likely to alter the expenditure of state governments. We anticipate that increases in expenditure are likely to increase during the year in which an election is scheduled.
These cyclical variables can be expressed as the following hypotheses:
HYPOTHESIS 8: The alternation of political power from one political party to another results in greater expenditure on public service goods.
HYPOTHESIS 9: The timing of an election increases the likelihood that there will be increases in expenditure on public service goods.
Data Sources And Variables
The political data used in this article are drawn from a mixture of sources. Nevertheless, the primary source of information about our independent political variables is drawn from the Election Commission of India (ECI).Footnote 38 The ECI releases the most reliable data available in India for all of the national parliamentary elections and provincial state legislatures. Using the results published by the ECI, we have also operationalized other political variables, those that we have labelled as being institutional. First, we have measured the margin of victory between the largest recipient of votes and the second largest recipient of votes in any given state assembly election in India. In the dataset, the number represents the percentage point difference between the highest recipient of votes and the second largest recipient of votes.
In addition, we have measured the effective number of parties in a state assembly using the widely used Laakso and Taagepera index (N). This index measures the effective number of parties. We have used two measures, one for the effective number of political parties holding seats in the state assembly, and another for the effective number of parties receiving votes in a given state assembly election.Footnote 39 The index is often utilized in the measurement of the effective number of parties in an assembly and it is derived from a basic formula:

where N represents the effective number of parties and p represents the proportion of votes obtained by a political party in a given election or the number of seats occupied by a political party in an assembly.
Using N, we have developed two indicators to measure the effective number of parties in a state assembly. Using electoral data provided by the ECI and other sources, we have calculated the effective number of parties using two indicators: (a) the percentage of votes obtained by all the political parties in a given state assembly election (n votes) and (b) the percentage of seats occupied by any given political party in a state assembly (n seats).Footnote 40
The substantive control variables in our model are political in nature. The political data, primarily dealing with the ideological component of state governments, have been derived from an analysis of the outcome of state legislature (called Vidhan Sabha) elections in India, 1980–2000. The cyclical election data (timing of elections) have also been derived from data from the ECI. Both ideological and cyclical data have been coded in our dataset as dummy variables.
This article examines the expenditure outcomes from India’s sixteen major states from 1980 to 2000. Our range of states is limited by two factors: either the existence of a particular state during the period under examination (1980–2000) or the availability of data for the entire twenty-year period. Although the initial choice could pose a problem of selection bias, we find that other similar econometric studies of India’s states have attempted to study a similar number of states.Footnote 41 More importantly, we were constrained in using a longer time series because the data that we are using, in their currently defined disaggregated form, are not available before 1980.Footnote 42
Our dependent variables are total expenditure for a given public good as a proportion of total subnational government expenditure. Most previous analysis has focused on one or two public goods; in contrast we have constructed a database for a comprehensive range of public goods and social expenditures.Footnote 43 The primary source of state government expenditure data is the Reserve Bank of India’s annual review of state government finances. This review appears annually in one of the monthly issues of the Reserve Bank of India Bulletin. For the sake of ease of computation, we have supplemented this expenditure data with data from the Centre for Monitoring of the Indian Economy, published in its Profile of States.
The model’s specification of this dataset will be detailed below. This broad range allows us to assess the determinants of a whole host of government functions from the provision of social and human capital (such as education or health), traditional public goods (for instance, social security) and other developmental functions (for example, agriculture or irrigation).Footnote 44
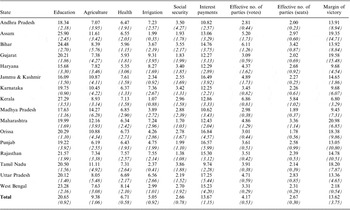
Overall, the entire dataset, which we called POLEX-India, is available for other researchers to use to accommodate their specific empirical needs.Footnote 45 However, for the sake of simplicity, we have decided to provide a synopsis of our most striking findings. Table 1 provides means and standard deviations for the principal variables in our dataset. Following the example provided by Besley and Burgess, these data are averaged for the 1980–2000 period and arranged by state.Footnote 46 Table 1 provides the reader with a summary of the wide degree of cross-sectional variation. For instance, the first three columns in Table 1 consider several of our critical dependent variables (education, health and agriculture). Column 1 of Table 1 shows that some states in India (particularly Kerala, Assam, Bihar and West Bengal) devote a larger proportion of the budgetary expenditure to education than others (such as Haryana and Jammu and Kashmir). The differences are striking. For instance, Kerala devotes 27.29 per cent to education and Haryana 15.68 per cent.
Summary of Main Variables

Note: The first six columns show the mean total expenditure for a given public good in each state as a proportion of total subnational government expenditure in that state, with standard deviations in parentheses below each value.
Column 2 of Table 1 also shows that there is variation in state government expenditure on agriculture. The state of Madhya Pradesh has mean expenditures on agriculture of 14.27 per cent of total state government expenditure. In contrast, the state of Punjab (one of India’s leading agricultural producers) spends only 6.19 per cent of its budget on agriculture. Likewise, Column 3 of Table 1 shows that the state of West Bengal allocates 8.14 per cent of total state government expenditure to health, whereas the state of Haryana allocates only 5.35 per cent.
Two additional expenditure variables (social security and irrigation) also reveal a great degree of inter-state variation.Footnote 47 Elsewhere we have found evidence that state government expenditure on education decreased dramatically from the early 1980s to the late 1990s. The decline is notable in the states of Kerala, Punjab and Andhra Pradesh.Footnote 48 Likewise we find evidence that there is a steady erosion of state budgetary expenditure on agriculture and health.
Table 1 also shows data for one additional source of state government expenditure. Column 6 in Table 1 shows data for interest payments on servicing public debt. Although not a public service, this expenditure has gradually become one of the dominant destinations for state government expenditure.Footnote 49 As Table 1 shows, there is a great deal of inter-state variation as well. More alarming, though, is the upward trend in servicing debt as a destination for state government expenditure across time.Footnote 50
Previous efforts to analyse state-level effects in India have provided a mixture of political, media and economic variables. Our article departs from this work by providing an exclusive focus on political variables, not necessarily because they may be the most salient, but because they are the least analysed in the political economy treatises of this type.
Columns 7–9 in Table 1 illustrate the degree of inter-state variation in three of our independent variables (i.e., effective number of parties gaining votes, effective number of parties gaining seats and margin of victory). As discussed in the previous section, we have classified these three independent variables as being institutional political variables.
The Model
Given that we have variables that are coded differently (those that are dummy variables and those that are not), we have decided to analyse the data using two separate techniques to treat each data type. For the purposes of our analysis we have grouped the explanatory variables that are ideological and cyclical separately from those that deal with institutional effects. The primary reason for doing this is that the former have been coded as dummy variables in our dataset. In order to simplify the presentation of our results we have dropped those dependent variables that showed little to no variation over the years across different states. Doing so reduced our number of dependent variables to five (education, health, social security, agriculture and irrigation). In aggregate terms, these sources of state government expenditure amount to 44.45 per cent of total state government expenditure.
We have also clustered the data per state per year if there appears to be little or no variation between years in the same state. We highlighted changes in expenditure that increased or decreased significantly, by more than 4 percentage points as a proportion of total state government expenditure, over at least two consecutive years.
Doing a simple clustering of the massive dataset facilitated our understanding of the trends across different states across time. It appears that there are three distinctive periods in which a great deal of activity is taking place in terms of sudden increases or decreases in at least one of the dependent variables. The three time periods where we noticed widespread transformation in state government expenditure were: 1980–85, 1985–90 and 1990–2000. This periodization appeared to replicate itself across all of the states for the selected period.
Our dataset has been constructed as pooled, cross-sectional panel data. For all the empirical exercises, we consider a sample of sixteen states in India and data organized annually over a twenty-year period (from 1980 to 2000). Therefore, the time series is discrete and continuous, although it may contain some seasonal variation occasioned by the electoral cycle at the subnational level.Footnote 51
An analysis of time-series cross-sectional (TSCS) data opens up several procedural options. Box–Jenkins ARIMA or Maximum Likelihood estimation procedures are commonly used methods. Nevertheless, we have nine independent variables (both institutional and ideological) and nineteen dependent variables (pertaining to public expenditure in different public services). At first glance, this would suggest that we are working with a pooled time-serial dominance (T > N) dataset which utilizes a large vector of independent and lagged dependent variables that feature the presence of between-units effects.Footnote 52 Based on the suggestion of Stimson, whenever one is confronted with a dataset where the explanatory variables are dynamic, there are between-unit effects, and the design is time dominant, and timewise autocorrelation is present, then it is desirable to use a generalized least squares autoregressive moving average (GLS ARMA) estimation.Footnote 53
Nevertheless, we are aware that there is an ongoing econometric debate as to whether time-series analysis using a GLS ARMA estimator is the most appropriate modelling technique for a dataset with the characteristics described above.Footnote 54 Most prominently, Beck and Katz have long argued for the Ordinary Least Squares (OLS) estimation technique, due to its simplicity and relative efficiency compared to other alternatives. In fact, largely based on their recommendation, a great deal of the comparative political economy work that uses TSCS datasets – including some of the work that we are building upon – instead tends to use a fully pooled time-series error correction model, estimated through OLS with Panel Corrected Standard Errors (PCSE) to remedy for panel heteroscedasticity and spatial correlation.Footnote 55 Addressing the need for a practical consensus on the appropriate econometric estimators, Beck and Katz have argued that the GLS correction for spatially correlated errors ‘leads to very bad estimates of standard errors’.Footnote 56 In their view, other options, such as panel weighted least squares (PWLS), ‘is only more efficient than OLS in the presence of high heteroskadisticity and low contemporaneous correlation of the errors’.Footnote 57 In the light of potential gains in computational ease, they added their recommendation ‘that TSCS researchers use OLS in preference to PWLS unless there are strong grounds for choosing PWLS’, namely in the rare cases ‘when the gains from complication exceed the costs of moving away from well-understood methods’.Footnote 58
Still, it is worth considering that pooled OLS estimates have also been found to be inefficient, inconsistent and biased in distributed lagged models.Footnote 59 Given the complexity of our dataset and following the processes undertaken on similar work in this area, we have opted for a generic panel data regression model using pooled OLS estimates, rather than a distributed lag model using GLS ARMA estimation.Footnote 60
In order to capture the effects of our institutional, ideological and cyclical policy variables on inter-state public expenditure differences among selected Indian states and to gauge the changes within individual states across time most effectively, we have constructed a generic panel data regression model to be described below. The basic model to identify the effect of political cycles and political institutions on the public goods expenditure choices of states can be specified as follows:

where Zi ,t is state government expenditure on a particular public service in state i during year t, αi and βt are state and year fixed effects, t is a vector of time-dependent institutional and ideological independent variables, δC is a vector of time-dependent ideological and cyclical control variables, and T is a vector of time effects. The model utilizes lagged endogenous variables for public services.
Empirical Findings And Theoretical Implications
Our tests show some fascinating results, some of which confirm previous expectations, while others confound them. Before we outline our empirical results, a few words follow about the tests that we ran. The significance of lagged expenditure in all of the regression results that follow highlights the importance of politicians’ lack of room to manœuvre in radically altering public expenditure on public services. Nevertheless, within that context of constrained budgetary expenditure, we observe the importance of political variables in modifying the allocation of fiscal expenditure on public services. We estimated the models using PCSE. We have presented the results with lagged and non-lagged dependent variables, and corrections for first-order autoregressiveness and heteroscedasticity. As we developed the time series, we first tested for non-stationarity using unit root tests (Dickey–Fuller) and we then tested for co-integration. Moreover, in order to avoid multicollinearity, we have presented the results for two types of indicators of the effective number of parties. In each of the tables, we have presented results, labelled Model 1, for the effective number of parties (N) calculated from the percentage of seats attained by all political parties in the state assembly. Correspondingly, we have presented the results, labelled Model 2, for the effective number of parties (N) calculated from the percentage of votes obtained by all political parties in a given state assembly election. What do these tests find?
Education
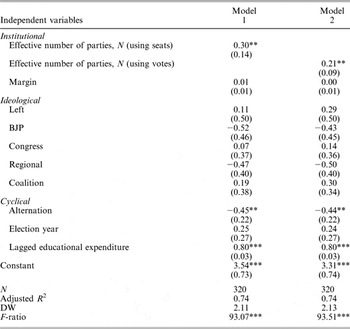
Education constitutes the largest single source of budgetary expenditure at the subnational level (around 21 per cent) and hence deserves special scrutiny (see Table 2). There is a statistically significant positive relationship between effective number of parties (irrespective of whether we use seats or votes as a method for calculating this given independent variable) and education expenditure. Thus, increased party competition in terms of the number of parties, increases the expenditure on education. In our view, party competition increases the political uncertainty of public officials; this may contribute to overbidding vis-à-vis other parties, as each party seeks to appeal to the voters by increasing education investment. Yet if a party changes hands – our cyclical variable – educational expenditures decline. This would suggest that a party soon after winning elections reduces education expenditure unless the structure of the political space has a large number of parties. In an environment of strong fiscal constraints, this would make sense. Since education is such a large expenditure category, the ruling party after defeating its rival re-allocates some of the funds for other uses, either to reward its political supporters or to address campaign promises. Yet, in an environment of intense party competition, the ruling party is also forced to increase education expenditure precisely because it needs to show its commitment to education for the next election in an uncertain political environment.
Pooled Times Series Cross-Sectional Analysis with State Expenditure on Education as a Dependent Variable

Note: Standard errors in parentheses. *** p < 0.01, ** p < 0.05, * p < 0.1.
Somewhat counter-intuitively, ideology’s effect on education expenditure, while consistent with our expectations, is statistically insignificant. Thus, ideology does not seem to matter for expenditure on education, a result contrary to the argument that left parties like the CPI (M) will make significant investment in education.
Health
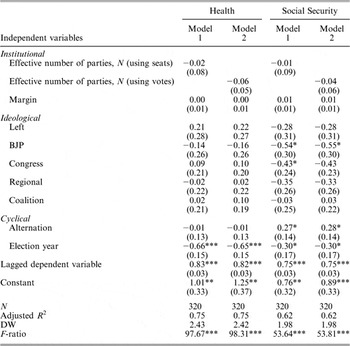
Health investment constitutes the third largest budgetary category, after education and agriculture, making it a significant component of the state’s budget (around 6.2 per cent on average). Health expenditure is significantly affected by only one cyclical variable, the timing of elections, in a negative way (see Table 3). Thus, governments reduce expenditure on health around the time of elections. On the face of it, this result seems difficult to explain, until one evaluates the nature of the investment in health. Health spending is in government health clinics, in family health, categories that are not very visible to voters and take a long time to take effect as their effects on health outcomes are realized over the long term. Interestingly, the poor quality of public health provision in India, combined with a strong and widespread private health network, suggests that politicians’ incentives to invest in health remain low, as the demand for health facilities, despite its negative quality, is low. Thus, parties, in an election year may re-allocate that money to other, more visible, goods. We must admit that this is a puzzle but in terms of why does not a political entrepreneur emerge claiming to invest and improve the health services provided by the government. Ideology, or even other institutional factors, has no effect on health expenditure.Footnote 61
Pooled Time Series Cross-Sectional Analysis with State Expenditures on Health and Social Security as Dependent Variables

Note: Standard errors in parentheses. *** p < 0.01, ** p < 0.05, * p < 0.1.
Agriculture and Irrigation
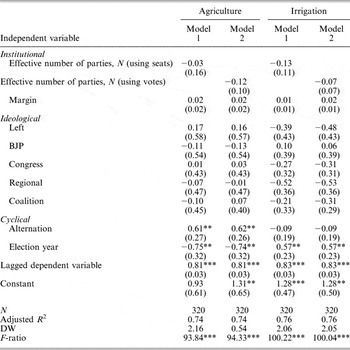
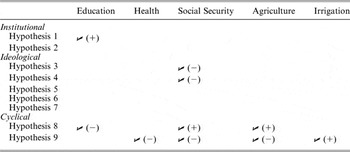
Public service expenditure on agriculture and irrigation tend to have an important symbolic and material effect in India, primarily because the majority of India’s population (around 65 per cent) lives in rural areas and relies on farming for its sole source of personal income. Predictably, then, agriculture constitutes the second largest category of expenditure (9.3 per cent), while irrigation and flood control are also significant, around 5.0 per cent. First, only cyclical variables have an effect on the public provision for agriculture and irrigation, and no ideological or institutional variables play any role (see Table 4). Yet one can see an interesting divide within the agricultural sector, with the timing of elections having a positive and significant effect on irrigation, but a significant negative effect on agricultural investment. With alternation of power, after elections, agriculture benefits from a significant jump in public investment, suggesting that all parties signal their commitment to agriculture as soon as they come to power. Yet, during elections, agricultural investment declines significantly, accompanied by an increase in expenditure on irrigation. This suggests that public officials are taking money away from agriculture and shifting it to irrigation at the time of elections. This would make sense, since irrigation constitutes the single largest expense of farmers, is a lumpy and visible good and, given India’s inconsistent monsoon seasons, it is very important for agricultural productivity. Overall, agriculture expenditure is used by public officials to respond both to economic distress, as well as to satisfy their primary constituents, farmers, who play a major role in elections at the subnational level. Table 5 offers a summary of our initial hypotheses and their confirmation based on our analysis of empirical data.
Pooled Time Series Cross-Sectional Analysis with State Expenditures on Agriculture and Irrigation as Dependent Variables

Note: Standard errors in parentheses. *** p < 0.01, ** p < 0.05, * p < 0.1.
Summary of the Confirmation of Various Hypotheses Based on Income Expenditure Type

Notes: ✓ represents confirmation of the hypothesis due to the presence of statistically significant results. Symbols (+) and (−) represent, respectively, a positive or a negative regression coefficient.
Hypothesis 1: An increase in the effective number of parties represented in a state legislature results in an increase in public service expenditure.
Hypothesis 2: Political parties that have obtained a large margin of victory in a state assembly election are less likely to increase its expenditure on public services than political parties that have obtained a slim victory.
Hypothesis 3: A state government controlled by a national centre-left party, like the Congress Party, prefers to spend more on certain types of public service expenditures, such as agriculture and irrigation, compared to other political parties.
Hypothesis 4: A state government controlled by a national centre-right party, like the BJP, prefers to spend less on certain types of public service expenditures, such as health and education, compared to other political parties.
Hypothesis 5: A state government controlled by a national leftist party, like the CPI (M), prefers to spend more on certain types of public service expenditures, such as health and education, compared to other political parties.
Hypothesis 6: A state government controlled by a regionalist political party, like the DMK, the AIADMK, the AGP, prefers to spend more on certain types of public service expenditures, such as health and education, compared to national political parties.
Hypothesis 7: Coalition governments have greater expenditures on public service goods than non-coalition governments.
Hypothesis 8: Alternation of political power from one political party to another results in greater expenditures on public service goods.
Hypothesis 9: The timing of an election increases the likelihood that there will be increases in public service goods expenditure.
What are the theoretical implications of our empirical findings? The first impression is that states’ burden of debt servicing, in the form of interest payments, has increased significantly in 1980s and 1990s India. This, in our assessment, has put phenomenal downward pressure on public investment in both economic and social expenditure. How does this larger negative pressure affect specific collective goods? In the study of Western democracies, stronger evidence of partisan rather than of electoral cycles is confirmed. In a parliamentary democracy like India with ideologically inclined politics, a similar expectation would be natural. Yet, strikingly, we find very little effect of party ideology in shaping government choices, except for social security. This negative result – or the dog that did not bark – is very striking, given the expectation that left parties which rule many important states in India are likely to invest in education and health. In contrast, the effective number of parties, an institutional variable describing the extent of party competition in a polity, and election timing and the alternation of power explain much of the movement in public expenditures. Interestingly, and importantly, the results are not coherent across different forms of expenditure, raising doubts about the claims of earlier studies for the unilateral effect of election cycles or of institutions.
While the effective number of parties has a strong, positive effect on education expenditure, which constitutes close to 21 per cent of total expenditure across states, the timing of elections negatively affects health investment, and spending on social security and agriculture. At face value, this finding challenges the political business cycles conclusions, which suggest that politicians increase public investment during elections. We speculate that this has to do with the nature of the expenditure, as spending on health and agriculture does not have a directly visible effect on organized groups. Yet expenditure on irrigation is sensitive to the timing of elections, suggesting that irrigation is a ‘lumpy’ public good useful to a well-defined social class of farmers, a crucial group in electoral victories at the subnational level in India; this explains the positive effect of election timing on irrigation investment.
These findings, we further argue, call for more theoretical work on the mechanisms that underlie these effects. We can no longer look at public expenditure in aggregate ways, but need to specify and fine-tune political effects across different types of public goods. Secondly, and even more importantly, these findings raise an important question: why are institutional and cyclical variables more important than ideology? Conventional wisdom favours the role of convergent global pressures in reducing the effect of partisan effects. In our view, this explanation, while necessary, is not fully sufficient in explaining the precise variation that we see. In this article we build upon, but also go beyond, a Polanyi-type theoretical explanation for a greater effect of party competition, alternation of power, and election timing in the context of declining revenues and greater pressure on expenditures. We suggest that both economic pressures, and more importantly, political uncertainty (re-election possibilities) shape politicians’ decisions about which public expenditure to fund and support. From the demand side, public officials respond to constituency and social pressure in the face of declining public services (a Polanyi mechanism), responding to needs and demands for compensation. In addition, and crucially from the supply side, political uncertainty fuelled by increased party competition, and a heightened anti-incumbency factor in India, leads politicians to pay attention to the timing of elections and cyclical factors. Thus, we complement the emphasis on demand-side mechanisms found in the literature with an emphasis on the incentives of subnational politicians in manipulating the output of governments. Political uncertainty and fiscal constraints work together in shaping choices about public expenditure in India.
Appendix: Variables Used In The Aggregate Level Analysis
Dependent Variables
The dependent variables consist of the percentage of state government expenditure on social and economic services as a proportion of total government expenditure. The data on state government expenditures has been calculated from yearly data provided by the Reserve Bank of India Bulletin over a twenty-year period (1980–2000). The RBI divides expenditure data into two broad categories: developmental and non-developmental. In this study, in order to facilitate replication of our results, we have disaggregated the state level data for developmental expenditures using RBI categories. The RBI subdivides developmental expenditure into two further categories: social services and economic services. Overall, we have ten categories for social services and nine for economic services. The social services include: education, health, water supply and sanitation, housing, urban development, welfare for scheduled castes and tribes, labour-related welfare, social security, nutrition, and natural disaster relief. Among economic services we have gathered data for the following: agriculture, rural development, special areas programmes, irrigation and flood control, electricity, industry and minerals, transport and communications, science and technology, and general economic services (primarily tourism and civil supplies).Footnote 62
Independent variables
Election. 1 = An election was held in a given state assembly in India. 0 = No election was held.
Left. 1 = A leftist party, Communist Party of India (Marxist), controls the state assembly. 0 = CPI/CPI-M does not control the state assembly.
BJP. 1 = The Bharatiya Janata Party (BJP) controls the state assembly. 0 = The BJP does not control the state assembly.
Congress. 1 = The Congress Party of India controls the state assembly. 0 = The Congress Party does not control the state assembly.
Regional. 1 = A regionalist party controls the state assembly. 0 = A regionalist party does not control the state assembly.
Coalition. 1 = A state assembly is ruled by a coalition government. 0 = A state assembly is not ruled by a coalition government.
Effective number of parties (votes). The effective number of parties in a state assembly in India, using votes (n votes)), was calculated using the widely used Laakso and Taagepera’s index (N). See Markku Laakso and Rein Taagepera, ‘Effective Number of Parties: A Measure With Application to West Europe’, Comparative Political Studies, 12 (1979), 3–27. We have double-checked and updated data available in the Statistical Supplement to the special issue on political parties and elections in Indian states.Footnote 63
Effective number of parties (seats). The effective number of parties in a state assembly in India, using seats (nseats), was calculated using the popular Laakso and Taagepera index (N). See previous entry.Footnote 64
Margin of victory. Percentage difference between the largest recipient of votes and the second largest recipient of votes in all state assembly elections in India, 1980–2000.Footnote 65
Alternation. 1 = A state assembly is ruled by a political party that is different from the political party that ruled the state prior to the last state assembly election in that state. 0 = A state assembly is ruled by the same political party that ruled in that state prior to the election.