


1. Introduction
In the advanced economies, pension funds provide the main source of income for the retired and elderly. At year-end 2023, OECD countries had \$63.1 trillion of assets earmarked for retirement, an immense amount almost equal to the annual GDP of these countries. Pension funds are a major player in the international financial markets, owning almost a quarter of the full global market portfolio (MSCI, 2024). This article focuses on one organisational aspect of the pension market: are larger pension funds more (or less) successful in generating higher net returns than smaller ones? Or, in other words, what is the optimal size of pension funds when viewed from the perspective of investment returns? Pension fund members demand and expect that the pension funds manage their investments safely and aim to achieve high net returns without running irresponsible risks. Are they operating in the most efficient and effective manner? Given the vast size of pension funds and their impact on the economy and the financial markets, it is remarkable that this topic has received only limited attention in the literature.
Most studies which investigate the relationship between pension fund size and performance find significant economies of scale. Recent examples are Jang and Wu (Reference Jang and Wu2025) for overall performance, Andonov (Reference Andonov2024) for alternative assets, and De Vries et al. (Reference De Vries, Kalfa, Timmermann and Wermers2025) for private assets and real estate. A counter-example is Andonov et al. (Reference Andonov, Bauer and Cremers2012), who find overall diseconomies of scale. A key way in which pension funds reduce costs is by utilising economies of scale in investment costs. Substantial gains arise from cost savings related to internal management instead of costly intermediation, as in fund-in-fund investments (e.g., Dyck and Pomorski, Reference Dyck and Pomorski2011, Reference Dyck and Pomorski2016; Andonov, Reference Andonov2024; De Vries et al., Reference De Vries, Kalfa, Timmermann and Wermers2025). Investment cost gains for larger pension funds are not only due to these managerial strategy choices but also to their superior bargaining power in negotiations over external investment costs (Bauers et al., Reference Bauer, Cremers and Frehen2010; Andonov et al., Reference Andonov, Bauer and Cremers2012; Dyck and Pomorski, Reference Dyck and Pomorski2016; De Vries et al., Reference De Vries, Kalfa, Timmermann and Wermers2025).
Besides lower costs, larger pension funds may have higher gross returns. The primary reason large pension funds achieve higher returns is their greater allocation of investments to alternative assets, particularly private equity (Dyck and Pomorski, Reference Dyck and Pomorski2011). Larger pension funds have better access to top-performing private equity partnerships (Dyck and Pomorski, Reference Dyck and Pomorski2016), illiquid investments (Keskiner and Matthias, Reference Keskiner and Matthias2018), and infrastructure (Della Croce, Reference Della Croce2012). They have greater ability to diversify investments internationally (Dyck and Pomorski, Reference Dyck and Pomorski2011) and access to more asset classes (Cai et al., Reference Cai, He and He2010). The latter authors also observe that large institutional investors are better informed, and Dyck and Pomorski (Reference Dyck and Pomorski2016) similarly find a greater ability to bridge the information asymmetries and better information processing capacity. These authors also find evidence of organisational diseconomies in pension funds, as their size-performance relationship with respect to private equity is concave at the very large end. Organisational diseconomies may be due to managerial problems in large and complex institutions: bureaucracy, additional layers of management and over-hiring (Chatterton et al., Reference Chatterton, Smyth and Darby2013), greater luxury in terms of buildings and salaries, extra costs due to scarcity of qualified staff, and additional costs related to overconfidence (Griffin and Tversky, Reference Griffin and Tversky1992). Bauer et al. (Reference Bauer, Cremers and Frehen2010) mention increasing costs of communication between the different sections of the organisation and the costs involved in monitoring employees, including managers. The motivation and commitment of employees may be lower in a large organisation, as they contribute relatively little to the overall success of the organisation, resulting in lower productivity, while a lack of a clear overview of budget and liquidity in a large firm may cause inefficient spending with respect to recruitment, equipment or offices (Canback et al., Reference Canback, Samouel and Price2006).
Liquidity problems or adverse price responses on transactions is the second kind of disadvantage of large pension funds (Bikker et al., Reference Bikker, Spierdijk and van der Sluis2007; Bauer et al., Reference Bauer, Cremers and Frehen2010; Andonov et al., Reference Andonov, Bauer and Cremers2012; Jansen et al., Reference Jansen2025). Liquidity issues are also frequently reported in the mutual fund literature (see Section 2). The key question is whether such large pension fund inefficiencies outweigh the basic effect of monotonically declining fixed costs and other advantages of these funds.
Previous research shows that pension fund economies of scale in investment costs in the Netherlands are significant, for 2012–19 ranging from 10 per cent for smaller funds to 5 per cent for the largest ones, down from 22 per cent over the 1995–2004 period (Bikker and Meringa, Reference Bikker and Meringa2022; Bikker and De Dreu, Reference Bikker and de Dreu2009). However, this research did not address economies of scale in investment returns. This is what we will examine in this article: what is the performance of large pension funds compared to smaller funds, and what are the underlying causes of eventual differences in success – not only for the total portfolio but also for each of the separate asset classes? Our approach is as follows. First, we break down pension funds’ net returns into six asset classes to determine the long-term returns and volatility of these classes. We focus on the period from 2012 to the first quarter of 2025 (2012–25Q1) because the asset category data for this period have been disaggregated more than in previous years. We also look at the previous period from 2007 to 2011, enabling us to examine the financial crisis. Second, we break down the net returns into five pension fund size classes, and then into asset categories. This provides further insight into economies of scale across asset classes as well as the impact of investment allocation to asset types on overall returns. Third, we apply regression analysis to explain net returns by size, investment costs, investment allocation, and fund-specific characteristics. Additionally, we conduct these regression analyses for each of the individual asset categories.
Unlike smaller pension funds, large pension funds invest more in risky and complex asset categories such as private equity and hedge funds. These investments come with higher costs but are also expected to yield higher returns. For instance, ABP, the largest Dutch pension fund, pays a staggering €2.8 billion in investment costs, of which €0.7 billion is for performance fees for external parties investing on their behalf in assets like private equity (ABP, 2024 Annual Report). Other large Dutch pension funds pay similarly large amounts. Besides asset category allocation, there is another investment strategy choice in this context: obtaining more or less external expertise and information. Across pension funds, differences in strategies as observed from their performance fees are huge. Broeders et al. (Reference Broeders, van Oord and Rijsbergen2019) show that pension funds that pay performance fees do not achieve higher returns than those that do not pay such fees, especially when adjusted for risk. In this article, we examine the impact on returns of this element of investment strategies.
Our first empirical result, based on direct observation of the data, is the absence of economies of scale in net investment returns, in contrast to most findings in the literature. Also, the majority of our regression estimates do not reveal significant economies of scale. Overall, we conclude that scale has hardly any or no influence on net returns. A second outcome is that, over 2012–25Q1, the more complex and more risky major alternative assets, mainly consisting of private equity, had higher returns than public equity, which in turn was much more rewarding than real estate, while fixed income has the lowest returns. The better return for private equity compared to public equity holds for the entire pension sector as well as for the large pension funds, but not for the medium-sized and smaller funds. Larger funds allocate more investment to the more complex asset categories (private equity and real estate) so that the higher returns of these assets contribute to higher returns for large funds. Third, large pension funds have higher returns on private and public equity as well as real estate compared to smaller funds. This may reflect that large funds have better market analysis departments and benefit from their size in terms of cost economies of scale, market power, better information, and better access to better-performing partnerships. These two direct and indirect size-related positive effects contribute to the net returns of larger pension funds. Fourth, larger pension funds’ returns on fixed income are only half that of smaller pension funds. As ‘fixed income’ is the interest rate risk hedge portfolio, we investigate the impact of ‘liability interest rate risk hedging’ further. A consequence of the lower fixed income returns of the larger pension funds is that the level of their overall investment returns does not deviate from that of the smaller pension funds. Of course, this outcome is due to both the investment and hedging strategies of the pension funds.
Generally, we do not observe statistically significant positive effects of performance fees, which are primarily paid by larger pension funds. This is surprising, as it indicates that external investment advice provided in return for performance fees does not add extra value. Exceptions are positive coefficients for private equity and hedge funds in our unweighted regressions, which focus on the smaller pension funds. On the other hand, performance fees were also not statistically significantly negative. Hence, the performance fee costs were earned back roughly: external investment advice may pay for itself.
This article is structured as follows. Section 2 provides a literature review, and Section 3 offers an overview of the pension system in the Netherlands. Section 4 presents data on returns and calculates returns across asset categories and size classes, and investment portfolio risks by size classes. Section 5 investigates liability interest rate risk hedging, and Section 6 presents regression analyses of net returns to identify any possible economies of scale and the effects of cost components, particularly performance fees, for the entire portfolio as well as by asset categories. Section 7 describes a hypothetical simulation of large-scale consolidation to explore potential returns gains, and Section 8 presents our conclusions.
2. Literature review
Research on whether economies of scale exist in net returns of pension funds, and on their underlying causes, is quite limited, in contrast to the extended literature on economies of scale in mutual funds (Blake et al., Reference Blake, Rossi, Timmermann, Tonks and Wermers2013). This sparse literature is likely due to the confidentiality of pension funds’ data on investments, returns and costs, which are not publicly available. Overall, most investigations report a positive relationship between size and performance. Jang and Wu (Reference Jang and Wu2025) investigate US pension funds over 1990–2018, employing an immense tax data set on private pension plans. They find positive economies of scale in performance, with the strongest for defined benefit (DB) funds due to their larger size, but also for defined contribution (DC) funds. DC funds outperform DB funds over the entire size distribution. Note that performance is defined here as returns, net of not only investment costs but also administration costs, which differs from the analyses in this article. Administrative costs in particular have strong economies of scale which improve the net returns of large funds.
Dyck and Pomorski (Reference Dyck and Pomorski2011) use data from the United States, Canada, Australia, and Europe, provided by CEM Benchmarking, a global benchmarking firm based in Toronto.Footnote 1 They find that the largest pension funds outperform smaller ones, with a third to a half of the gains arising from cost savings related to internal management, where costs are less than one third of those for external management. The superior returns of larger pension funds are primarily due to increased allocations to alternative investments and greater returns from this asset class. In private equity and real estate investments, large pension funds benefit from both lower costs and higher gross returns. The ability to leverage economies of scale depends on the governance of pension funds, with better governance leading to higher benefits from economies of scale. Also using CEM data, Dyck and Pomorski (Reference Dyck and Pomorski2016) find significant economies of scale in private equity portfolios, partly explained by the ability to avoid costly intermediation, as in fund-in-fund investments, and partly by a greater ability to bridge information asymmetries. The superior negotiating power of larger pension funds results in lower investment costs. Costs explain one third of larger investors’ outperformance. Larger pension funds have also greater gross returns, which is probably due to better access to top-performing private equity partnerships, and to better information and information processing capacity. The authors find concavity in the size-performance relationship, pointing to organisational diseconomies.
Based on CEM data, Andonov (Reference Andonov2024) reports significant economies of scale in all five alternative asset classes he considers. Private equity portfolios have lower returns than traditional public equities, but may provide diversification benefits. In contrast to Harris et al. (Reference Harris, Jenkinson, Kaplan and Strucke2018), Andonov finds that more layers of financial intermediaries are associated with lower net returns. Smaller pension funds have higher returns (due to lower costs) if they invest in only one alternative asset class. Bauers et al. (Reference Bauer, Cremers and Frehen2010) find that in the United States, pension funds have much lower costs than mutual funds, that larger scale brings cost advantages and that larger funds have more bargaining power. On the other hand, they observe liquidity limitations for larger funds: these funds are less able to respond rapidly to news because of their relatively illiquid stocks. In line with this, Jansen et al. (Reference Jansen2025) also find adverse price responses to transactions.
Not all studies find economies of scale in net returns. Also using CEM data, De Vries et al. (Reference De Vries, Kalfa, Timmermann and Wermers2025) investigate DB pension funds and find no economies of scale in gross returns of public assets, but they do observe significant economies of scale in net returns of private equity and real estate, resulting from economies of scale in investment management costs after switching to internal management. For larger pension funds, they find greater bargaining power in negotiating external managers’ fees because they have the option to switch to internal management at a lower cost. Furthermore, larger funds have greater access to better-performing actively managed funds. Andonov et al. (Reference Andonov, Bauer and Cremers2012) examine investment costs and returns using CEM data. They find significant positive economies of scale in investment costs, particularly for alternative assets. But diseconomies of scale in returns are more pronounced, cancelling out cost economies of scale. All three components of active management (asset allocation, market timing, and security selection) exhibit substantial diseconomies of scale directly related to illiquidity. Their results suggest that larger pension funds would have done better if they had invested more in passive mandates without frequent rebalancing across asset classes. González et al. (Reference González, van Lelyveld and Lučivjanská2020), however, find that actively managed mandates improve pension fund performance when they are paired to long-term holdings. They find a (weak) positive relationship between pension fund size and active investment management as well as a tendency of larger funds to hold assets for a longer period. Smits (Reference Smits2011) finds no significant relationships between pension fund size and absolute performance, relative performance and funding ratios. Performance is mainly influenced by other factors, such as longevity risk and inflation risk. Keskiner and Matthias (Reference Keskiner and Matthias2018) report higher returns for larger pension funds. However, they also reference an unpublished study by CEM Benchmarking, with which they collaborate on data, that found no such link for a large sample of US pension funds.
Blake et al. (Reference Blake, Rossi, Timmermann, Tonks and Wermers2013) investigate how asset management is organised for the standard asset classes. They observe a shift from centralised to decentralised pension fund management. One trend is to replace generalist balance managers with specialists who outperform their higher fees. Improved performance comes at the expense of optimal diversification, however. Another trend is to replace single managers within asset classes with multiple competing managers who follow various strategies to reduce diseconomies of scale (adverse price effects on transactions) as pension fund assets grow over time relative to capital markets. They use private data from UK pension funds provided to a performance monitoring organisation known as CAPS.
The overall findings for pension funds are as follows: (1) most but not all publications in the literature find economies of scale in net pension fund returns, (2) most papers report lower investment costs for larger pension funds, (3) some papers mention greater bargaining power for larger funds, (4) larger pension funds experience cost savings related to internal management, (5) larger pension funds have better access to top-performing private equity partnerships,(6) better information and information processing capacity, (7) larger funds face adverse price effects from investment transactions, (8) larger funds suffer from organisational diseconomies, (9) larger funds have increased allocations to alternative investments and achieve greater returns in this asset class, and (10) pension funds generally have higher investment performance, and lower costs, than mutual funds.
The actively managed mutual funds are also major investors with \$73.0 trillion in assets worldwide (2024), roughly equal to the pension market (Investment Company Institute, 2025). Mutual fund investors can withdraw their money easily, while pension members cannot, which has a great impact on the investment management behaviour of these two types of institutions. Nevertheless, it is interesting to look at the mutual fund sector as well. Investors in mutual funds chase past performance even though fund performance is not consistent. This phenomenon is referred to as the fundflow-performance puzzle. Berk and Green’s (Reference Berk and Green2004) theoretical model provides a rational explanation for this puzzle and relies on the key assumption of decreasing returns to scale. Chen et al. (Reference Chen, Hong, Huang and Kubik2004), Edelen et al. (Reference Edelen, Evans and Kadlec2007), and Yan (Reference Yan2008), for instance, find significant diseconomies of scale and show that liquidity is the underlying factor. However, recent studies point out an endogeneity issue in the return-to-scale test: manager skill is an omitted variable that is likely to be correlated with both fund size and performance. Pastor et al. (Reference Pástor, Stambaugh and Taylor2015) exclude this omitted variable by using fund-fixed effects (FE) in their model estimates for the entire sector and, nevertheless, find decreasing returns to scale. Their explanation is that the larger the active mutual fund industry is, the more difficult it is to outperform passive benchmarks. Further, they prove that the active management industry has become more skilled over time. These positive skill effects on returns have been eroded by the decreasing returns to scale of this growing industry, due to the liquidity or adverse price effect problem. Building on Pastor et al., Zhu (Reference Zhu2018) also shows a significant negative impact of fund size on performance. Further, she finds widespread suboptimal behaviour from managers in that they actively manage more than their optimal amount. Pastor et al. (Reference Pastor, Stambaugh, Taylor and Zhu2022) confirm the robustness of the significant negative impact of fund size on performance, as found in the previous studies. The next two papers use exogenous shocks to avoid endogeneity bias. Using mergers as shocks, McLemore (Reference McLemore2019) finds evidence of diseconomies of scale, mainly caused by liquidity. Using changes in Morningstar ratings as shocks, Reuter and Zitzewitz (Reference Reuter and Zitzewitz2021) do not find evidence of negative economies of scale; indeed, they find the opposite for small-cap equities and sector funds.
Elton et al. (Reference Elton, Gruber and Blake2012) report no relationship between size and performance, which they attribute to the effect of the diseconomies of returns to scale being offset by cost scale economies. Ferreira et al. (Reference Ferreira, Keswani, Miguel and Ramos2013) carry out an international study and show diseconomies of scale for US funds but not for non-US funds. Dyck et al. (Reference Dyck, Lins and Pomorski2013) find that active funds perform better outside the United States, especially in emerging markets, where active managers face less competition. We conclude that in the mutual fund sector, most, but not all, research finds evidence of a negative relationship between fund size and performance. Underlying causes are mainly the liquidity problem and organisation diseconomies, while negative effects are in part cancelled out by the positive cost scale economies effect. The diseconomies of scale found in mutual funds are the opposite of those found in most studies of pension funds.
Our research adds to the existing literature in four key ways. First, part of the cited literature is rather outdated, making recent research a valuable addition. Second, existing studies primarily focus on international datasets, so research based on a Dutch dataset provides a useful new perspective. Third, the international data collections from CEM Benchmarking and the OECD survey only include data from large pension funds. A comprehensive comparison across different size classes necessitates a more extensive data collection, such as the one presented in this article. Finally, our dataset includes detailed information on the returns and the various cost margins across the asset types considered (across all sizes), which allows analysis of the relationships between returns and managerial strategies and the reliance on external investment information and advice.
3. The pension system in the Netherlands
The institutional structure of the Dutch pension system is made up of three pillars, similar to the situation in most other developed countries. The first pillar consists of a public pension scheme and is financed on a pay-as-you-go basis. It offers a basic flat-rate pension to all retirees and aims to link the benefit level to the statutory minimum wage. The pension benefit age moved gradually from 65 years in 2012 to 67 years in 2024 and will increase to 70 years by 2070, dynamically linked to life expectancy. The second pillar provides former employees with additional income from a collective, contribution-based supplementary scheme. The prescribed pension age is 68 years (2025). The third pillar is composed of tax-deferred personal savings, which individuals undertake at their own initiative and expense. The supplementary or occupational pension system in the Netherlands is typically organised as a funded DB or collective DCs scheme. The benefit entitlement is determined by years of service and a reference wage, which in more recent years has been linked to wages over the years of service. The second pillar takes the public scheme benefits into account, while the third pillar’s tax deduction allowance takes the sum of the total benefits from the first two pillars into account. Supplementary schemes are usually managed collectively by pension funds.
Three types of pension funds exist. The first is the industry-wide pension fund, which is organised for a specific industry sector (e.g., civil servants, construction, health care, transport). Participation in an industry-wide pension fund is mandatory for all employers in the relevant sector, with a few exceptions. An employer may opt out if it establishes a company pension fund that offers a better pension plan to its employees. Where a supplementary scheme is agreed by employers and employees, managed by either a company pension fund or an industry-wide pension fund, employee participation is mandatory, as governed by collective labour agreements. The third type of pension fund is the occupational pension fund, organised for a specific group of professionals, such as the medical profession or notarial profession.
The Dutch pension fund system is comprehensive. In 2022, almost 89 per cent of the employees were covered, but a growing number of self-employed people need to arrange their own retirement savings. At year-end 2023, total pension fund assets in the Netherlands amounted to 147.1 per cent of GDP, ranking the Dutch pension system, in terms of this ratio, among the largest in the developed world (OECD, 2024).
The government, employees, and employers have agreed to transform the pension system from (collective) DB into a type of DC system, resulting in the Future of Pensions Act. This legislation revises a number of aspects of the Dutch pension system and entered into force on 1 July 2023. Pension funds currently have until 2028 to switch to the new system. Pension funds may opt for a collective buffer to soften setbacks, though this would be smaller than those allowed under the DB regime.
4. Data on returns and analysis
This section begins by presenting pension fund data on returns and continues with a number of brief analyses based on these data. We base the calculations in this article on quarterly data from 464 pension fundsFootnote 2 for the period 2007Q1–2025Q1,Footnote 3 as reported to the supervisory authority, De Nederlandsche Bank (DNB). We exclude pension funds that did not report all the necessary items for our research, which are mainly pension funds in their years of ‘liquidation’. Pension funds included in our dataset need not report all types of assets. Small funds in particular may not invest in complex assets, or they may report over only a part of the considered period, for instance in case of termination or if they have been established in later years. The number of pension funds decreases sharply over the period under review, from 452 in 2007 to 164 in 2025Q1, reflecting the consolidation process of recent decades. The pension funds held investments amounting to €1,581 billion at the end of 2025Q1.
This research analyses net returns, which consist of gross returns, including dividends, minus all investment costs. Unless stated otherwise, we do not deduct administrative costs, as Jang and Wu (Reference Jang and Wu2025) do, as we focus on investment performance only. Table 1 presents the weighted average net returns and risks of pension fund asset classes by quarter for two periods: before and after the 2012 change in the definition of investment assets. Before 2012, the returns of private equity, hedge funds and commodities were not reported. Asset amounts are reported with the exception of private equity
Risk and returns of pension fund asset classes (by quarter, as a percentage)

Table 1 Long description
Quarterly percentages are listed for average returns, standard deviation, and average return divided by standard deviation, each split into 2007 to 2011 and 2012 to 2025Q1. Fixed income has average returns of 1.69 and 0.28, standard deviation of 6.15 and 6.05, and average return divided by standard deviation of 0.27 and 0.05. Public equity has average returns of minus 0.55 and 2.53, standard deviation of 10.36 and 6.71, and average return divided by standard deviation of minus 0.05 and 0.38. Real estate has average returns of minus 0.13 and 1.53, standard deviation of 7.68 and 5.12, and average return divided by standard deviation of minus 0.02 and 0.30. Private equity, hedge funds, and commodities have values only for 2012 to 2025Q1: private equity average return 2.74, standard deviation 5.94, and average return divided by standard deviation 0.46; hedge funds average return 0.24, standard deviation 8.32, and average return divided by standard deviation 0.03; commodities average return minus 0.02, standard deviation 10.00, and average return divided by standard deviation minus 0.00. Total has average returns of 0.93 and 1.27, standard deviation of 4.77 and 4.72, and average return divided by standard deviation of 0.19 and 0.27.
Source: DNB, own calculations.
Over the 2012–25Q1 period, net investment returns from public equities, alternative investments (mainly private equity) and real estate have been much higher than those from fixed-income assets (mainly bonds). Private equity has the highest returns, at more than 2.74 per cent per quarter, followed by public equities (2.53%). This is contrary to what Andonov (Reference Andonov2024) has found for an international sample of pension funds, where private equity returns were lower than those of equities. These asset classes, along with real estate (1.53%), have much higher returns than fixed income (0.28%). The much smaller hedge funds and commodities categories achieve, respectively, low or even negative returns over this period. We define risk as the fluctuation in net returns over time, with the standard deviation being a simple and widely used measure. Of course, this is only a poor indicator of risk, particularly for illiquid assets, such as real estate and hedge funds, where spurious autocorrelation in the returns leads to underestimation of risk (Couts et al., Reference Couts, Gonçalves and Rossi2024). The standard deviations of commodities and hedge funds are highest, followed by the larger asset classes of public equities (6.71%), private equity and fixed income (6.05%), and real estate (5.12%). Risk-adjusted investment returns (simply defined as net returns divided by the standard deviation) are highest for private equity, public equity, and real estate, followed by fixed income, hedge funds, and commodities. The overall average return in this period of 1.27 per cent per quarter implies an annualised net return of 5.18 per cent.
We apply the paired t-test and the Wilcoxon signed-rank test to find whether the averaged returns of the asset classes over 2012–25Q1 differ mutually. Both tests reveal that private equity returns differ significantly from the other returns except for public equity at the 95 per cent confidence level. Public equity returns are higher than fixed income and hedge fund returns but do not differ significantly from real estate returns.
The earlier period, 2007–11, is obviously characterised by the financial crisis that started in 2007/08. Fixed income investments performed well due to falling interest rates (see Figure 2), while equities and real estate achieved negative returns on average. On an annual basis, the average total return at the time amounted to 3.77 per cent.
4.1. Differences in asset allocation across size classes
The asset allocation differs systematically across pension funds with various sizes of assets under management. Table 2 shows the average asset distribution over 2012–25Q1 for five different size classes. We apply two approaches for this breakdown of pension funds. The first, the fixed size class sorting approach, is based on the size distribution in 2018Q1, with 2018 being the middle year of our sample period. In this approach, pension funds remain in the same size class throughout the entire period, so that the results are related to a fixed set of pension funds in each class. Class 1 pension funds had at least €28 billion in total assets in the first quarter of 2018. This group includes the five largest pension funds, referred to as the ‘large pension funds’. Class 2 includes pension funds with total assets between €10 billion and €28 billion, Class 3 includes pension funds with total assets between €2.8 billion and €10 billion, Class 4 includes pension funds with total assets between €0.8 billion and €2.8 billion, and Class 5 includes pension funds with total assets below €0.8 billion, all measured in 2018Q1. In that quarter, the number of pension funds in the respective size classes are 5, 12, 34, 60, and 79. In the fixed size class sorting analysis, these size class numbers appear to be constant over time, except for Class 5, as some small pension funds were taken over (i.e., merged) or terminated. Pension funds which did not exist in 2018Q1 are excluded in this approach. Here, the focus is on ‘in each size class we analyse the same pension funds over time’. This approach has advantages but also disadvantages. Consistently outperforming funds grow either through organic growth or through mergers or by taking over other funds.Footnote 4 Therefore, funds with a larger asset size in 2018Q1 may have had relatively good performance up to that time, which may cause upward bias in the estimated returns of the larger size classes. Further, funds that ceased to exist in 2018Q1 have been dropped out by construction, but could have provided useful information. Therefore, we also apply a second approach. In the dynamic size class sorting analysis, we start with the same size classes as in 2018Q1, but adjust them over time with the average asset growth percentages. Now, the focus is on ‘we analyse the pension funds over time, in size classes which are relatively similar over time’. In this analysis, the number of pension funds per class varies as funds move from one class to another due to either relatively strong or weak growth. Pension funds from earlier years which no longer existed in 2018Q1 are included, as are new funds established after that quarter.
Distribution of assets by dynamic size classes, as a percentage

Table 2 Long description
Asset allocations are listed as percentages by size classes, Largest, 2, 3, 4, Smallest, plus a Total column and a Total, in billion euro column, for two periods: Average allocation over 2012 to 2025Q1 and Average allocation over 2007 to 2011. For 2012 to 2025Q1, fixed income is 46.6, 59.8, 59.0, 60.9, and 63.5 across Largest to Smallest, with Total 52.1 and Total, in billion euro 694; public equities are 30.3, 29.1, 28.8, 30.8, and 31.0, with Total 29.9 and 398 billion euro. In 2012 to 2025Q1, real estate is 10.8, 7.1, 8.5, 6.5, and 4.6, Total 9.4 and 125 billion euro; private equity is 9.4, 3.3, 2.7, 1.2, and 0.4, Total 6.6 and 88 billion euro. In 2012 to 2025Q1, hedge funds are 2.5, 0.7, 0.9, 0.5, and 0.4, Total 1.8 and 24 billion euro; commodities are 0.4, 0.0, 0.1, 0.1, and 0.2, Total 0.2 and 3 billion euro. Total in billion euro by size class for 2012 to 2025Q1 is 788 for Largest, 254 for 2, 187 for 3, 73 for 4, and 43 for Smallest, with overall Total, in billion euro 1.344. For 2007 to 2011, fixed income is 43.5, 53.6, 52.1, 57.1, and 63.9 across Largest to Smallest, with Total 48.4 and 326 billion euro; equities are 37.3, 36.2, 34.6, 32.5, and 29.5, with Total 36.0 and 243 billion euro. In 2007 to 2011, real estate is 12.6, 7.4, 10.2, 7.7, and 4.6, Total 10.6 and 72 billion euro; hedge funds are 4.1, 2.3, 2.0, 1.8, and 1.4, Total 3.2 and 21 billion euro; commodities are 2.6, 0.6, 1.1, 0.9, and 0.6, Total 1.8 and 12 billion euro. Total in billion euro by size class for 2007 to 2011 is 384 for Largest, 106 for 2, 101 for 3, 52 for 4, and 32 for Smallest, with overall Total, in billion euro 674.
Source: DNB, own calculations.
Notes: The size classes are explained in the text. Class 1 comprises the largest pension funds and Class 5 the smallest. Other investments amount to €1 billion. This table is based on the dynamic size class sorting approach. Over 2012–25Q1, any differences with fixed size class sorting analysis are in decimal points only, except for the smallest size classes where the largest difference is 1.6 percentage points for fixed income.
Turning to Table 2, we observe that over 2012–25Q1 the allocation to public equities is almost the same for all five classes, at around 30 per cent of total assets. At over 10 per cent, the real estate share of large pension funds is twice as large as that of smaller funds (4–6%). In addition, the share of private equity, hedge funds and commodities is substantial among large pension funds at almost 11 per cent and minimal among small funds (1–2%), as also noted by Andonov (Reference Andonov2024). Fixed income is the largest investment category, averaging 47% for the largest pension funds and around 60 per cent for all other size classes. Clearly, large pension funds invest more in high-yield and riskier asset classes. We have omitted the ‘other investments’ category, as this asset class is very small (1%).
The bottom panel shows the average allocation over 2007–11. The shares of fixed income were lower, while private equity was then attributed to public equity. That asset, along with hedge funds and commodities, had higher shares in those years.
4.2. Differences in returns across size classes
We break down the net returns of the various asset classes for the years 2012–25Q1 by the five size classes as introduced above. We do so by calculating the weighted average net returns of assets x in size class y (rx,y) defined according to:
 \begin{align}
{r_{x,y}}=\sqrt[N]{\Bigg\langle\prod_{t=1}^{N}\left\{1+{\mathop\sum_{i=1}^{P^{y}}}r_{i,x,t}\times\left[\frac{TA_{i,t}}{\mathop\sum_{i=1}^{P^{y}}TA_{i,t}}\right]\right\}
\Bigg\rangle-1}
\end{align}
The two summations are over the pension funds i from size class y, i running over 1, …, Py, where Py is the total number of pension funds in class y. This equation describes the geometric mean returns of asset x of pension fund i over the quarters of 2012–25Q1, using ri,x,t which is the net return of asset x of pension fund i in time period t. Each return ri,x,t is thus weighted by the total assets of pension fund i (TAi,t) as the share of the total assets of all pension funds in that period.Footnote 5 Weighting implies, of course, that larger pension funds within each size class carry more weight than smaller ones.
4.2.1. Fixed size class sorting
For the years 2012–25Q1, Table 3 presents the calculations of the net returns of the various asset categories by the five size classes according to the fixed size class sorting approach. Total returns per asset class are derived by (arithmetic) weighting across the rows, the weight being the pension funds’ share in the respective asset investments. The overall total returns are derived likewise. Total returns per size class (‘Total reported’) are derived by (arithmetic) weighting of the reported total returns of all pension funds in the respective class – thus not based on a formula such as (1). First, we look at the final row in the top panel: ‘total, reported’, over 2012–25Q1. For the largest pension funds, the total quarterly return averages 1.30 per cent, whereas they hover between 1.21 and 1.23 per cent for the other funds. The asset-weighted average returns across pension fund size classes appear to be fairly flat, but the largest funds have returns which are somewhat higher than those of the other funds. We apply the paired t-test and the Wilcoxon signed-rank test to find whether the averaged total reported returns of the size classes over 2012–25Q1 differ mutually. The null hypothesis of equal total returns over the size classes has not been rejected for any possible pair. Different statistical tests appear in Tables 6 and 8, where regression models use size to explain net returns from, for example, the pension funds. They confirm the outcome that economies of scale in total returns are absent.
Average quarterly returns of pension funds by size class based on fixed size class sorting

Table 3 Long description
Average quarterly returns are listed by asset type across size class columns, Largest, 2, 3, 4, Smallest, plus Total, for three periods: 2012 to 2025Q1, 2007 to 2011, and 2007 to 2025Q1. For 2012 to 2025Q1, Fixed income ranges from 0.20 for Largest to 0.40 for 3, with Total 0.28; Public equities are 2.51 to 2.54 across size classes, with Total 2.53; Real estate ranges from 1.25 for 4 to 1.62 for Largest, with Total 1.53. For 2012 to 2025Q1, Private equity is 3.03 for Largest, 2.03 for 2, 2.33 for 3, 1.96 for 4, and 1.55 for Smallest, with Total 2.74; Hedge funds are 0.27 for Largest, 0.90 for 2, minus 0.63 for 3, 0.51 for 4, and minus 0.27 for Smallest, with Total 0.24; Commodities are minus 0.06 for Largest, 0.08 for 2, 0.17 for 3, 0.32 for 4, and minus 0.21 for Smallest, with Total minus 0.02. For 2012 to 2025Q1, Total, reported is 1.30 for Largest, 1.21 for 2, 1.23 for 3, 1.22 for 4, 1.21 for Smallest, and 1.27 for Total; Idem, excl. administrative costs is 1.29 for Largest, 1.19 for 2, 1.20 for 3, 1.17 for 4, 1.14 for Smallest, and 1.25 for Total. For 2007 to 2011, Fixed income ranges from 1.51 for Largest to 1.97 for Smallest, with Total 1.69; Equities range from minus 0.83 for 2 to minus 0.46 for Largest, with Total minus 0.55; Real estate ranges from 0.29 for 2 to minus 0.58 for 4, with Total minus 0.13; Total, reported ranges from 0.83 for 3 to 1.04 for Smallest, with Total 0.93. For 2007 to 2025Q1, Fixed income ranges from 0.56 for Largest to 0.82 for 4 and Smallest, with Total 0.66; Equities range from 1.58 for 2 to 1.71 for Largest, with Total 1.68; Real estate ranges from 0.75 for 4 to 1.13 for Largest, with Total 1.07; Total, reported ranges from 1.12 for 3 to 1.18 for Largest and Total.
Source: Own calculations with DNB data.
Notes: The residual category ‘other investments’ has been omitted. Size class classification as in Table 2. Class 1 comprises the largest pension funds and Class 5 the smallest.
Second, between brackets, for 2012–25Q1, Table 3 also presents net total reported returns, exclusive of administration and other non-investment costs, which is a kind of overall performance measure.Footnote 6 As these non-investment costs have economies of scale, the negative impact on the returns is smallest for the large pension funds (a decline in return of 0.01 percentage points during 2012–25Q1) and largest for the smallest ones (−0.07 percentage points). For that period, overall, larger pension funds perform better, but the differences between the size classes are still never statistically significant.
Third, we look at the returns by asset category. The weighted average returns on both real estate and private equity of large pension funds (first column) are consistently higher than the averages for all other four size classes. Apparently, large funds achieve higher average returns due to better market analysis, risk management and their size (cost economies of scale, market power, better information, and better access to better-performing partnerships). This also holds for public equity returns, but the differences are very limited for this asset type. Since all returns are net, the results suggest that the high performance fees paid by the largest pension funds (for private equity in particular) do (at least) pay for themselves. We investigate this in more detail in Sections 6 and 6.1. Over 2012–25Q1, hedge funds and commodities did not provide satisfactory returns, neither for large nor for small pension funds.
Fourth, whereas private equity has the highest returns for the entire pension sector and for the largest pension funds compared to other asset types, this does not hold for the other four medium-sized and smaller fund classes: for these classes the returns on public equity are consistently higher. Apparently, it is too difficult for smaller pension funds to extract high returns from private equity as the large funds are able to do, whereas they are fairly successful at achieving good returns from public equity. Of course, they may obtain diversification benefits from private equity.
In contrast to returns on public and private equity and real estate, the average returns on fixed income, by far the largest asset class, tell a different story with respect to the return-size relationship: at 0.20 per cent per quarter, the returns of the largest funds are hardly half of those of the other funds, ranging from 0.36 to 0.40 per cent. Fixed income is an asset portfolio which is not primarily aimed at returns, but also addresses liability matching. It consists of bonds, mortgage loans, credits, short-term claims, liquidity, and all derivatives in these categories. Pension funds often hedge the interest rate risks arising from their liabilities by taking fixed receiver positions in long-dated interest rate swaps. Fixed income also serves to manage liquidity risks, for instance due to margin calls. Both functions are investigated and explained for Dutch pension funds by Jansen (Reference Jansen2025), Jansen et al. (Reference Jansen, Klingler, Ranaldo and Duijm2024) and Jansen and Tuijp (Reference Jansen and Tuijp2021). In Section 5, we use available liability interest rate risk hedge data to investigate the impact of hedging on fixed income returns.
The paired t-test and the Wilcoxon signed-rank test have been applied to find whether the averaged returns of the size classes over 2012–25Q1 differ significantly. Both tests reveal that the private equity returns of the large pension funds differ significantly from those of the other size classes. The hedge fund returns for the two smallest size classes have a significant mutual difference according to the Wilcoxon test only. For the other assets, the null hypothesis of equal returns over the size classes has not been rejected.
During the financial crisis period (2007–11), returns on equity and real estate were negative on average, but the falling interest rates (see Figure 2) boosted fixed income returns (see the middle panel in Table 3). We observe a number of similar trends for this period as in later years: higher average equity and real estate returns (i.e., less negative) for larger pension funds, as well as lower fixed income returns, all compared to the other funds (with the exception of real estate returns of size Class 2). Average total returns for the five size classes were roughly the same, but the largest pension funds are at the lower end (and below the average returns), due to their higher shares of equity and real estate investments during this period. The trends mentioned above are, of course, also observed for the entire period under review (2007–25Q1; see the lower panel in Table 3). This also holds for the level of total returns across the pension fund sizes: even flatter than ever.
Technical issues and statistical choices underlie the figures of Table 3. The most significant choice is related to the quality and extensiveness of reporting by smaller pension funds, which was lower, especially in the earlier years of our sample. For these funds, the incidence of zero returns for individual asset classes is relatively high. Since these zeros largely indicate that there is nothing to report, for example, in the absence of any investment in the category in question, we do not include the zeros in the average returns. This has an upward effect on the returns of the smallest pension funds compared to the situation where the (uninformative) zeros would be taken into account.
There is also the ‘other investments’ category, which is small as an asset class (1% of total investments) but in terms of returns is a collection of costs and benefits that are often not attributable to individual asset classes. Pension funds sometimes use this category to reconcile their total returns and individual asset reports. Furthermore, ‘other investments’ includes (1) short-term receivables and loans held for margin calls or derivatives exposure, (2) inflation-linked swaps, which are a combination of inflation-linked bonds, (3) structured notes, (4) total return swaps, and (5) hedging products not allocated to one of our defined asset categories (such as in overlay portfolios).
4.2.2. Dynamic size class sorting
In the dynamic size class sorting, all pension funds are allocated to five size classes for each quarter based on their asset size in the previous quarter. As a consequence, funds may move between size classes over time due to superior (or inferior) returns and, hence, outperforming (or underperforming) asset growth. This affects Equation (1), where the summations become time-dependent, with funds from more than one size class moving between classes: Py becomes Py(i). The corresponding ‘dynamic’ long-term average returns are presented in Table 4. As stated, for 2018Q1 the size classes are identical to those in the fixed size class sorting case, but they increase (or decrease) proportionally with the overall asset value growth over time for later (or earlier) quarters.
Average quarterly returns of pension funds by size class based on dynamic size class sorting

Table 4 Long description
Average quarterly returns are listed by asset type and pension fund size class, with columns for Largest, 2, 3, 4, Smallest, and Total, across three time periods. For 2012 to 2025Q1, Fixed income ranges from 0.20 for Largest to 0.44 for Smallest, Public equities are about 2.48 to 2.54, Real estate declines from 1.62 for Largest to 1.19 for Smallest, and Private equity ranges from 1.85 for size class 4 to 3.03 for Largest. In the same period, Hedge funds include negative values for size class 3 at minus 0.91 and for Smallest at minus 0.33, while Commodities range from minus 0.06 for Largest to 0.22 for size class 4. Total reported for 2012 to 2025Q1 is 1.30 for Largest, 1.19 for size classes 2 and 4, 1.24 for size class 3, 1.25 for Smallest, and 1.27 for Total. For 2007 to 2011, Fixed income ranges from 1.51 for Largest to 2.14 for Smallest, Equities are negative across all size classes from minus 0.46 to minus 0.77, and Real estate ranges from 0.31 for size class 2 down to minus 0.77 for Smallest; Total reported ranges from 0.87 to 1.10 with Total at 0.93. For 2007 to 2025Q1, Fixed income ranges from 0.56 for Largest to 0.90 for Smallest, Equities range from 1.60 to 1.71, Real estate ranges from 0.65 for Smallest to 1.13 for Largest, and Total reported ranges from 1.10 for size class 4 to 1.21 for Smallest with Total at 1.18. Some cells include additional values in parentheses alongside the main return values.
Source: Own calculations with DNB data.
Over 2012–25Q1, the number of jumps between the size classes for the five size classes are 0, 4, 23, 73, and 78, respectively. Note that each jump has been counted twice: a pension fund moving from size Class 2 to Class 3 counts in both class numbers. The returns in this table are fairly similar compared to the fixed size class sorting approach of Table 3: differences between Tables 3 and 4 are shown in Table 4 within parenthesis. They are identical for the largest size class where, over all periods, no single fund has entered or left this size class. The total returns by asset class are also exactly identical in each investment category (last column) and for all three subperiods. Note that the number of (small) funds in the current sample is slightly higher than in the ‘fixed’ case. Now, all funds terminated before 2018Q1, or established after that quarter, have been included. The newly added funds do not weigh heavily in the total returns by asset class. However, they do have some, though minor, effects on the total reported returns by size class for the 2012–25Q1 period: a 0.04 percentage points higher average total return for size Class 5 (shown within brackets) and smaller changes in Classes 2–4, roughly cancelling out each other. For this period, changes in the separate ‘cells’ are generally limited: somewhat higher for the class of the smallest pension funds, and somewhat higher for the private equity and hedge funds, where average returns are of a higher level. The maximum difference is 0.47 percentage points for average alternative asset returns in size Class 5, and −0.28 percentage points for hedge funds in Class 3. All other differences are −0.13 percentage points or less in absolute terms. The changes are smallest in relative terms for the most important asset classes: fixed income and public equity (0.05 percentage points at most). Changes were relatively larger for 2007–11, where more (small) pension funds are included, and the size classes change more compared to the fixed approach. The largest difference is −0.30 percentage points for the average real estate returns in Class 5.
We have applied the paired t-test and the Wilcoxon signed-rank test again, now to find whether the averaged returns of Tables 3 and 4 over 2012–25Q1 differ significantly. The tests reveal that only hedge fund returns of size Class 3 differ significantly. Private equity returns of size Classes 2 and 3 differ according to the Wilcoxon test. For all other assets and size class combinations, the null hypothesis of equal returns over the two tables has not been rejected.
We do not see any clear pattern in the return changes between Tables 3 and 4. Overall, the differences between the two approaches are limited, and it is difficult or impossible to find any systematic shift.Footnote 7 This outcome suggests that our approaches are rather robust. This conclusion holds particularly where, in our analyses, we mainly use the average total returns, either over assets, which are identical across these two methods, or over size classes, which hardly change.
4.3. Differences in risk
The question remains whether larger pension funds, in addition to aiming for higher returns on equities, real estate and private equity, also took higher risks during 2012–25Q1. To phrase it differently, do they have a better investment strategy, or better conditions, in the sense of higher risk-adjusted returns? Figure 1 illustrates the data by showing average quarterly returns for pension funds for the five size classes. The average returns reported in Tables 1, 3, and 4 hide large fluctuations over time, as is evident from this figure. The outliers reflect the realised risk the funds were exposed to through their investments.
Net returns and risk over time by pension fund size classes (as a percentage; 2012–25Q1).
Notes: Size class classification as in Table 2. Class 1 comprises the largest pension funds and Class 5 the smallest.

Figure 1 Long description
The horizontal axis label, 2012 Q1 to 2025 Q1. The vertical axis label, Return, percent. The vertical axis range shows 11 percent, 6 percent, 1 percent, minus 4 percent, minus 9 percent, minus 14 percent. Legend label, Size Class, with entries 1, 2, 3, 4, 5. Grouped bars appear at each quarter from 2012 Q1 through 2025 Q1, with five bars per quarter corresponding to size classes 1 through 5. The tallest positive bars appear around 2015 Q1 and 2024 Q1, reaching near the 11 percent tick. The deepest negative bars appear around 2021 Q1, reaching near the minus 14 percent tick. Other quarters show mixed positive and negative grouped bars, with many groups clustered between minus 4 percent and 6 percent.
For the present analysis, it is particularly noteworthy that the fluctuations are roughly the same for the five size classes. The average return in absolute values is smaller for the largest pension funds at 3.62 per cent, while it is larger for the smallest pension funds, at 3.85 per cent. Also, the standard deviation of the largest funds (at 0.043) is slightly smaller than that of the smallest funds (0.047). Zooming in on details, the most negative quarterly return of the largest pension funds at −11.7 per cent is slightly less negative than that of the smallest funds, at −13.8 per cent. The lower risk for the largest pension funds is remarkable, given their investment in riskier assets. Their investment risk management seems to be adequate.
For alternative assets like private equity, the market values do not typically reflect mark-to-market valuations (see, for instance, Jansen and Tuijp, Reference Jansen and Tuijp2021; Couts et al., Reference Couts, Gonçalves and Rossi2024). The larger share of investment in private equity held by larger pension funds may affect the risk comparison in Figure 1. Therefore, we also repeat this figure without private equity; see Figure A1 in the appendix. The average return in absolute values (3.49% versus 3.85%, for largest versus smallest), the standard deviations (0.043 versus 0.047) and the most negative quarterly return (−12.2% versus −13.8%) indicate that the conclusion of a slightly lower risk for the largest pension funds also holds here.
5. Liability interest rate risk hedging
The significantly lower returns on large pension funds’ fixed income investments are remarkable. It is in clear contrast to the higher returns on average from other asset categories. We investigate the possible impact of liability interest rate risk hedging, which involves using financial products to offset the risks of adverse interest rate movements. For an investment fund this would refer to its fixed income portfolio, but for a pension fund interest rate hedging refers in the first place to its liabilities towards its pension beneficiaries. Interest rate movements first affect future pension obligations, which have an average duration of 18 years in the case of Dutch pension funds, and second affect the value of the fixed income investments, with an average duration of just above 11 years. Note that interest rate risk of investments and obligations are opposite: they cancel each other out in part. Risk can be managed through hedging or diversification strategies that reduce a portfolio’s effective duration or negate the effect of rate movements. Interest rate swaps are most often used to hedge against interest rate risk (Jansen, Reference Jansen2025). Note that in the Netherlands, the supervisory authority prescribes a liability discount rate based on European swaps trade data, which is different from other countries (see, e.g., Andonov et al. Reference Andonov, Bauer and Cremers2017). Since 2015, pension funds in the Netherlands are required to report their interest rate hedge positions, based on a prescribed, uniform definition since 2017. The interest rate hedging is defined as the ‘change in market value of interest-sensitive assets and derivatives for a 1% decrease across the entire curve, divided by the change in the present value of liabilities for this 1% shock’. This definition aligns more with ‘liability interest rate risk hedging’ and differs from the common intuition that lower interest rate hedging mechanically implies lower fixed income returns through reduced bond exposure. In our data, hedging is defined relative to the interest sensitivity of liabilities, where the latter is similar across size groups, as the duration of liabilities does not varies much, see Table 5. As the returns are expressed as percentage returns on the fixed income portfolio, cross-size class differences in fixed income returns primarily reflect differences in desired asset and liability management exposure. Fixed income returns do not reflect differences in portfolio size or asset allocation and should not be directly interpreted as a performance metric, as the main goal of pension funds is to suitably accommodate their liabilities, not to maximise returns. Hence, differences in fixed income returns across fund size categories largely reflect differences in interest rate exposure, not necessarily differences in economies of scale or investment skill. Over 2015–25Q1, the weighted liability interest rate hedging for the largest pension funds was 38.7 per cent versus 51.5–61.4 per cent for the other four size classes (see the first row in Table 5). Apparently, large pension funds have a different interest rate hedging strategy for their obligations compared to smaller pension funds. Note that large pension funds not only hedge less but that their automatic hedge of obligations, their fixed income portfolio, is also relative smaller than that of other funds. These hedging data provide only limited information about the interest rate hedging of pension funds’ fixed income investments. One approach to gain some insight is to examine pension funds’ losses and gains, across size classes, in quarters with large interest rate movements. We will focus on losses of pension funds during the quarters 2022Q1–22Q3 when interest rates suddenly spiked, for the 11-year interest rate from 0.35 to 3.08 per cent (18-year interest rate: from 0.53% to 2.87%), to find the impact of the interest rate hedging strategies. Figure 2 shows the 11-year interest rate over time, with the quarters where the interest fell significantly shaded light and the quarters where it rose significantly shaded dark. The average hedging numbers in the first row in Table 5 are also representative of 2022Q1, the first quarter with a significant interest rate hike. Incidentally, hedging increased gradually over time, with the simple average hedging rising from 47 per cent in 2015Q1 to 54 per cent in 2022Q2 and reaching 78 per cent in 2025Q1.
The 11-year SWAP market-based interest rate (2007–25Q1).
Note: Light shading for interest rate falls larger than 0.3 percentage points and dark shading for interest rate hikes larger than 0.5 percentage points.

Liability interest rate hedging and the impact of interest rate changes on fixed income returns and funding ratio (2015–25Q1)

Table 5 Long description
Size categories are Largest, 2, 3, 4, and Smallest. Interest rate hedging on average in percent is 38.7, 61.4, 51.5, 58.0, and 56.5. Average fixed income returns in percent over 2012 to 2025Q1 for comparison are 0.20, 0.36, 0.40, 0.39, and 0.39. Over the full period 2015 to 2025Q1, average fixed income returns are minus 0.22, minus 0.12, 0.01, minus 0.05, and minus 0.06; without large interest rate raises they are 1.09, 1.35, 1.24, 1.30, and 1.28, with effects of large interest rate raises of minus 1.31, minus 1.47, minus 1.23, minus 1.35, and minus 1.32. Without large interest rate falls, average fixed income returns are minus 0.80, minus 1.16, minus 0.94, minus 1.06, and minus 1.00, with gains of large interest rate falls of 0.58, 1.04, 0.95, 1.01, and 1.26. Average change of funding ratio in percent over the full period 2015 to 2025Q1 is 0.32, 0.13, 0.47, 0.37, and 0.19; without large interest rate raises it is minus 0.23, minus 0.23, minus 0.09, 0.00, and minus 0.18, with gain of large interest rate raises of 0.55, 0.37, 0.56, 0.37, and 0.37. Without large interest rate falls, average change of funding ratio is 1.34, 0.98, 1.44, 1.17, and 0.99, with effect of large interest rate falls of minus 1.02, minus 0.85, minus 0.97, minus 0.8, and minus 0.8.
Source: Own calculations with DNB data.
To investigate the impact of liability interest rate hedging on the fixed income returns, we calculate for the 2015–25Q1 period the net returns of fixed income over (1) all quarters, (2) all quarters but without the quarters where the 11-year interest rate falls by more than 0.3 percentage points, and (3) all quarters but without the quarters where the 11-year interest rate rises by more than 0.5 percentage points. We observe that fixed income returns over this ‘full’ period are predominantly negative, specifically for the (two) larger size classes (see Table 5). First, we consider the effects of the interest rate increases. Without these interest rate hikes in this period, fixed income would be solid at well over 1 per cent per quarter. Lower hedging of the obligations of the largest pension funds did not harm their fixed income more than that of the other funds: average loss of 1.31 percentage points for large funds versus 1.23–1.47 percentage points for the others, hence not a deviating outcome. Next, we calculate the impact of the interest rate decreases. Without these rate falls in this period, fixed income would be around minus 1 per cent per quarter, which implies a gain of only 0.58 percentage point for the large pension funds versus around 1 percentage point for the others. This seems an unexpected result, but, of course, hedging focuses on the obligations.
To further investigate the impact of hedging on the obligations, we calculate the effect of interest rate changes on the funding ratio. The average funding ratio improved by around 0.3 percentage point per quarter, mainly due to increases in interest rates. Without the larger interest rate rises, the funding ratio would even fall on average (see lower panel of Table 5). Lower hedging of the largest pension funds implies higher rises of their funding ratios: a gain of 0.55 percentage points for the larger pension funds versus 0.37 for most of the other funds, in line with expectations. Without the larger interest rate falls, the funding ratio would increase substantially. Lower hedging of the largest pension funds imply higher increases of their funding ratios in the absence of interest rate falls; these falls thus imply a loss of 1.02 percentage points of the largest pension funds versus 0.80–0.97 for the others, as expected.
All in all, it is difficult to see how the largest pension funds’ deviating liability hedging strategies have affected their fixed income. We leave that for further research.
6. Regression analysis of net returns
We use a regression model to better understand the factors that determine the net returns of pension funds. This model explains the returns in percentages per pension fund and per quarter by several factors: (i) the size of the fund, expressed as the logarithm of the assets invested, lagged one quarter; (ii) the investment costs, divided into management costs, performance fees and transaction costs, as a percentage of total assets, where performance fees are lagged; (iii) the riskiness of the investments, measured by the average standard deviation of the returns; (iv) the funding ratio, lagged; (v) the wealth of the members (assets divided by the number of members), lagged; (vi) the average age of the members; (vii) the percentage of the pension plans that are of the DB type; (viii) two dummy variables for company pension funds and occupational pension funds, respectively; and (ix) the distribution of assets across various asset classes as a percentage of total assets. The dummy variables for industry-wide pension funds and the share of fixed income assets have been omitted to avoid multicollinearity. Some variables are lagged, always one quarter, to avoid reversed causality. This holds particularly for performance fees, as they are higher when net returns are higher and vice versa, and for total assets, as they increase with the net returns.
Table 6 presents the estimated results for the central period of our study, 2012–25Q1, as well as for the longest possible period, 2007–25Q1. In addition to the usual unweighted results, we also show the estimated results weighted by pension fund asset size, one quarter lagged, that is the begin period assets size values. In these weighted estimates, the largest pension funds carry the most weight, meaning every euro of invested assets counts equally in the regression. We believe this is the most relevant estimation approach in economic terms. The t-values are based on clustered standard errors (CSE), where each pension fund defines a cluster, while time Fixed Effects (FE) have also been applied. The variation in net returns is dominated by market conditions, such as stock market index and interest rate movements, which are captured by the time FE.Footnote 8 However, our focus here is on pension fund sizes, cost margins and investment behaviour. We did check the residuals of the regressions for autocorrelation using the Durbin–Watson test and found that the existence of autocorrelation was rejected. The fit as measured by the adjusted R 2 and the overall F-tests is high for all regressions, around 80–90 per cent, as time dummies are used. The high degree of fit is due to stock market index and interest rate movements incorporated by the dummies.Footnote 9 The estimation of CSE in combination with time FE dummies draws heavily on the data. Problems may arise when the number of observations of an explanatory variable in one of the time-pension fund subgroups is (too) low. In one of the regressions, this is the case for performance fees, often absent in small pension funds, so that we could not calculate the CSE. Hence, we have to interpret the t-values with great care. This problem holds for some of the t-values, not for the coefficient estimates, which are very robust. As a robustness check, we also calculated the HAC standard errors, here and in later tables. They are generally in line with the CSE values, but of course the HAC t-values are somewhat higher, as the HAC standard errors are less demanding.
Explanation of net returns of pension funds in percentages (time fixed effects)

Table 6 Long description
Regression coefficients for net returns in percent are listed with t values for two periods, 2012 to 2025Q1 and 2007 to 2025Q1, each shown as unweighted and weighted results. For 2012 to 2025Q1, cost margin management has coefficient 0.000 with t value 8.82 star unweighted and coefficient 0.000 with t value 4.36 star weighted; log total assets lagged has coefficient 0.000 with t value 0.10 unweighted and coefficient 0.000 with t value minus 2.18 star weighted. For 2007 to 2025Q1, cost margin management has coefficient 0.000 with t value 7.70 star unweighted and coefficient 0.000 with t value 3.61 star weighted; log total assets lagged has coefficient 0.000 with t value minus 0.31 unweighted and coefficient 0.000 with t value minus 4.49 star weighted. Standard deviations returns has positive coefficients in all four models, 0.055 with t value 3.49 star, 0.080 with t value 1.58, 0.081 with t value 11.58 star, and 0.073 with t value 2.40 star. Cost margin transactions is negative in all four models, with starred t values in the unweighted models, coefficient minus 0.005 with t value minus 2.44 star for 2012 to 2025Q1 and coefficient minus 0.006 with t value minus 2.87 star for 2007 to 2025Q1. Funding ratio lagged is negative only in the weighted 2007 to 2025Q1 model, coefficient minus 0.006 with t value minus 2.39 star. Asset allocation rows include percent stocks with coefficient 0.010 and t value 2.48 star in 2012 to 2025Q1 unweighted, percent real estate with coefficient minus 0.013 and t value minus 3.73 star in 2007 to 2025Q1 unweighted, percent hedge funds with coefficient minus 0.018 and t value minus 2.32 star in 2007 to 2025Q1 unweighted, and percent commodities with coefficient 0.074 and t value 2.50 star in 2007 to 2025Q1 weighted. Adjusted R2 is 86.9 for 2012 to 2025Q1 unweighted, 91.1 for 2012 to 2025Q1 weighted, 77.0 for 2007 to 2025Q1 unweighted, and 88.5 for 2007 to 2025Q1 weighted; observations are 11,431 for the 2012 to 2025Q1 models and 18,278 for the 2007 to 2025Q1 models.
Source: Own regression estimates with DNB data.
Notes: (−1) indicates that the respective variable has been lagged by one quarter. t-Values are based on clustered standard errors by pension fund. Model constants are not shown. Weights are the respective pension funds’ asset sizes.
* Significance at the 95% level of confidence.
# In one case (performance costs, 2007–25Q1, unweighted), we could not calculate a clustered standard error. This is due to near singularity of the inverse matrices of the distribution of the coefficient estimates, as a consequence of the large number of dummy variables in combination with the sometimes low number of non-zero values of an explanatory variable (here performance costs, often absent in small pension funds). We used instead, between brackets, the t-value based on the HAC error.
The pension fund size is expressed as (logarithm of) total assets and has been lagged. Its coefficient is only statistically significant (at the 95% level of confidence) for the weighted regressions, in line with most of the literature which reports economies of size in returns. Previous research also revealed economies of scale in investment costs (Broeders et al., Reference Broeders, van Oord and Rijsbergen2016; Bikker and Meringa, Reference Bikker and Meringa2022; Bikker and De Dreu, Reference Bikker and de Dreu2009). In any case, gross returns tend to decrease with scale. Economies of scale in net returns are, however, absent in the unweighted regressions.
The coefficients of the management cost margins are significantly positive across all regressions, showing that investment management costs are not wasteful, but that management expenditures, particularly market analyses, may increase investment skill: they not only pay for themselves but even seem to increase net returns. In contrast, the lagged performance fees variable is never statistically significant. This suggests that investment advice related to performance fees did not add to overall net investment returns. The three negative coefficients suggest that performance fees may pay at least in part for themselves. Broeders et al. (Reference Broeders, van Oord and Rijsbergen2019) find that performance fees do not seem to pay for themselves overall. We analyse the impact of management costs and performance fees in more detail in the subsection below. The coefficients of transaction cost margins are significantly negative in the unweighted regressions, focusing on the smaller pension funds, and nearly significant in the weighted regressions. Apparently, the transactions, on average, did not contribute to higher net returns, at least not within the respective quarter. Zhu (Reference Zhu2018) also finds evidence that active management did not result in higher net returns. The degree of risk, measured by the standard deviations of returns, was significantly positive in the unweighted regression of 2007–25Q1, in line with what we expect from the theory that higher risk is associated with higher expected returns. Higher average age of pension fund members is associated with lower returns in the unweighted regressions. This is consistent with the life-cycle theory that taking more risk may be beneficial for young people, but less so for older people. This outcome was found earlier by Bikker et al. (Reference Bikker, Broeders, Hollanders and Ponds2012). The coefficients of the other variables, including the allocation to asset classes, are only incidentally statistically significant. In part, this is due to the time FE approach, where dummies incorporate price movements over time.
As a robustness test, we also estimated our regressions with random effects (RE) instead of FE. The results are rather similar. For instance, the same coefficients are statistically significant.
Fixed income is often seen as the portfolio component which is not primarily used to generate returns, but to hedge liabilities (Jansen and Tuijp, Reference Jansen and Tuijp2021). The other part of the portfolio is called the return portfolio, which consists of the risky assets. Table A1 in the appendix reports the FE regression estimates of this return portfolio. We then find statistically significant negative coefficients for the company and occupational pension funds, which are generally smaller: they have lower returns on their risky assets. Opposite results are found for richer pension funds, with higher assets per member: they have higher net returns. We then do not find statistically significant negative coefficients of total assets in the 2012–25Q1 regression, suggesting absence of economies of scale. The coefficients of the management cost margin are not statistically significant, while those of performance fees are significantly and negative in the weighted regressions. We come back to this issue in the next paragraph.
6.1. Impact of investment costs on returns by asset class
To examine the impact of management costs and performance fees more closely, and in particular how their effects vary across asset classes, it is important to first take a closer look at these cost components. Table 7 shows the investment costs, split into three constituent parts, for the individual asset types. They are relatively low for fixed assets and stocks, ranging from 0.20 to 0.26 per cent of the assets involved, and also quite low for real estate (0.72%). These costs mainly consist of management and transaction costs. For private equity and hedge funds, on the other hand, investment costs are sky-high (3.35–3.42%). Performance fees account for the lion’s share of these costs, but management costs are also high (1.47–1.84%). Of total performance fees, private equity and hedge funds account for 52 per cent, while these asset classes account for only 8 per cent of investments. Table 1 shows that private equity’s net returns are on average high enough to bear these costs; indeed, these net returns are higher than for any of the other categories. However, this does not apply to hedge funds, where net returns over the relevant period have been close to zero.
Average cost margin components across asset types (2012–25Q1)

Table 7 Long description
Investment cost components are listed by asset type, with each asset type shown in two columns: billion euro and in percent of assets. Rows are management cost, performance cost, transaction cost, simple sum, and share. For fixed income, management cost is 0.74 billion euro and 0.11 percent, performance cost 0.06 and 0.01 percent, transaction cost 0.51 and 0.08 percent, and simple sum 1.31 and 0.20 percent; share is 0.10 percent. For stocks, management cost is 0.61 and 0.16 percent, performance cost 0.12 and 0.05 percent, transaction cost 0.23 and 0.06 percent, and simple sum 0.97 and 0.26 percent; share is 0.08 percent. For real estate, management cost is 0.68 and 0.56 percent, performance cost 0.10 and 0.10 percent, transaction cost 0.08 and 0.06 percent, and simple sum 0.85 and 0.72 percent; share is 0.07 percent. For private equity, management cost is 1.31 and 1.40 percent, performance cost 1.73 and 1.84 percent, transaction cost 0.09 and 0.11 percent, and simple sum 3.13 and 3.35 percent; share is 0.24 percent. For hedge funds, management cost is 0.37 and 1.61 percent, performance cost 0.33 and 1.47 percent, transaction cost 0.06 and 0.33 percent, and simple sum 0.76 and 3.42 percent; share is 0.06 percent. For commodities, management cost is 0.04 and 2.07 percent, performance cost 0.01 and 0.56 percent, transaction cost 0.01 and 0.64 percent, and simple sum 0.06 and 3.27 percent; share is 0.00 percent. Total columns show management cost 4.21 billion euro and 0.31 percent, performance cost 2.04 and 0.17 percent, transaction cost 1.21 and 0.09 percent, and simple sum 7.46 and 0.58 percent; share is 0.55 percent.
Source: DNB, own calculations.
Notes: ‘Simple sum’ is the addition of the amounts and percentages in the three rows above. ‘Share’ is the percentage of the investment cost of the respective asset category as a share of total investment costs. Total investment costs contain some costs that could not be attributed to the individual asset categories.
Performance fees vary widely, not only across asset classes, but also within those classes across pension funds. Table 7 shows average cost margins across all pension funds, but many of them pay no performance fees at all. For fixed income, pension funds pay on average 1/18th of investment costs in performance fees, but most pay no fee at all. Among those funds that do pay performance fees, this cost margin amounts to as much as one third of total investment costs (i.e., six times higher than on average). For stocks, these fractions are one twelfth and two thirds, respectively (i.e., eight times higher). These significant differences in the choice of hiring external consultants and advisers (and paying performance fees) between pension funds make it all the more interesting to zoom in on investment cost analysis by asset class.
We now apply the regression analysis of net returns as in Table 6 to individual asset categories, both unweighted and weighted (see Table 8). Obviously, we drop the asset allocations as explanatory variables. We focus first on performance fees and see, for private equity and hedge funds, significant positive effects in the unweighted regressions, which focus on the small pension funds. This suggests that external consultants lead to higher net returns and, as such, earn enough to be paid for their own cost by a considerable margin. We are very cautious here, as endogeneity precludes any conclusion with respect to causality: advice may raise net returns, but improved net returns may also raise the performance fees. The one-quarter lag of performance fees may reduce endogeneity. Further, FEs eliminate all quarterly price shocks and, hence, also eliminate the key element of any possible reversed causality. In the weighted regressions, which focus on the large pension funds, these performance fee effects disappear. For the other asset classes, the impact of performance fees on net returns is generally negative, though not statistically significant.
Explanation of net returns of pension funds in percentages by asset type (fixed effects, 2012–25Q1)

Table 8 Long description
Regression coefficients and t values are listed for net returns in percentages across fixed income, stocks, real estate, private equity, hedge funds, and return portfolio, shown for unweighted and weighted specifications. Unweighted, management cost is 0.009 with t value 0.53 for fixed income, 0.026 with t value 2.44 for stocks, minus 0.114 with t value minus 0.65 for real estate, 0.805 with t value 1.28 for private equity, 0.874 with t value 1.88 for hedge funds, and 0.000 with t value 4.07 for return portfolio. Unweighted, performance fees lagged one quarter are minus 0.025 with t value minus 0.07 for fixed income, minus 0.291 with t value minus 1.13 for stocks, minus 0.490 with t value minus 0.68 for real estate, 2.984 with t value 2.72 for private equity, 6.207 with t value 3.23 for hedge funds, and 0.051 with t value 0.32 for return portfolio. Unweighted, transaction cost is minus 0.032 with t value minus 0.63 for fixed income, minus 0.083 with t value minus 2.56 for stocks, 0.349 with t value 0.64 for real estate, 0.859 with t value 0.45 for private equity, minus 1.912 with t value minus 1.12 for hedge funds, and minus 0.002 with t value minus 0.74 for return portfolio. Unweighted, standard deviation of returns is 0.061 with t value 2.77 for fixed income and 0.024 with t value 1.55 for return portfolio, while other asset types range from minus 0.190 to 0.088 with t values between minus 1.26 and 1.22. Unweighted, company pension fund and occupational pension fund indicators are near zero across asset types, but for return portfolio they are minus 0.003 with t value minus 6.56 and minus 0.004 with t value minus 6.12; ln assets per members lagged one quarter is 0.001 with t value 3.71 for return portfolio and ln assets lagged one quarter is 0.000 with t value minus 2.30 for return portfolio. Weighted, management cost is 0.032 with t value 2.65 for fixed income and 0.000 with t value 1.03 for return portfolio; transaction cost is minus 0.111 with t value minus 2.77 for fixed income and 23.803 with t value 2.55 for hedge funds. Weighted, percent defined benefit is minus 0.015 with t value minus 2.29 for real estate and minus 0.071 with t value minus 2.04 for private equity, while return portfolio is minus 0.003 with t value minus 0.73. Model summary rows list adjusted R2, F statistic with p value, and number of observations for each asset type, with unweighted adjusted R2 values of 82.7 for fixed income, 94.5 for stocks, 21.4 for real estate, 12.6 for private equity, 9.9 for hedge funds, and 61.3 for return portfolio, and weighted adjusted R2 values of 83.6, 97.0, 55.7, 43.9, 35.4, and 78.9 respectively.
Source: Own regression estimates with DNB data.
Notes: (−1) indicates that the respective variable has been lagged by one quarter. t-Values are based on clustered standard errors by pension fund. Time fixed effects have been applied. Model constants are not shown.
* Significance at the 95% confidence.
Management cost coefficients are statistically significant and positive for the return portfolio (unweighted) as well as for fixed income (weighted). Transactions have a positive effect on hedge returns, as its cost margin coefficient is statistically significant. This result is opposite to that for fixed income. For the return portfolio, we find statistically significant negative coefficients for the smaller company and occupational pension funds, which are mostly smaller. For richer pension funds with higher assets per member, we observe higher net returns. Economies of scale are absent everywhere, except for fixed income (in the weighted regression only), and the return portfolio, in line with what we found in Table 1A.
7. Simulations of a hypothetical large-scale consolidation
Bikker and Meringa (Reference Bikker and Meringa2022) calculated the potential investment cost savings for smaller Dutch pension funds if they grew to the size of the sixth-largest fund or were taken over by such a large fund. In that case, their investment costs in 2019 would decline by 1.4 per cent (or €36 million). That is less than 0.5 per cent of the total investment costs of all funds together. On the other hand, when two large pension funds merge, they can save 2.5–3 per cent of their investment costs. We now conduct such a hypothetical simulation of large-scale consolidation for investment returns, in two steps.
The process of consolidation in the Dutch pension sector continues constantly. A large-scale consolidation, however, is hypothetical, as in practice many obstacles exist. The linking of some of the pension funds to industries and their collective labour agreements is such a hurdle. The varying levels of the funding ratios, the diverse relationships between young active workers and old beneficiaries and different pension schemes are also practical problems. Many companies have their own pension fund, which gives them more control. This simulation is just to indicate what the effect of consolidation on investment returns might be.
In the first step, we apply the allocation strategy of the five largest funds to all smaller pension funds. This results in an increase of the national investment returns of pension funds by 4.4 per cent (or 0.055 percentage points) on average. With assets totalling €1,581 billion (2025Q1) and an average return of 1.27 per cent per quarter, this translates to an additional return of €0.9 billion per quarter or €3.5 billion annually (see Table 9). These amounts are substantial compared to the hypothetical consolidation simulations with respect to economies of scale of investment costs alone from Bikker and Meringa (Reference Bikker and Meringa2022).
Annual effects of simulation of a hypothetical consolidation based on 2025Q1

Table 9 Long description
Values are reported for Step 1, Allocation of largest pension funds, and Step 2, Returns of largest pension funds excluding FI, with figures as at end 2025Q1. Under the row label, Additional net returns in percent, Step 1 is 4.4 and Step 2 is 4.7. The next row, Cumulative, lists 9.1 under Step 2. Under the section, In EUR billion per year, the Assets value as at end 2025Q1 is 1,581, and Step 1 is 3.5 while Step 2 is 3.7. The final row, Cumulative, lists 7.2 under Step 2.
Source: Own calculations with DNB data.
In the second step, we align the investment returns of all smaller pension funds with those of the five largest funds, except for fixed-income returns. This adjustment reflects the direct and indirect economies of scale of the smaller pension funds being superimposed on those of the five largest. The returns then increase by 4.7 per cent (cumulative 9.1%),Footnote 10 resulting in over €0.9 billion per quarter or €3.7 billion annually. Cumulatively, these amounts are €1.8 and €7.2 billion annually.
A potential third step refers to strategies and not to consolidation and would be to apply the fixed income investment strategies and the liability interest rate risk hedging decisions of size Class 2 pension funds to the five largest funds, reflecting the ‘best of all worlds’. However, this is too speculative as we have insufficient insight into those strategies and decisions, so we do not present numbers for such a step. Further investment gains would be of similar size as those of each of the first two steps.
8. Conclusions
In most industrialised countries, pension funds manage old-age savings of almost the entire population. Their investments are immense and together they are a dominant player on the financial markets. Good performance of these funds and an effective structure of this sector are of crucial importance. One element of the structure is the size of pension funds. This article investigates the investment performance of different sizes of Dutch pension funds. Various investment strategy choices and economic and financial conditions determine investment performance. One strategy decision is the allocation to more complex asset categories. Over 2012–25Q1, private equity appears to be the most rewarding asset type, followed by public stocks and real estate. Indeed, large pension funds invest more in private equity and real estate. Larger pension funds also benefit from their size: lower investment costs due to economies of scale, greater bargaining power, and their better and more specialised investment analysis divisions, which allow for internal investment management at lower cost. This appears from their higher net returns on public and private equity as well as real estate compared to smaller pension funds. Large pension funds also seem to have other advantages that enable them to overcome potential liquidity issues. However, net returns on large pension funds’ hedge portfolios, that is, fixed income, were roughly only half those of the smaller funds. As a consequence, their overall net investment returns level does not deviate from that of smaller pension funds. Of course, this result relates to both their investment and hedging behaviour. The investments of larger pension funds in hedge funds and commodities have also yielded minimal returns. During the financial crisis years of 2007–11, we also find that economies of scale in net returns are absent: the riskier investments in equities and real estate resulted in negative returns, a disadvantage for the largest pension fund’s performance.
All in all, large pension funds’ overall net returns are not significantly larger than those of smaller funds. Applying the paired t-test and the Wilcoxon signed-rank test, the null hypothesis of equal total returns over the size classes has not been rejected for any possible pair of classes. Similarly, the impact of size on net returns in regression models is often not statistically significant. Further, we also consider total returns exclusive of administration and other non-investment costs, which is a kind of overall performance measure. As these non-investment costs have economies of scale, large pension funds score slightly better but, even then, the net return differences between the size classes are not statistically significant.
Large pension funds rely heavily on external investment advice and spend substantial amounts on performance fees. Considerable differences in performance fees across pension funds exist, also within their respective size classes. Question 1 is whether such costs pay for themselves, and Question 2 is whether they do so in a manner that is more than proportional. The answer to the first question is positive, but we do not find much evidence for the second one: market expert advice in return for performance fees does not add statistically significant extra value. An exception is private equity and hedge funds: we found some evidence of more than proportional returns in the unweighted regressions, which focus on the smaller pension funds.
The past twenty years have seen significant consolidation in the Dutch pension sector. The analyses of the effect of scale on net returns in this study indicate that, in principle, the large pension funds have both a superior allocation strategy and higher returns on equities, real estate and private equity. Hence, continuation of the consolidation trend could benefit net returns achieved by the total pension sector. Simulations reveal the substantial amounts involved. Nevertheless, there are caveats. The hedge portfolios of the large pension funds have had an adverse effect on income, making it difficult to recommend consolidation outright. In addition, consolidation involves more than financial arguments alone. The linking of some of the pension funds to industries and their collective labour agreements, and their varying funding ratios and age structure of participants, create practical obstacles to consolidation.
The question may arise as to whether the investment performance results obtained by Dutch pension funds as studied in this article also apply to other countries. We have analysed the investment behaviour of Dutch pension funds on the international capital markets. Pension funds in other countries invest in the same capital markets. Verschoor et al. (Reference Verschoor, Rubbaniy and van Lelyveld2014) find that home bias in investments of Dutch pension funds is limited and declining. Analysing investment funds in the euro area, Molestina Vivar et al. (Reference Molestina Vivar, Wedow and Giuzio2020) find that the share in domestic securities of investment funds has also declined over the past five years. At year-end 2018, domestic equity and bond securities were only 5 and 15 per cent of total assets, respectively, when using the look-through approach. In 2019Q4, Dutch pension funds invested only 10 per cent in Dutch assets (Source: DNB). Regulatory restrictions on pension fund investments exist in the Netherlands; for example, investments in risky assets should be reduced when the funding ratio is too low, but regulatory restrictions on investments are very limited overall. The majority of Dutch pension funds are of the DB type, but we do not find any differences in investment returns between DB and DC schemes. Large pension funds in the Netherlands are generally in the same position as large funds elsewhere, while smaller pension funds outsource their investment to a large degree to international investment firms. All in all, we feel that this study is informative for the pension sectors in all industrialised countries.
APPENDIX
Net returns and risk over time by pension fund size classes, excluding private assets (as a percentage; 2012–25Q1).
Notes: Size class classification as in Table 2. Class 1 comprises the largest pension funds and Class 5 the smallest.

Figure A1 Long description
Vertical grouped bar graph with five bars per quarter for size class 1, 2, 3, 4 and 5. The x-axis labels quarters from 2012 Q1 through 2015 Q1. The y-axis label is Return, with tick labels at 11 percent, 6 percent, 1 percent, minus 4 percent, minus 9 percent and minus 14 percent. Legend text reads, Size Class, with entries 1, 2, 3, 4, 5 shown using five distinct fill patterns. Notable magnitudes visible on the y-axis scale include a cluster near 2013 Q1 where bars reach close to 11 percent and a cluster near 2014 Q1 where bars drop close to minus 14 percent. Several quarters show bars near the 1 percent line and multiple quarters show bars between minus 4 percent and minus 9 percent. Within each quarter, the five size class bars are adjacent rather than stacked, allowing comparison of size classes within the same quarter.
Explanation of pension funds’ net returns of the return portfolio, in percentages, time fixed effects

Source: Own regression estimates with DNB data.
Notes: (−1) indicates that the respective variable has been lagged by one quarter. t-Values are based on clustered standard errors by pension fund. Time fixed effects have been applied. The return portfolio is exclusive of fixed income returns. Model constants are not shown.
* Significance at the 95% level of confidence.
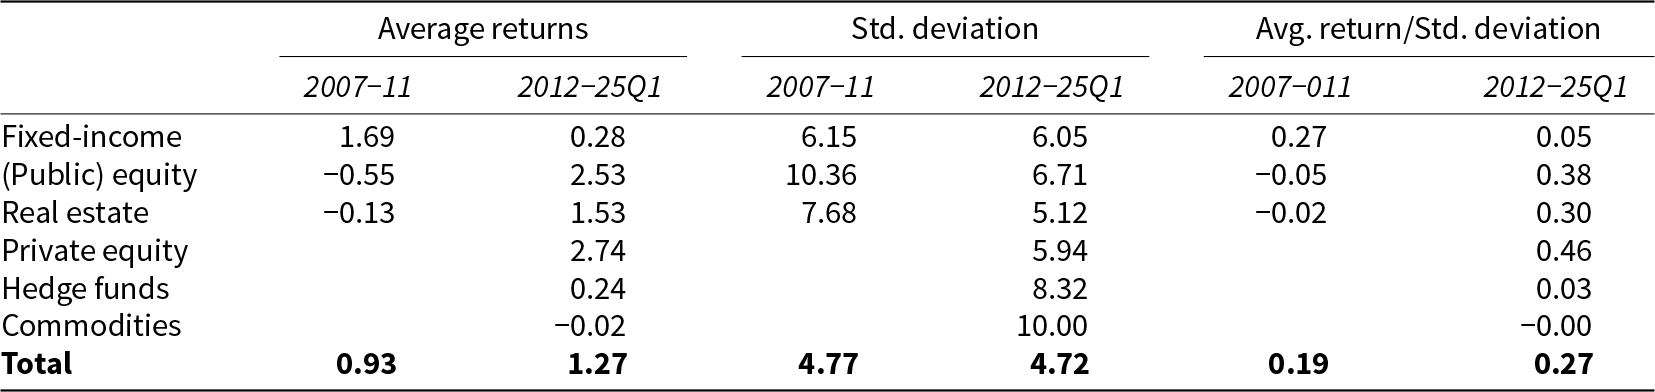
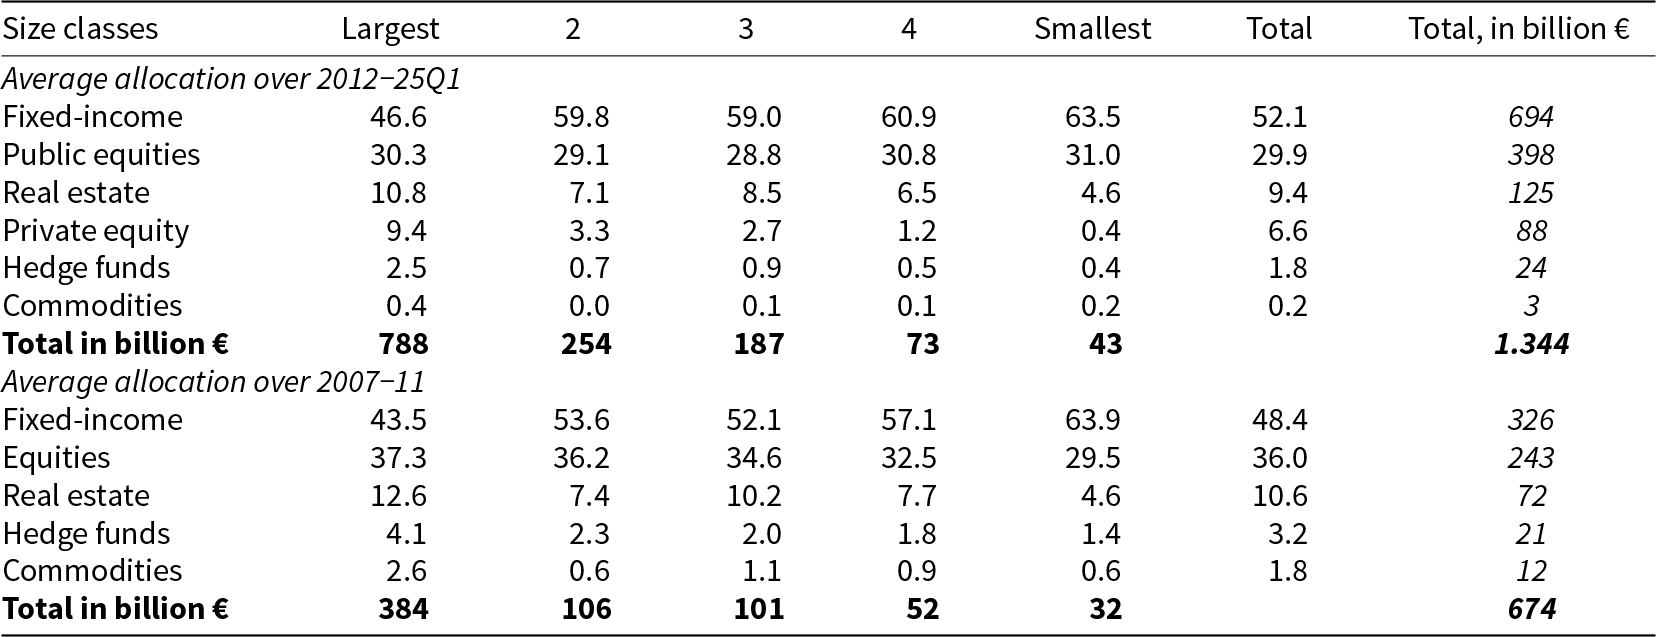
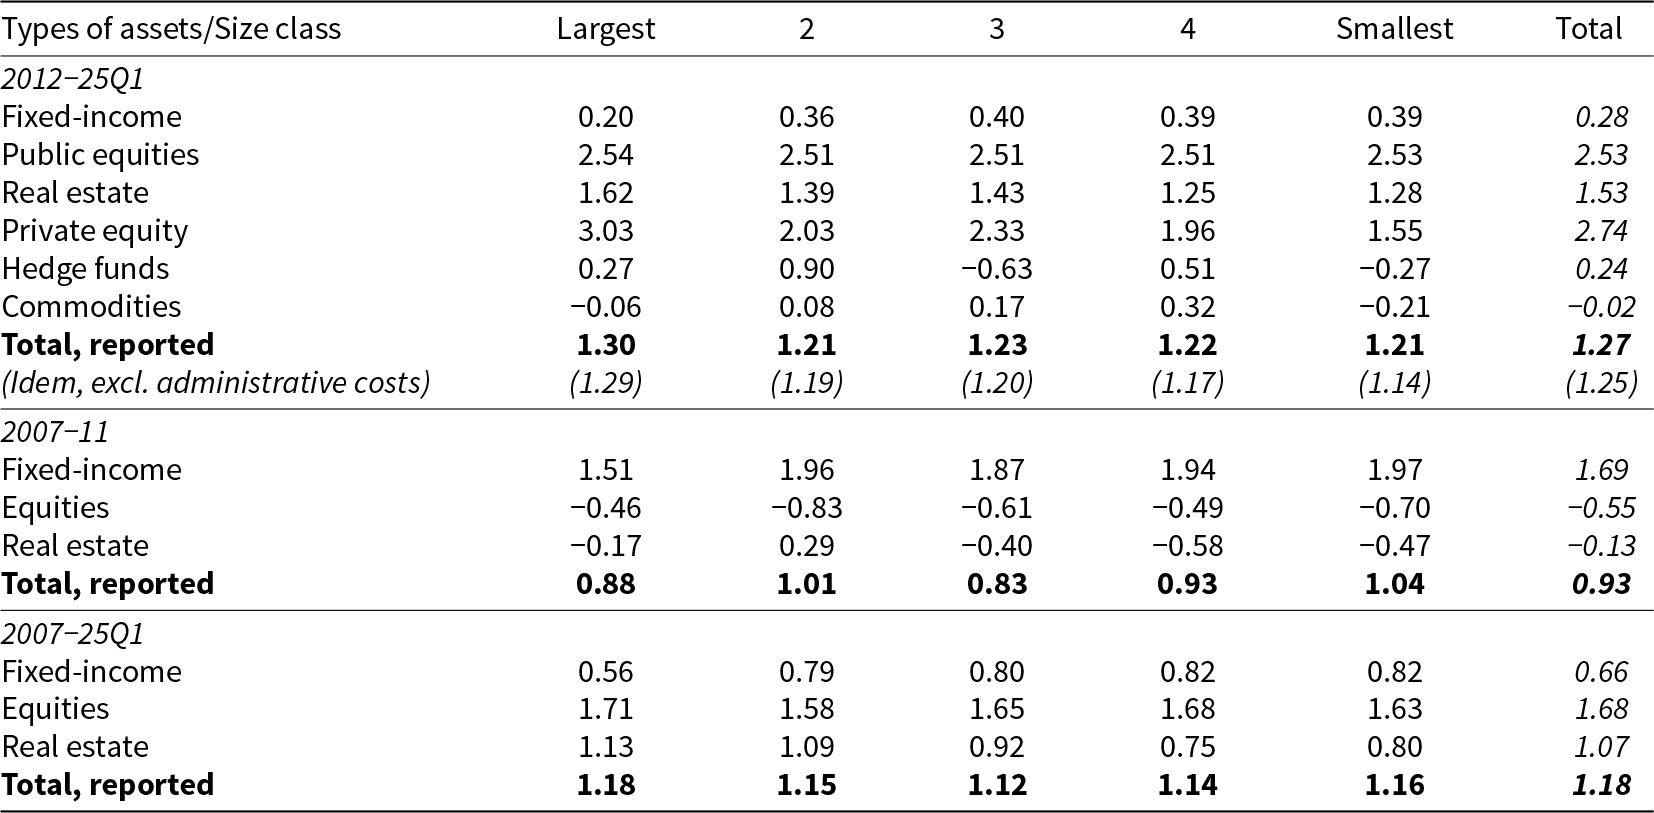
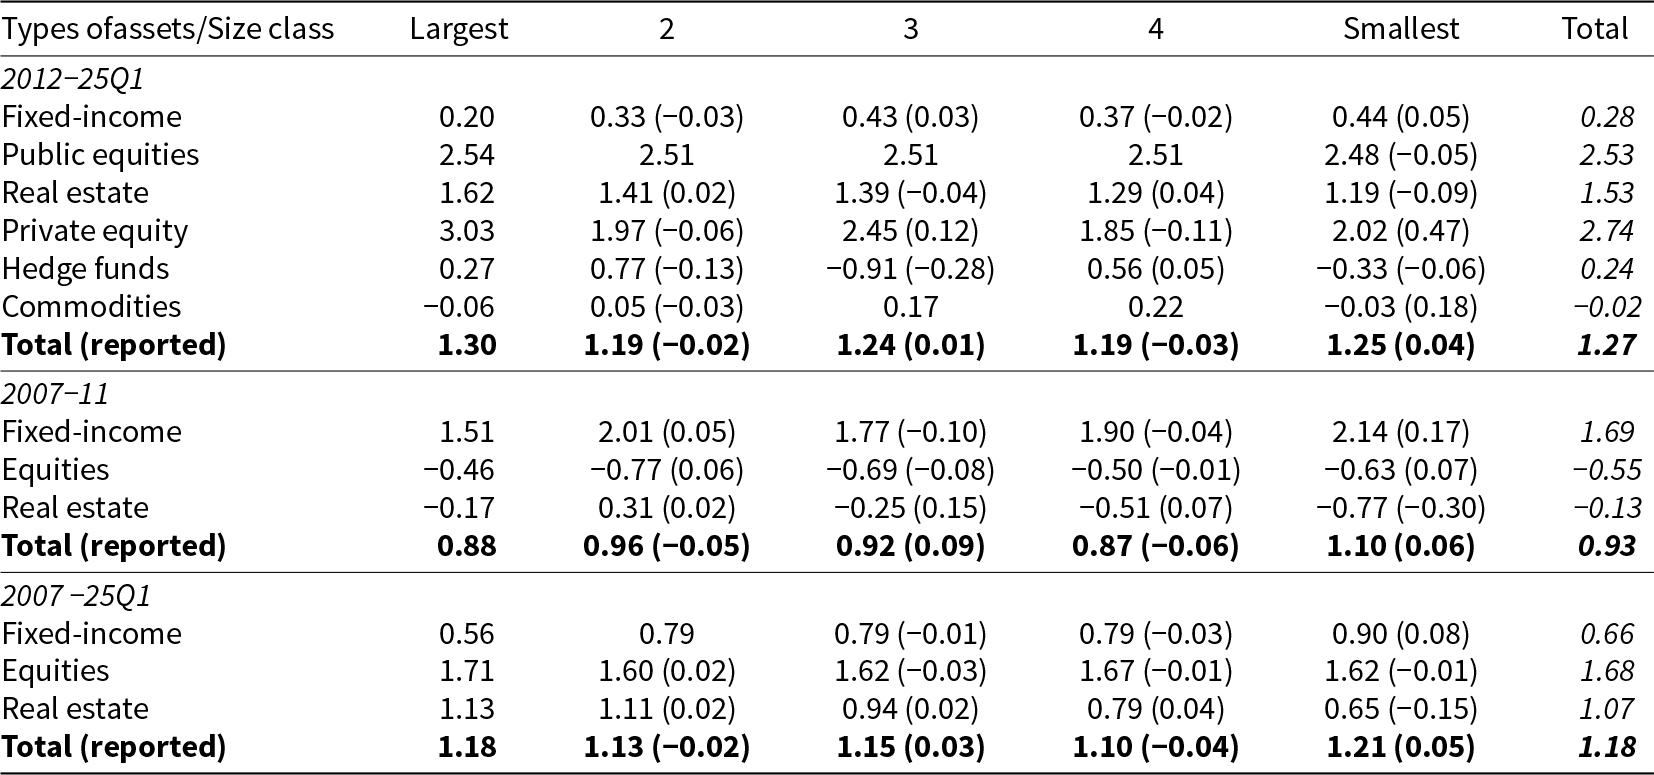
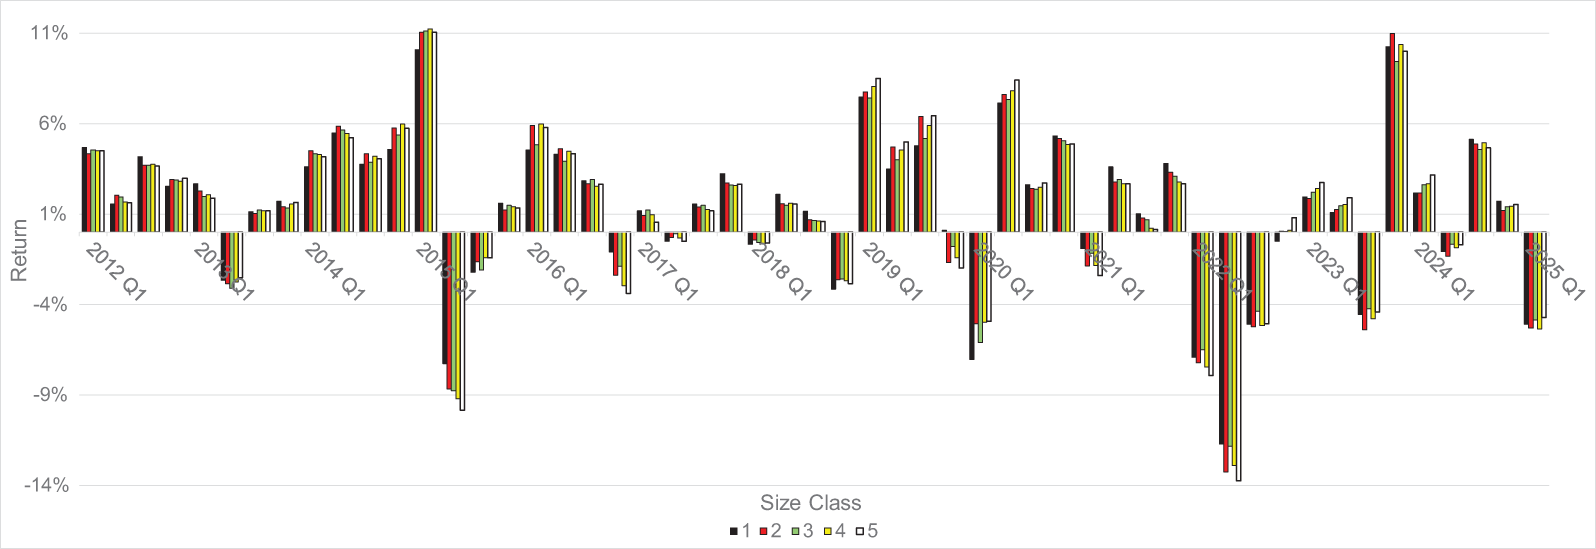
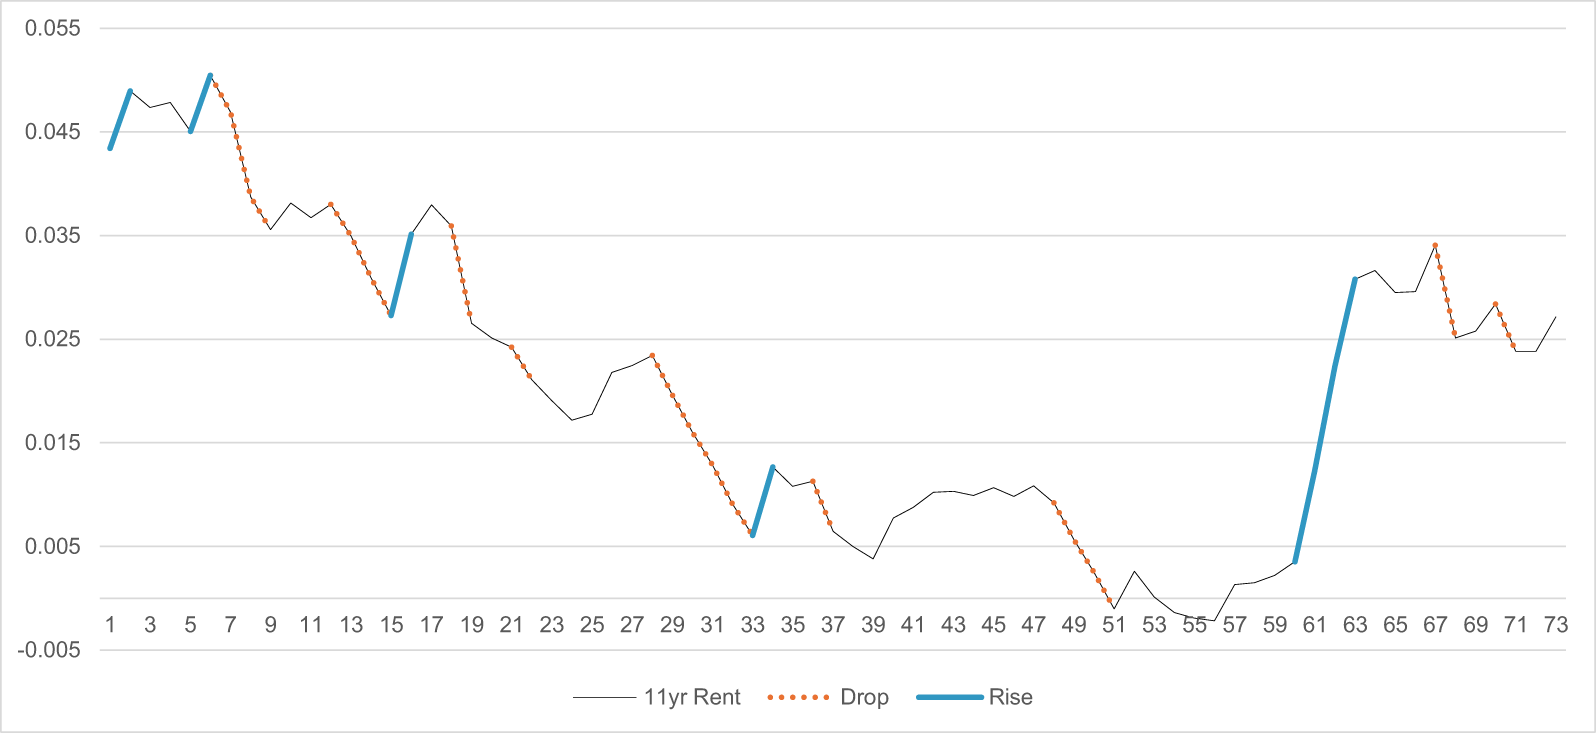
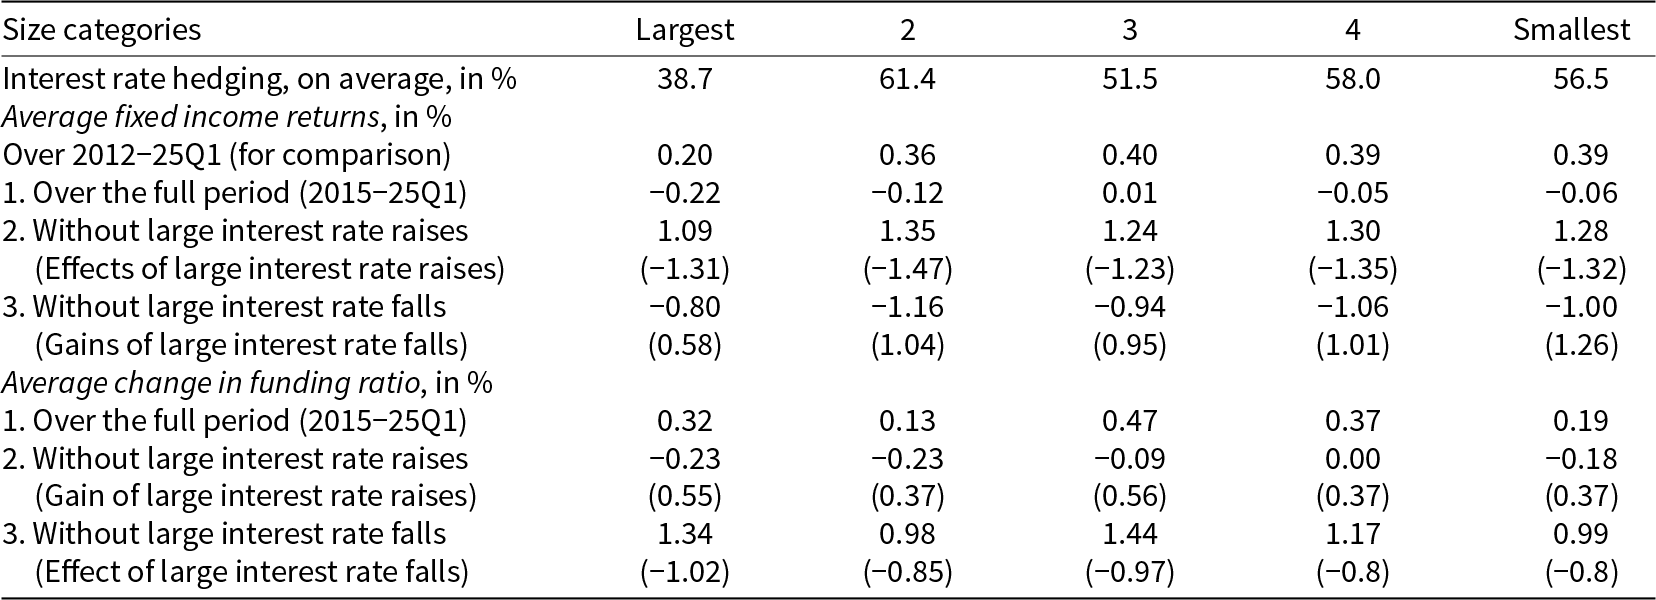
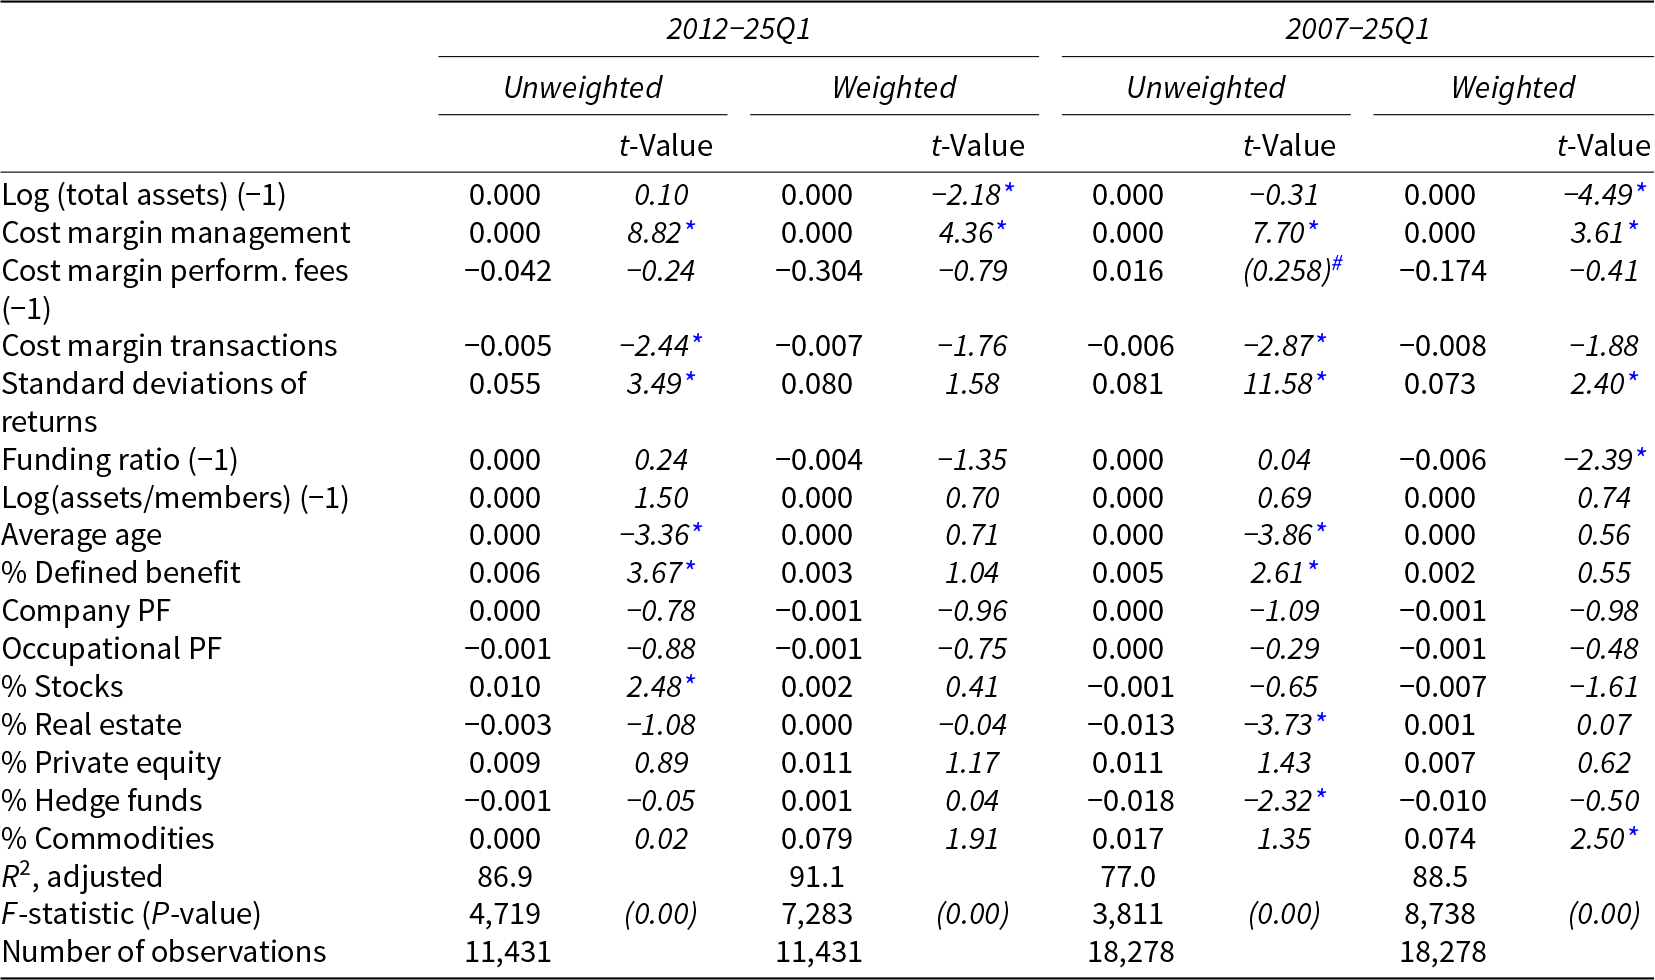

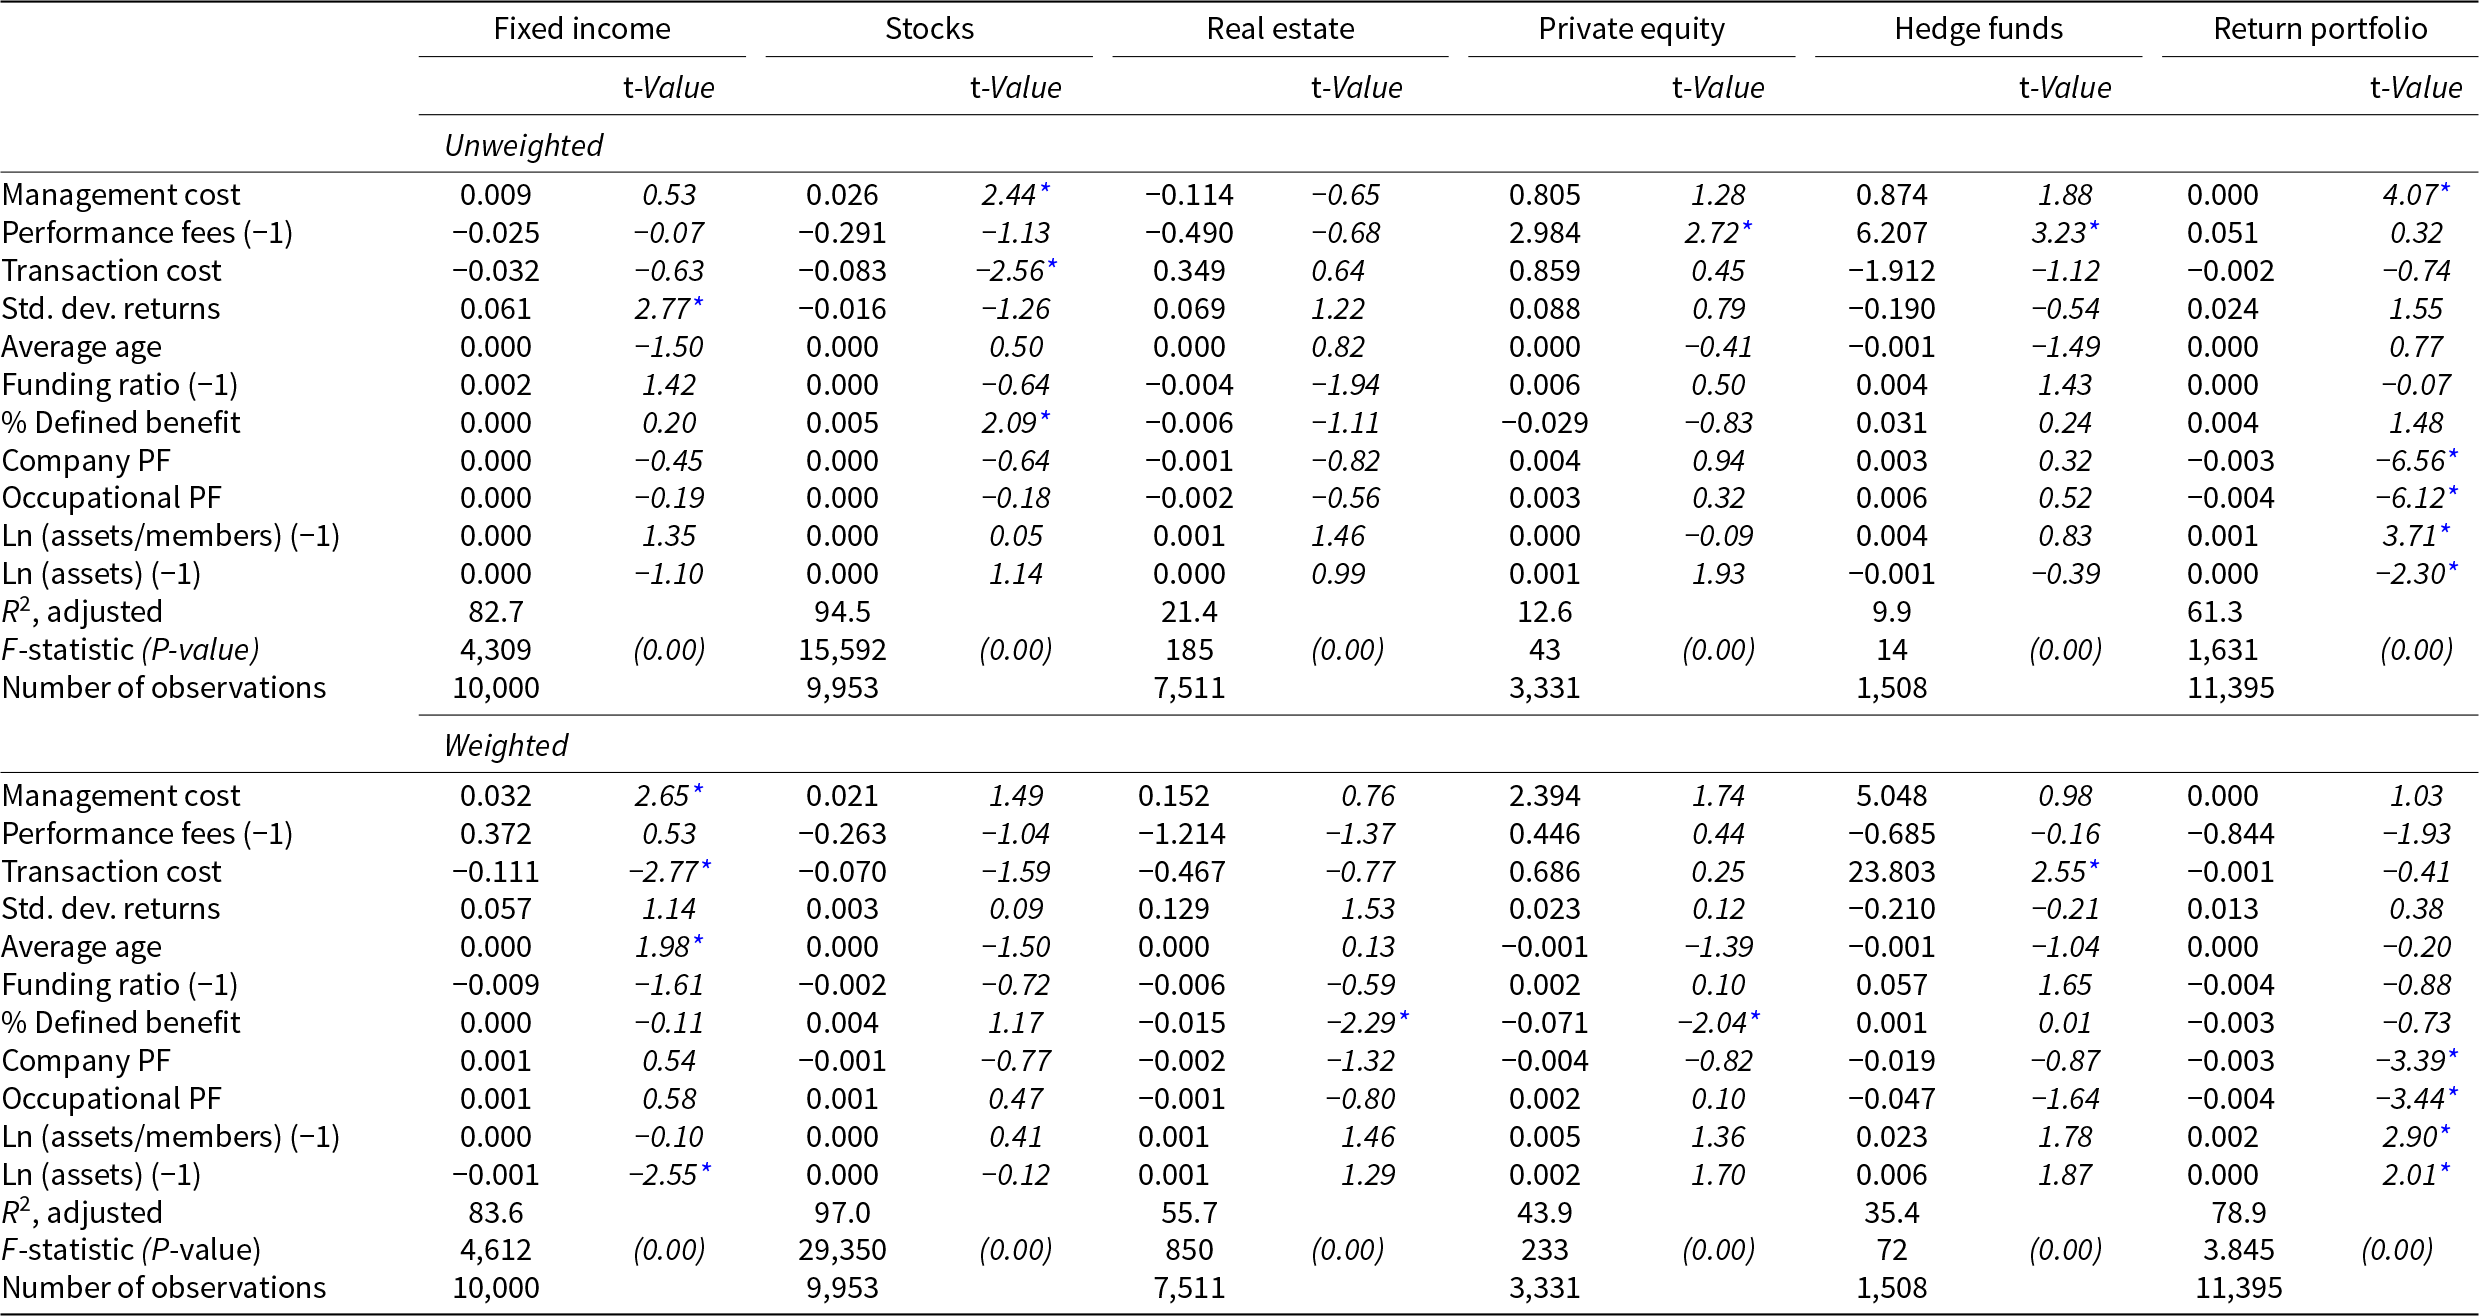
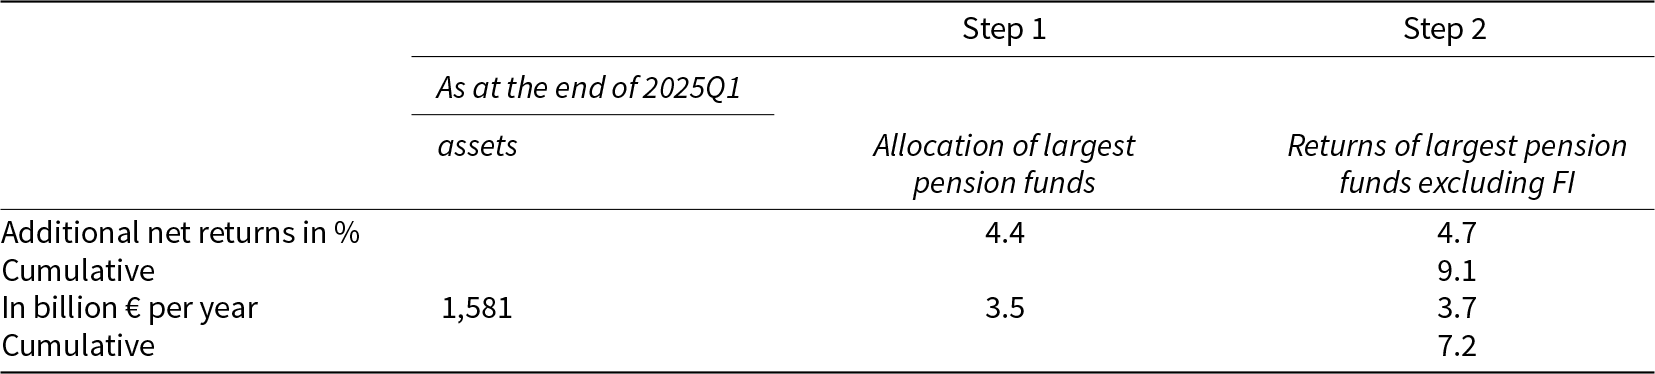
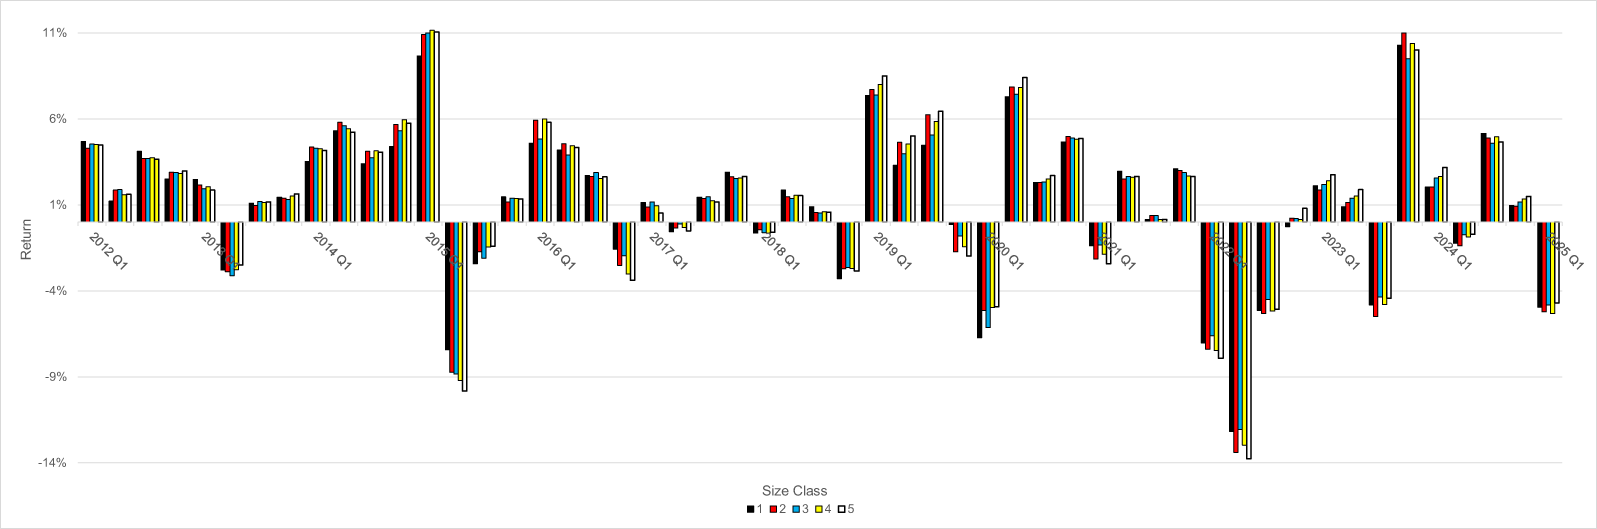
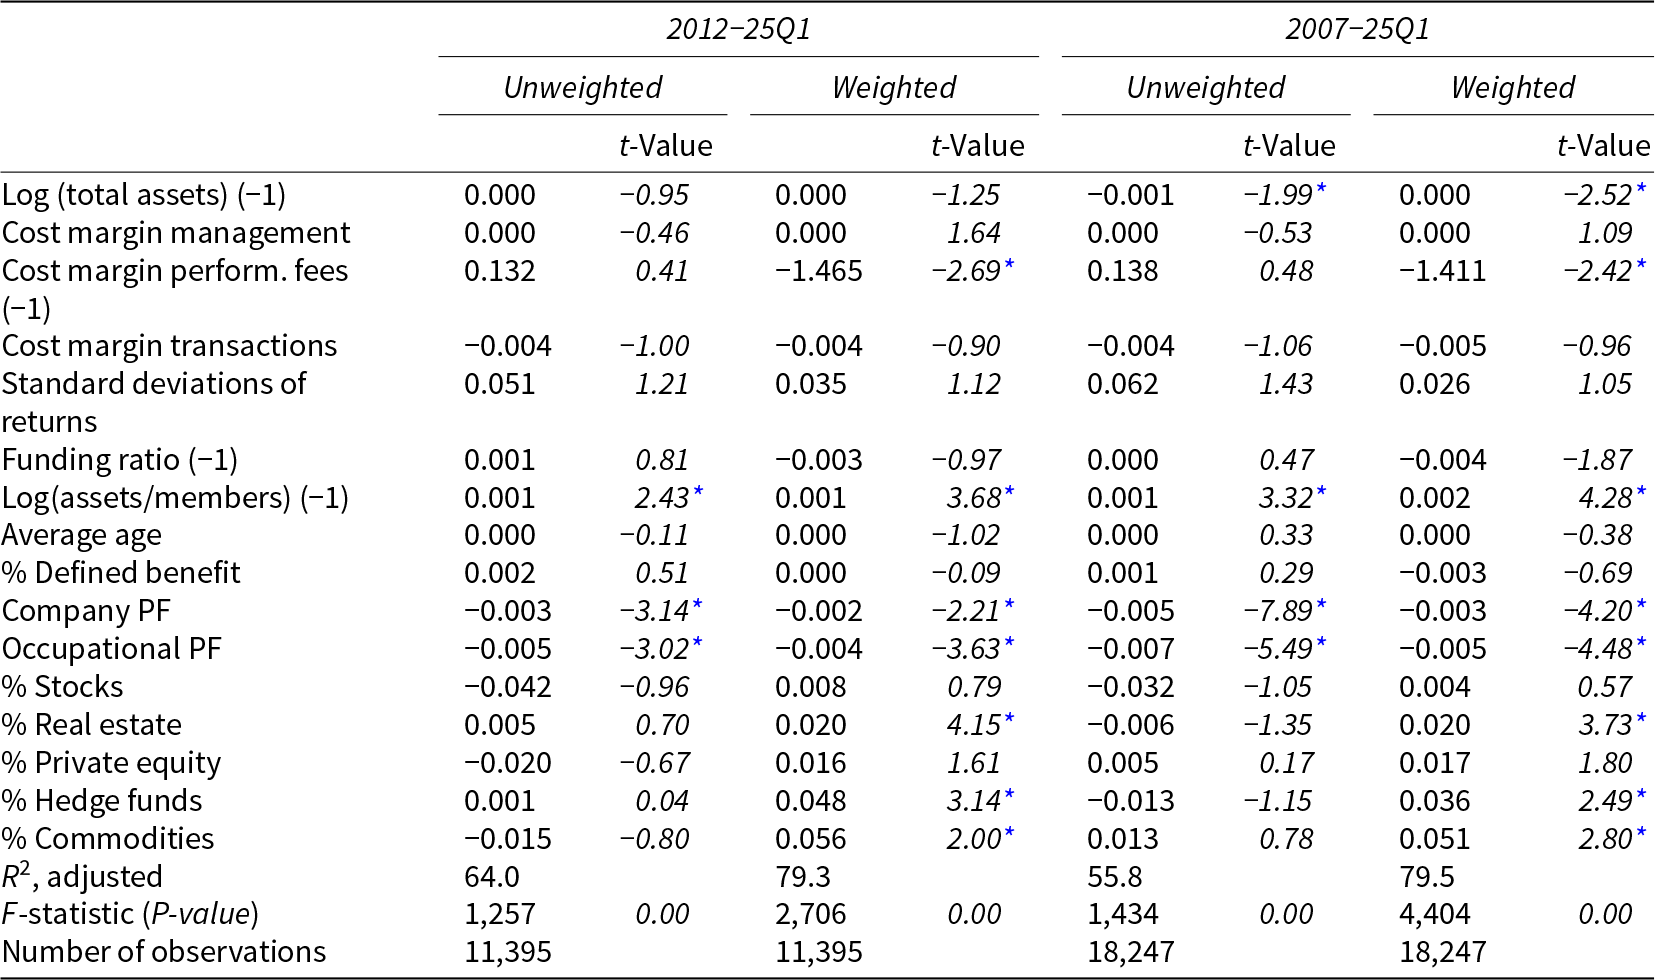

 Open access

