



1. Introduction
T Tauri Stars are the adolescents of stellar evolution (Herczeg & Hillenbrand Reference Herczeg and Hillenbrand2014). The stars are still contracting towards the main sequence, now observable through their partially dissipated nascent clouds. Some systems are still accreting, others have dispersed their protoplanetary disks (Hartmann, Herczeg & Calvet Reference Hartmann, Herczeg and Calvet2016). All of them are highly magnetic, generating pimply starspots on their surfaces, strong flares, and high X-ray and chromospheric emission, all of which exhibit a large degree of variability (Basri Reference Basri2021). Accurate modells of the stellar spectrum need simultaneously account for the emission of all these sources. Many such efforts exist in the literature (e.g., Gully-Santiago et al. Reference Gully-Santiago, Herczeg, Czekala, Somers, Grankin, Covey, Donati, Alencar, Hussain and Shappee2017; Pérez Paolino et al. Reference Pérez Paolino, Bary, Petersen, Ward-Duong, Tofflemire, Follette and Mach2023, Reference Pérez Paolino, Bary, Hillenbrand and Markham2024, 2025a, b). Here we present our latest results on the study of starspots on young stars.
2. Models of Spotted Stars
We construct models that incorporate emission from starspots in the form
 \begin{equation} F_{\lambda,\ \rm model} = F_{\lambda}(T_{\rm phot},\ \log g_{\rm phot})(1-f_{\rm spot}) +\ F_{\lambda} (T_{\rm spot},\ \log g_{\rm spot})f_{\rm spot}\end{equation}
where
 $F_{\lambda}(T_{\rm phot},\ \log \rm g_{\rm phot})(1-f_{\rm spot})$
represents the contribution from the stellar photosphere, and
 $F_{\lambda} (T_{\rm spot},\ \log \rm g_{\rm spot})f_{\rm spot}$
that from the starspots weighted by the filling factor
 $\rm f_{spot}$
. For the models, we used a grid of BTSettl theoretical atmospheres (Allard Reference Allard2014) interpolated across temperature between 2000-7000 K and surface gravity between 2.5 and 5 dex. We then used an emcee-based (Foreman-Mackey et al. Reference Foreman-Mackey, Hogg, Lang and Goodman2013) Markov Chain Monte Carlo (MCMC) sampler for parameter and uncertainty estimation, adopting the median and 1
 $\sigma$
deviations in the posterior parameter distributions as our best-fit values and uncertainties. One of these models is shown in Figure 1.
Comparison of Spotted (Top row) and Unspotted (Bottom row) Stellar Model for MX Lup. The stellar spectrum is shown in blue, while the best-fit model is in black. In the spotted models, we show the scaled contribution to the total stellar flux of the spots ing green, while the photosphere is in orange. The inset schematic is shown for illustrative purposes. Figure reproduced from Pérez Paolino et al. (2025b).

Figure 1 Long description
The image contains multiple line graphs comparing the spectral data of young stellar objects. Panel A shows the spectral data for the unspotted stellar model of MX Lup, with the stellar spectrum in blue and the best-fit model in black. Panel B shows the same for the spotted stellar model, with additional contributions from spots in green and the photosphere in orange. Each panel includes detailed spectral lines across different wavelengths, with the x-axis representing wavelength in micrometers and the y-axis representing normalized flux. The inset schematics in each panel illustrate the stellar surface with and without spots. The graphs highlight the differences in spectral contributions due to starspots, showing how they affect the overall stellar flux.
3. Trends in Starspots with Temperature
Across a sample of 56 stars in Pérez Paolino et al. (2025b), we find starspot coverage between 0–85% of the stellar surface, with temperature contrasts with respect to the photosphere of up to 1500 K (Figure 2). We find three regimes: (1) nearly constant coverage (
 $f_{spot}\approx0.6$
) for T
 $\geq$
4000 K, (2) a broad peak (
 $f_{spot}\approx0.75$
) for 3350
 $\leq T_{eff} \leq$
4000 K, and (3) a decline (
 $f_{spot}\approx0.3$
) below 3250 K. At the coolest end, molecular features lose temperature sensitivity (e.g., TiO below
 $\approx$
3200 K), so the derived spot fractions there are uncertain. Our pattern matches the optical–NIR temperature offsets noted by Gangi et al. (Reference Gangi, Antoniucci, Biazzo, Frasca, Nisini, Alcalá, Giannini, Manara, Giunta, Harutyunyan, Munari and Vitali2022) and supports the idea that strong spot coverage distorts optical temperature estimates.
Starspot Trends as a Function of Temperature. Panels display: a) spot covering fractions as a function of stellar effective temperature, b) the ratio of spot to photospheric temperature, with points color-coded by
 $f_{\rm spot}$
, c) stellar rotation periods shaded by spot coverage, d) the relative luminosity contribution of the photosphere compared to the spots, and e) the difference between surface gravity inferred for the spotted and unspotted components. Figure reproduced from Pérez Paolino et al. (2025b).

The ratio
 $T_{spot}/T_{phot}$
decreases roughly linearly with increasing
 $T_{eff}$
, echoing trends for dwarfs (Berdyugina Reference Berdyugina2005; Herbst et al. Reference Herbst, Papaioannou, Airapetian and Atri2021) but with larger contrasts. Ratios agree with smaller PMS samples and approach the solar value at the hot end. Below
 $\approx$
2500 K, the contrast and spot coverage both vanish, possibly reflecting weaker magnetic structuring or reduced model sensitivity. For the coolest objects, dust formation may add uncertainty (Allard Reference Allard2014), though most photospheres remain above 2600 K; a few inferred spot temperatures fall lower and should be treated cautiously. The shift in spot behavior near T
 $\approx$
3350 K coincides with the fully convective boundary, hinting at a transition in dynamo mode (Gregory et al. Reference Gregory, Donati, Morin, Hussain, Mayne, Hillenbrand and Jardine2012). Rotation periods from TESS and K2 (0.2-10 d) show no clear correlation with spot coverage, consistent with all targets lying in the saturated activity regime. Luminosity ratios computed from blackbody curves show that in the enhanced-spot region, the spotted component can rival or exceed the photospheric luminosity, implying that single-temperature bolometric corrections are unreliable there. Surface gravity contrasts (
 $\Delta$
log g
 $\approx$
0.7 dex for T
 $\geq$
4000 K, up to
 $\approx$
2 dex at cooler T) suggest denser, magnetically confined spot layers. Part of this difference may stem from synthetic-spectra limitations in cool, molecule-dominated atmospheres, though varying log g in tests changed derived
 $T_{eff}$
by 100 K.
Overall, the two-temperature modeling indicates that single-component fits systematically misestimate PMS stellar parameters: optical
 $T_{eff}$
are biased high, NIR SEDs are mismatched, and log g depends on wavelength. No single
 $T_{eff}$
or log g can adequately represent a strongly spotted PMS star.
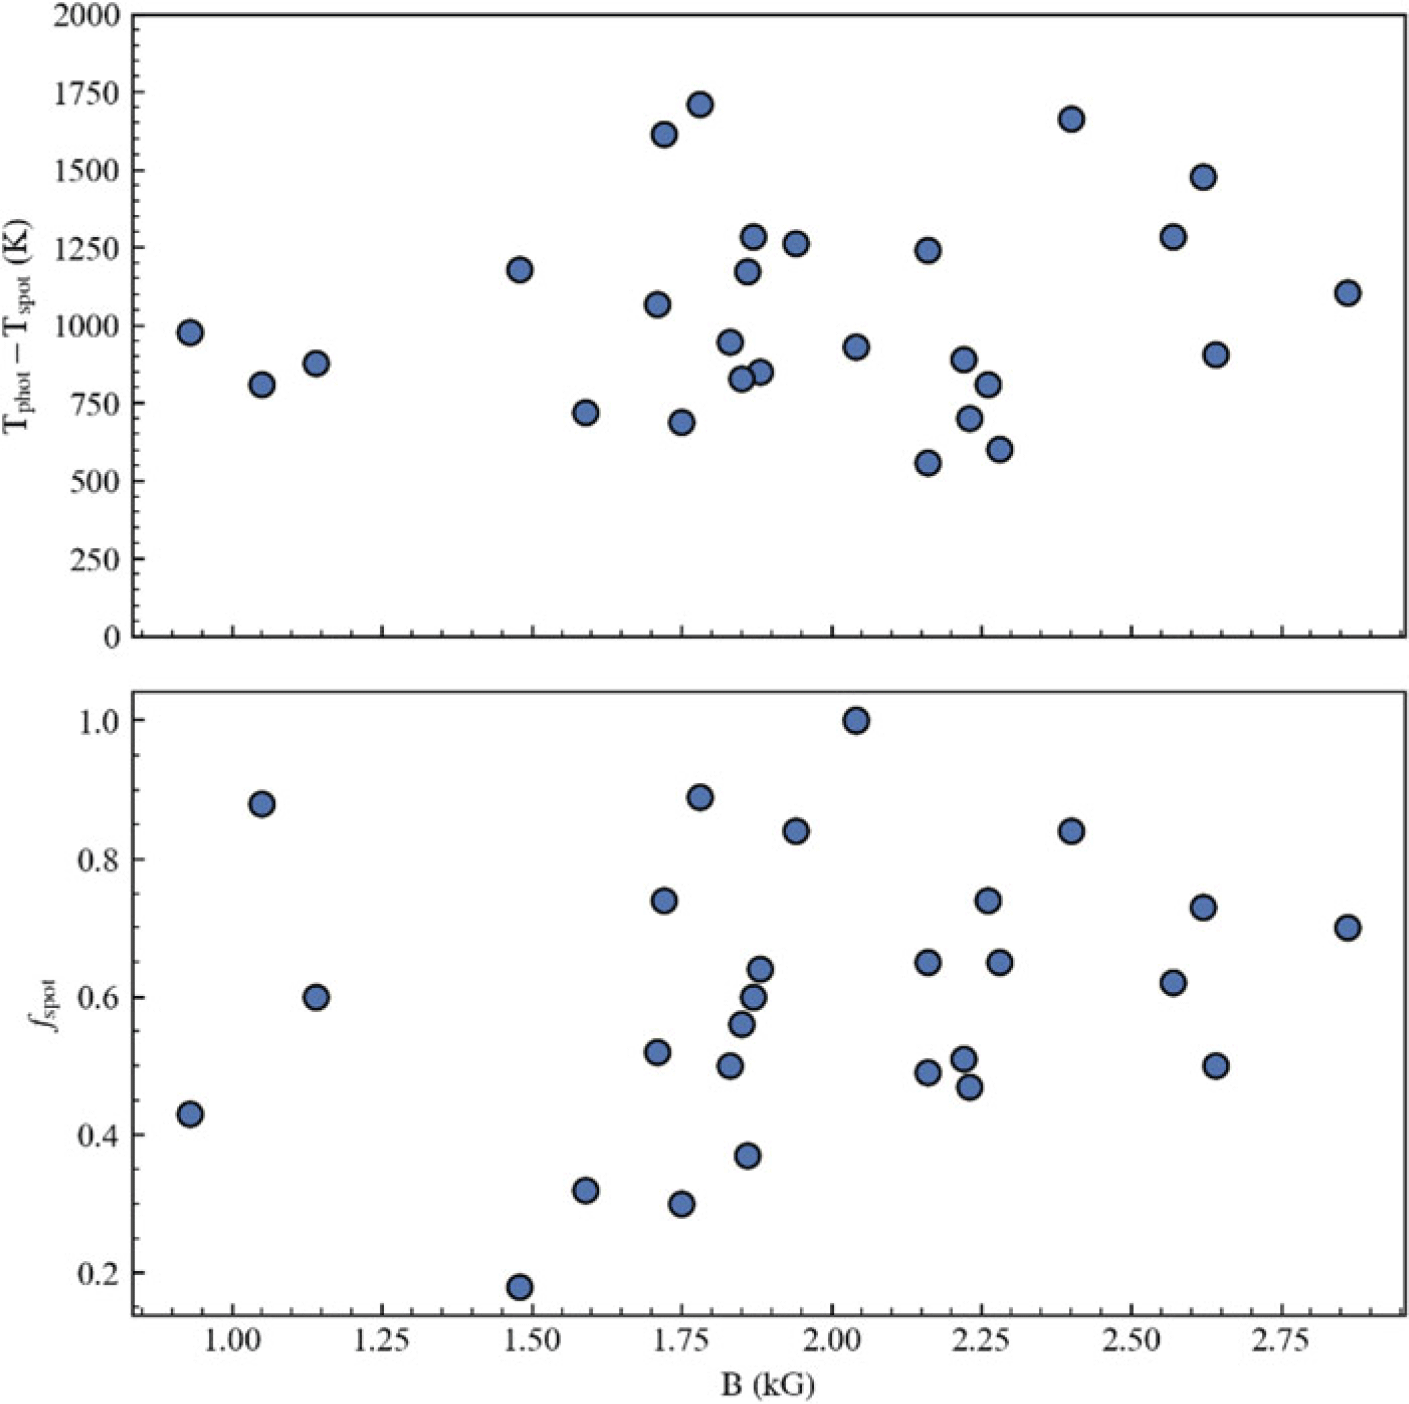
For a subset of these stars, magnetic field strength measurements from high-resolution K-band spectra are available (Flores et al. Reference Flores, Connelley, Reipurth and Duchêne2022; López-Valdivia et al. Reference López-Valdivia, Sokal, Mace, Kidder, Hussaini, Nofi, Prato, Johns-Krull, Oh, Lee, Park, Oh, Kraus, Kaplan, Llama, Mann, Kim, Gully-Santiago, Lee, Pak, Hwang and Jaffe2021), which we use to look for a correlation between spot coverage and magnetic field strength. As can be seen in Figure 3, there is no apparent correlation between spot coverage and magnetic field strength. Likewise, there is no apparent correlation between temperature contrast and magnetic field strength. These results suggest that topology, and not raw field strength alone, are responsible for controlling the spotted-ness of a young star.
Temperature contrast (top) and starspot filling factor (bottom) as a function of magnetic field strength.

4. The Magnetic HR Diagram
Figure 4 summarizes how magnetic topologies evolve across the HR diagram. Building on the framework of Gregory et al. (Reference Gregory, Donati, Morin, Hussain, Mayne, Hillenbrand and Jardine2012), stars with large radiative cores (
 $M_{\rm rad}/ M_\star \gtrsim 0.4$
) tend to show complex, multipolar fields with weak dipoles, whereas those with small or absent cores host stronger, more axisymmetric fields. Near the fully convective boundary, stars exhibit bistable behavior, alternating between strong dipolar and more complex configurations. These magnetic regimes coincide with distinct starspot morphologies in our sample. Using magnetic evolutionary tracks from Feiden (Reference Feiden2016), we identify that maximum starspot coverage occurs in the region bounded by the onset and growth of the radiative core. More massive, hotter stars to the left of this boundary show smaller filling factors, while fully convective stars to the right are also weakly spotted. The intermediate zone displays a mix of morphologies, reflecting the transitional dynamo behavior expected in this regime. Color-coding by rotation period shows no clear trend. These results suggest a coherent picture: the formation of a radiative core marks a major transition in dynamo operation, leading to more complex, variable magnetic fields and corresponding changes in surface starspot coverage. In the next section, we assess how magnetic and spotted evolutionary models influence the inferred positions of these stars on the HR diagram.
The top panel outlines magnetic regimes from Gregory et al. (Reference Gregory, Donati, Morin, Hussain, Mayne, Hillenbrand and Jardine2012) overlaid on magnetic evolutionary tracks and isochrones from Feiden (Reference Feiden2016). Colored regions mark transitions from complex weak dipoles (blue) to axisymmetric high-order fields (green), strong dipolar multipoles (orange), and the bistable zone (tan). Blue and brown lines indicate the onset and growth of radiative cores, while the dashed line marks the bistable boundary. The middle panel shows our Class III sample color-coded by spot coverage (
 $f_{\rm spot}$
), which peaks near the radiative transition and decreases toward higher and lower masses. The bottom panel, color-coded by rotation period, shows no clear trend, consistent with all stars lying in the saturated magnetic regime.

Figure 4 Long description
Panel A: A line graph shows magnetic evolutionary tracks and isochrones with colored regions indicating different magnetic regimes. The x-axis represents spot-corrected effective temperature in Kelvin, and the y-axis represents the logarithm of luminosity over solar luminosity. Blue and brown lines indicate the onset and growth of radiative cores, with a dashed line marking the bistable boundary. Panel B: A line graph displays spot coverage for a sample of Class III stars, color-coded by spot coverage. The x-axis represents spot-corrected effective temperature in Kelvin, and the y-axis represents the logarithm of luminosity over solar luminosity. Panel C: A line graph shows rotation periods for the same sample, color-coded by rotation period in days. The x-axis represents spot-corrected effective temperature in Kelvin, and the y-axis represents the logarithm of luminosity over solar luminosity.
5. Spot-Corrected Masses and Ages
Magnetic fields and starspots complicate the determination of masses and ages for pre-main-sequence stars because they distort the usual link between luminosity, temperature, and structure, shifting stars away from the positions predicted by standard models. Recent stellar evolution models address this by including magnetic inhibition of convection or the flux-blocking effect of starspots to better represent young, magnetically active stars.
We placed our sample of Class III stars on the HR diagram using luminosities from Claes et al. (Reference Claes, Campbell-White, Manara, Frasca, Natta, Alcalá, Armeni, Fang, Lovell, Stelzer, Venuti, Wyatt and Queitsch2024) and both unspotted and spot-corrected effective temperatures. The magnetic models of Feiden (Reference Feiden2016) reduce convective efficiency by coupling magnetic fields directly into the equations of stellar structure, leading to cooler and more luminous tracks. The SPOTS models Somers, Cao & Pinsonneault (Reference Somers, Cao and Pinsonneault2020) instead simulate surface flux suppression through parameterized spot coverage, altering surface boundary conditions and slowing stellar contraction. Both produce similar offsets, with Feiden’s models roughly matching the SPOTS predictions when the spot filling factor is about 0.5.
Masses and ages were obtained through MCMC interpolation of the tracks, accounting for each star’s individual spot coverage. The largest differences between spotted and unspotted parameters occur for stars between 0.3 and 0.8 solar masses, where radiative cores emerge and spot coverage peaks (Figure 5). In this range, spot corrections can change inferred masses by up to 0.3 solar masses and ages by about half a dex.
Masses and Ages from Spot-Corrected and Uncorrected Analyses. Both the SPOTS and F16 models yield higher inferred masses when spot-corrected effective temperatures are used, with offsets up to 0.3
 $M_\odot$
for
 $M \lesssim 0.8~M_\odot$
. At fixed mass, spot corrections also produce older ages, flattening the typical mass-age trend in young populations. Although they do not eliminate the apparent age spread, spot corrections reduce its slope and the disagreement between models, confirming that cool surface spots contribute substantially to the inferred youth of low-mass stars. The shaded region marks where surface inhomogeneities have the largest impact.

The apparent agreement between magnetic and spotted models arises because Feiden’s fixed internal magnetic fields mimic the cooling effect of moderate spot coverage rather than modeling it directly. A complete theory will need to combine both interior magnetism and surface inhomogeneities. Correcting for spots also reduces the mass-dependent scatter in inferred ages by roughly 0.3 dex, comparable to the typical spread observed in star-forming regions, suggesting that part of the apparent age dispersion may result from temperature biases rather than genuine age differences.
6. Conclusion
Our analysis demonstrates that surface inhomogeneities and internal magnetic fields significantly alter the inferred physical properties of young stars. Comparing magnetic and spotted evolutionary models shows that both predict cooler, more luminous tracks than standard models, but through distinct physical mechanisms. The two approaches converge when spot filling factors are moderate, suggesting that magnetic suppression of convection and spot-induced flux blocking are complementary manifestations of the same underlying physics.
Mass and age estimates derived using spot-corrected temperatures reveal systematic biases of up to 0.3 solar masses and 0.5 dex in age relative to non-corrected values, especially for stars between 0.3 and 0.8 solar masses, the regime where radiative cores emerge and spot coverage peaks. These corrections also reduce the apparent age scatter by about 0.3 dex, implying that part of the age dispersion observed in star-forming regions reflects surface temperature biases rather than true evolutionary spread.
Together, these results emphasize that realistic modeling of PMS evolution must include both interior magnetism and surface spot physics. Doing so will yield more reliable stellar parameters and a clearer understanding of how magnetic activity shapes the early stages of stellar evolution.


 fspot

 fspot

 M⊙
 M≲0.8 M⊙


