Introduction
In many diseases, developmental factors contribute to pathophysiology.Reference Wadhwa, Buss, Entringer and Swanson1–Reference Almond and Currie3 Therefore, information about seasonality of births can provide insights into the etiology and possible prevention of diseases.Reference Torrey, Miller, Rawlings and Yolken4 Birth seasonality has been examined and reported for several diseases and conditions, including allergies, Alzheimer’s disease, anorexia, arthritis, autism, autoimmune thyroid disease, birth defects, breast cancer, cerebral palsy, childhood cancers, Crohn’s disease, depression, diabetes, dyslexia, epilepsy, hyperopia, multiple sclerosis, myopia, narcolepsy, schizophrenia and sudden infant death syndrome. It is well established that people with schizophrenia have an altered seasonality of births, with nearly 300 studies conducted on this topic in about 30 countries.Reference Torrey, Miller, Rawlings and Yolken4–Reference Bembenek6
Recent work has suggested that one type of strabismus, exotropia, is a risk factor for mental illness,Reference Schiffman, Maeda and Hayashi7, Reference Mohney, McKenzie and Capo8 and, in particular, schizophrenia.Reference Korn9–Reference Agarwal, Christensen and Feng13 Strabismus is a deviation of eye alignment that can be vertical, but most often is horizontal. An inward deviation is called an esotropia, and an outward deviation is an exotropia.Reference von Noorden and Campos14 If seasonality of births in exotropia resembles that in schizophrenia, this would provide further support for an association between the two conditions and may lead to new pathophysiological insights. Seasonal effects on eye growth and refractive error have been documented.Reference Matsuda, Yokoyama and Nakagawa15–Reference Matsuda, Yokoyama, Fukui, Morita and Kozaki17 However, only a single study from Japan (published in Japanese) in the 1980s has reported on the seasonality of births for people with horizontal strabismus, but without adjustments for the length of months, or consideration of normal seasonal variation in the local population.Reference Matsuda, Nakagawa and Yokoyama18 The paucity of information regarding birth seasonality in strabismus is astounding when one considers the fact that there are about 5–9 times more people affected by strabismusReference Chew, Remaley and Tamboli19 than schizophrenia.Reference Saha, Chant, Welham and McGrath20
We determined whether there is a seasonality of births in patients with horizontal strabismus and explored how seasonalities of esotropia and exotropia compare with those previously reported for vision-related conditions. These include refractive errors (hyperopia, myopia),Reference Matsuda, Yokoyama and Nakagawa15–Reference Matsuda, Yokoyama, Fukui, Morita and Kozaki17 schizophrenia (which has frequent vision comorbidities)Reference Torrey, Miller, Rawlings and Yolken4–Reference Bembenek6, Reference Messias, Kirkpatrick and Bromet21 and congenital toxoplasmosis. Toxoplasmosis has been implicated in ocular disease/vision problemsReference Meenken, Rothova, Kijlstra and Oosting22 as well as in schizophrenia.23, Reference Torrey, Bartko and Yolken24 We examined whether esotropia and exotropia have distinct patterns of birth seasonalities, and re-examined previous reports that hyperopiaReference Matsuda, Yokoyama and Nakagawa15 and myopiaReference Mandel, Grotto and El-Yaniv16 have birth seasonalities. Furthermore, we assessed how seasonality of births in horizontal strabismus compares with schizophrenia, and with one specific type of schizophrenia: deficit schizophrenia.Reference Carpenter, Heinrichs and Wagman25–Reference Kirkpatrick and Galderisi27 Deficit schizophrenia is a well-validated subtype and may be a separate disease within the syndrome of schizophrenia.Reference Carpenter, Heinrichs and Wagman25–Reference Kirkpatrick and Galderisi27 It is thought to involve about 20% of all schizophrenia cases and has been previously proposed to have particular vision and eye abnormalities when compared to non-deficit schizophrenia.Reference Ross, Thaker and Buchanan28–Reference Nkam, Thibaut and Denise30 Parts of our study have been presented in abstract form.31
Methods
Medical records were retrospectively reviewed for all patients who were diagnosed with either esotropia or exotropia at a private ophthalmology practice in Reno, Nevada, between 2001 and 2014 (n=2513 subjects with esotropia; n=2332 subjects with exotropia). The total number of patients with diagnoses of horizontal strabismus was 4845. Although clinic-based studies do not provide information about prevalence, the ratio of esotropia to exotropia (51.9% esotropia v. 48.1% exotropia) is as would be expected for a population-based study with a significant Hispanic component.Reference Choi, Lee and Oelrich32 The clinic’s computer programs were used to compile diagnoses (esotropia, exotropia) and birth months and years. The youngest patient was 13 months and the oldest was over 90 years old. The practice in Reno provides eye care for a large fraction of the population in Washoe County and surrounding areas in Northern Nevada, with little alternative care available within a wide radius (200 km to the west, across the Sierra mountain passes, and 500–600 km distance in all other directions). We used the Washoe County birth records from 1975 through 2014 as our control population to account for the normal seasonality of births in this region.Reference Martinez-Bakker, Bakker, King and Rohani33 Nevada does not currently have, and has not previously shown, any confounding biannual fluctuations in births, as demonstrated for most southeastern states in the United States.Reference Martinez-Bakker, Bakker, King and Rohani33 The University of Nevada Biomedical Institutional Review Board (IRB) determined that this study was exempt from IRB review. Data from Osaka, Japan (n=3507 subjects with esotropia; n=3188 with exotropia) that were analyzed for this study had been de-identified,Reference Matsuda, Nakagawa and Yokoyama18 and therefore did not require IRB oversight. The total number of patients with horizontal strabismus in the Osaka clinic was 6695, with a ratio of 52.4% esotropia v. 47.6% exotropia. Such a ratio is similar to those from population-based studies in Japan.Reference Maruo, Kubota and Arimoto34 The normal seasonal variation of births in Osaka was examined for comparison, based on the report by Matsuda and Kahyo, 1994.Reference Matsuda and Kahyo35
Births were compiled for each month of each year in spreadsheets and analyzed using two types of statistical tests for seasonality. The first test was the χ2-test, which is the most popular test for comparing birth rates in specific diseases.Reference Bradbury and Miller36–Reference Nwogu, Iwueze and Nlebedim38 Since the χ2-test is not ideal for the study of seasonal patterns such as unimodal, bimodal and multiple peak patterns,Reference Verdoux, Takei, Cassou de Saint-Mathurin and Bourgeois37 we applied a second test, the Kolmogorov–Smirnov (KS) non-parametric method which was designed to test hypotheses about seasonal variation.Reference Verdoux, Takei, Cassou de Saint-Mathurin and Bourgeois37, Reference Freedman39 Since much of our data were spread over 80 years of birth months, we could not apply a time-series as an alternative approach.Reference Bradbury and Miller36, Reference Nwogu, Iwueze and Nlebedim38 For both the χ2 and the KS tests, all data were corrected for the difference in numbers of days between months (x1.0775 for the month of February = 28.25 days/year; x1.0147 for months with 30 days per year, and x0.9819 for months with 31 days per year), so that February was not by default the month with the lowest numbers due to being the shortest month. We graphed the distribution of births of people with strabismus relative to the slight seasonal variations among births of the normal local population. Monthly birth excess or reductions (seasonal birth amplitudes) were calculated by taking one-half the difference between the maxima and minima, measured as percent of the annual mean,Reference Martinez-Bakker, Bakker, King and Rohani33 after correction for lengths of months and taking into account the normal local seasonality of births. We not only compared the Nevada cohorts with the Osaka cohorts,Reference Matsuda, Yokoyama and Nakagawa15, Reference Matsuda, Nakagawa and Yokoyama18 but because the data turned out to be very similar (r-values of 0.714 and 0.686, Pearson’s r correlation test), we combined the two data sets to increase the statistical power. To compare the resulting combined data with a normal seasonal variation of births, we constructed a normal curve by calculating the mean of each month for the Washoe County and the Osaka births.Reference Matsuda and Kahyo35 Since the two sites are located at a similar latitude (39.5° for Reno, 34.7° for Osaka), the normal seasonal variation in births is expected to be,Reference Martinez-Bakker, Bakker, King and Rohani33 and indeed was, similar between the two sites.
We used both the χ2-test and the KS test to determine whether differences from the expected values were statistically significant, which is the same methodology applied in previous seasonality studies.Reference Meenken, Rothova, Kijlstra and Oosting22, Reference Bradbury and Miller36, Reference Nwogu, Iwueze and Nlebedim38, Reference Freedman39 A power analysisReference Walter40 predicted that with 2500–5000 subjects and an amplitude of 10–20%, there was a 90–100% confidence of detecting any existing trends. We compared our data with previous reports on seasonality in strabismus,Reference Matsuda, Nakagawa and Yokoyama18 hyperopia,Reference Matsuda, Yokoyama and Nakagawa15, Reference Matsuda, Yokoyama, Fukui, Morita and Kozaki17 myopia,Reference Mandel, Grotto and El-Yaniv16, Reference Matsuda, Yokoyama, Fukui, Morita and Kozaki17 as well as published reports about seasonality of births for people with schizophreniaReference Torrey, Miller, Rawlings and Yolken4, Reference Davies, Welham, Chant, Torrey and McGrath5 (well established for the Northern hemisphere),Reference Torrey, Miller, Rawlings and Yolken4–Reference Bembenek6, Reference Messias, Kirkpatrick and Bromet21 and with three studies reporting on seasonality of congenital toxoplasmosis.Reference Meenken, Rothova, Kijlstra and Oosting22, Reference Logar, Soba, Premru-Srsen and Novak-Antolic41, Reference Sagel, Mikolajczyk and Krämer42 For the precise definitions and inclusion criteria for schizophrenia diagnoses, we refer the reader to the published meta-analyses and original studies.Reference Torrey, Miller, Rawlings and Yolken4, Reference Davies, Welham, Chant, Torrey and McGrath5, Reference Messias, Kirkpatrick and Bromet21 The meta-analysis by Torrey et al. (1997) provides a detailed discussion of methodological problems.Reference Torrey, Miller, Rawlings and Yolken4 We applied error bars only to graphs when data from more than two cohorts were combined. Error bars were not reported in the schizophrenia meta-analyses of schizophrenia births.Reference Torrey, Miller, Rawlings and Yolken4, Reference Davies, Welham, Chant, Torrey and McGrath5 Because the universality of an excess of summer births among people with deficit schizophrenia has been questioned,Reference Dollfus, Brazo and Langlois43 we compiled and examined all relevant studies, including the most recent ones, to gain an up-to-date perspective on this issue. This provided a stronger confirmation of the association of deficit schizophrenia with summer births than was possible in previous studies.Reference Messias, Kirkpatrick and Bromet21
Results
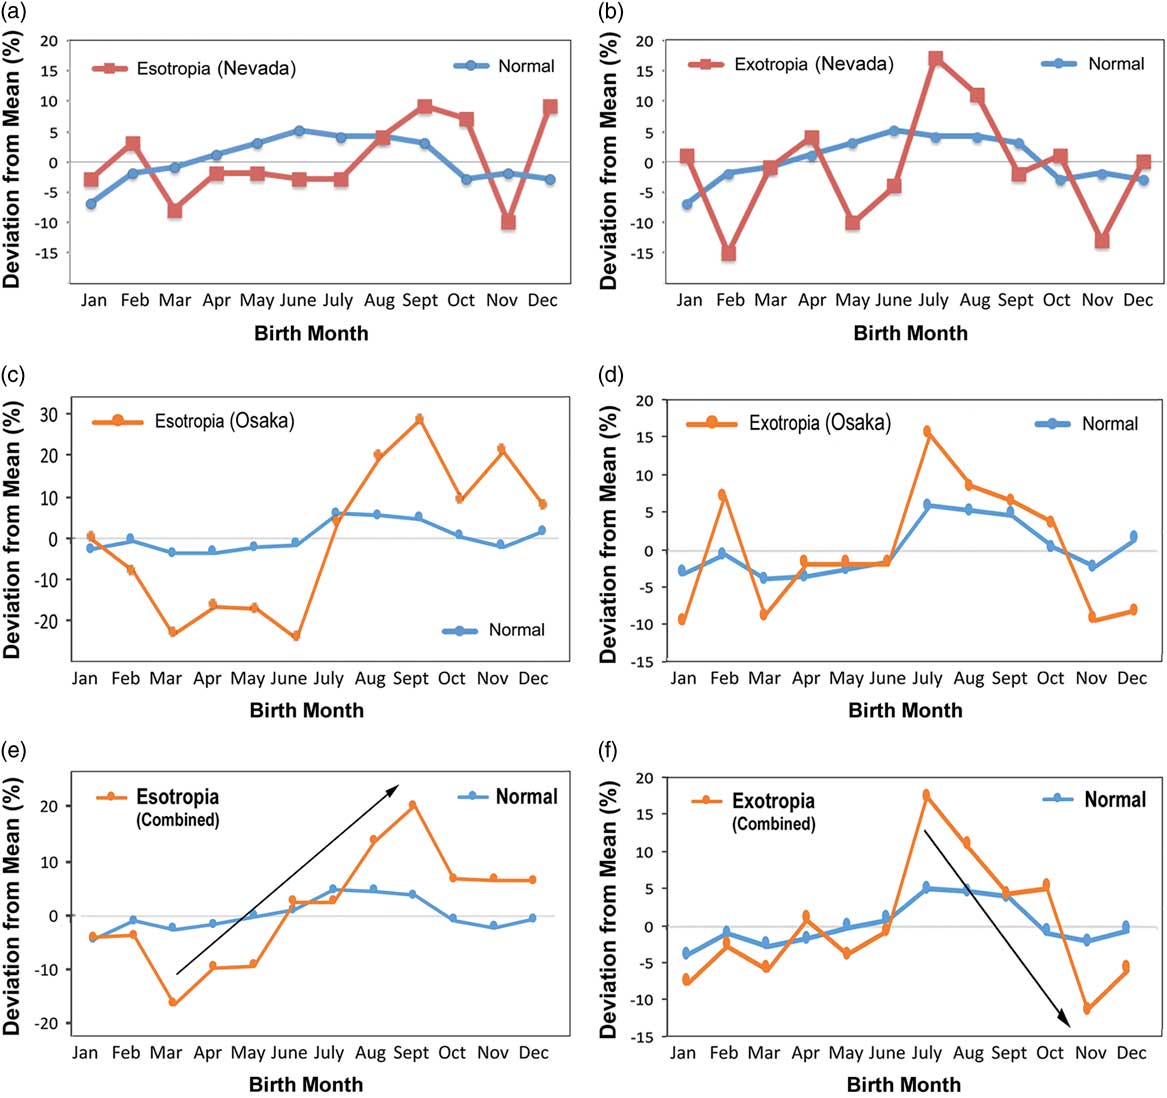
In our study, we report on data obtained from cohorts at two locations. Data from Reno, Nevada were newly obtained, while some of the data from Osaka, Japan had been reported previously.Reference Matsuda, Nakagawa and Yokoyama18 The births in the Washoe County population (n=173,635) showed seasonality in births similar to data published for the entire United States (1942–1989),Reference Lam and Miron44 (1931–2008),Reference Martinez-Bakker, Bakker, King and Rohani33 with a deficit in October through February, and an increase in May through August (peak in June), amounting to a seasonal birth amplitude (=percent deviation from the annual mean)Reference Martinez-Bakker, Bakker, King and Rohani33 of 6.0% (Fig. 1a and 1b). This pattern is consistent with the known increase in summer births in the central Western United States (latitude of Washoe County is 39.5°),Reference Martinez-Bakker, Bakker, King and Rohani33, Reference Lam and Miron44 with an expected modest increase between July and September in the state of Nevada.Reference Martinez-Bakker, Bakker, King and Rohani33 Therefore, these data provided a reliable local baseline for comparison with seasonal birth amplitudes from the patient diagnoses. Normal seasonal variation of births in Osaka was obtained from the work of a 1994 study.Reference Matsuda and Kahyo35 The normal population of Osaka had a seasonal birth amplitude of 4.85% (Fig. 1c and 1d). Because of the latitudinal gradient in peak birth timing and amplitude,Reference Martinez-Bakker, Bakker, King and Rohani33 local rather than national birth data have to be used to establish the normal seasonal variation (baseline).
Comparison of seasonality of births for horizontal strabismus from two different sites: data from Washoe County, Nevada (a, b), and Osaka, Japan (c, d), as previously reported,Reference Matsuda, Nakagawa and Yokoyama18 but without normalization to the local population. Esotropia (a, c, e); Exotropia (b, d, f). Note the similarities in the timings of peaks and troughs between the two sites. (Panel a) Esotropia births (n=2513, red squares) are shown relative to normal Washoe County births (blue dots). (Panel b) Exotropia births (n=2332, red squares) are shown relative to births in the normal Washoe County population (blue dots). (Panel c) Esotropia births from the Osaka cohort (n=3507, orange dots)Reference Matsuda, Nakagawa and Yokoyama18 are shown relative to the normal local birth seasonality (blue dots).Reference Matsuda and Kahyo35 (Panel d) Exotropia births from the Osaka cohort (n=3188, orange dots)Reference Matsuda, Nakagawa and Yokoyama18 are shown relative to the normal local birth seasonality (blue dots).Reference Matsuda and Kahyo35 Note the similarity of patterns in seasonality of births between cohorts. (Panel e) The distribution of births from the combined esotropia cohorts (Nevada and Osaka, n=6020, orange dots) are shown relative to the combined normal local variation (blue dots). The black arrow denotes the gradually increasing number of esotropia births from a trough in March to the peak in September. (Panel f) The distribution of births from the combined exotropia cohorts (Nevada and Osaka, n=5520, orange dots) are shown relative to the combined normal local variation (blue dots). The black arrow denotes the gradually decreasing number of exotropia births from a peak in July to the trough in November. Note the ‘reverse’ or ‘mirror image’ seasonality pattern between esotropia (e) and exotropia (f).

Strabismus
In Nevada, patients with esotropia (n=2513) showed a reduced number of births in March through July and an increased number of births in August through October. This data set did not reach statistical significance (P=0.2926, χ2-test; P>0.05, KS test) (Fig. 1a). Patients with exotropia (n=2333) showed a deficit in winter and spring births, and an excess number of births in July/August. The seasonality was statistically significant with the χ2-test (P=0.0070), but not with the KS test (P>0.05) (Fig. 1b).
The only previous study on the seasonality of births in strabismus – from Osaka, JapanReference Matsuda, Yokoyama and Nakagawa15, Reference Matsuda, Nakagawa and Yokoyama18 – did not correct data for length of month and normal seasonal variation. We therefore recalculated the original data and plotted the births together with the normal local seasonal variation (using the information from the 1994 study)Reference Matsuda and Kahyo35 (Fig. 1c and 1d). Esotropia births from Osaka showed a deficit of births from March to June, and a peak from August to November (Fig. 1c) – which is similar to the deficit seen in Nevada from March to July, and the peak in August through October (Fig. 1a). Exotropia births from Osaka showed a peak in July/August (Fig. 1d) that was virtually identical to Nevada’s peak in the same two months (Fig. 1b), and the winter months had the lowest numbers of births. At both sites (Nevada and Osaka), there was an abrupt increase in exotropia births in July and August, followed by a sudden decrease in October/November (Fig. 1b and 1d). The esotropia seasonality for the Osaka cohort was statistically significant with the χ2-test (P<0.0001) and with the KS method (P<0.01), while the exotropia seasonality was borderline significant with the χ2-test (P=0.0544), and did not reach statistical significance with the KS test (P>0.05). To assess the similarity of the data from the two cohorts, we calculated r-values based on Pearson’s r correlation test. The r-values for the two graphs (Washoe County and Osaka) were 0.714 and 0.686, indicating strong linear correlations. Therefore, we considering it justified to combine the data from the two cohorts to achieve a stronger statistical power.
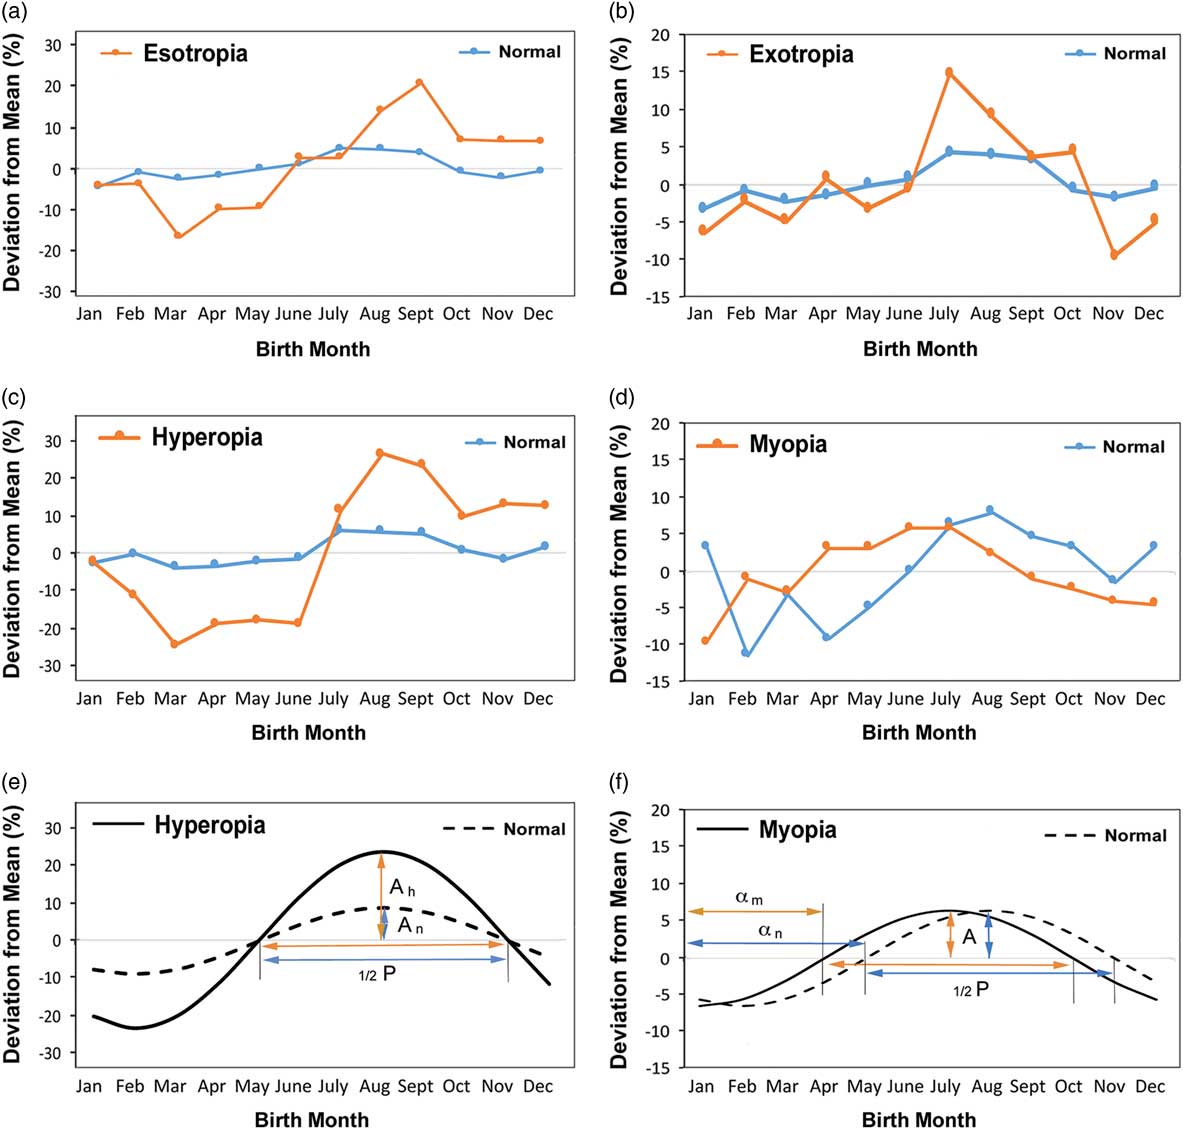
The combined data from the cohorts in Nevada and Osaka resulted in a data set of 6020 subjects with esotropia, and 5520 with exotropia. The combined numbers resulted in birth seasonality curves with less noise than those of the individual cohorts, thus making it easier to recognize patterns and trends. When compared with the expected seasonal variation, esotropia showed the greatest deficit of births in March, with a gradually increasing number of births until a peak in September (Fig. 1e), while exotropia showed an abrupt peak in July, followed by a gradual decrease in births until the greatest deficit was reached in November (Fig. 1f). Thus, the patterns and trends for esotropia and exotropia were distinctly different in their timing and directionality (see black arrows in Fig. 1e and 1f). The seasonality of esotropia was statistically significant with the χ2-test (P<0.0001) and the KS test (P<0.01), and that of exotropia was significant with the χ2-test (P=0.0002), but it did not reach significance with the KS test (P>0.05). The seasonal birth amplitude for esotropia was 19.55%, and the amplitude for exotropia was 14.65%. Both of these values greatly exceeded the seasonal birth amplitude of the combined normal population (which was 4.95%).
Refractive error
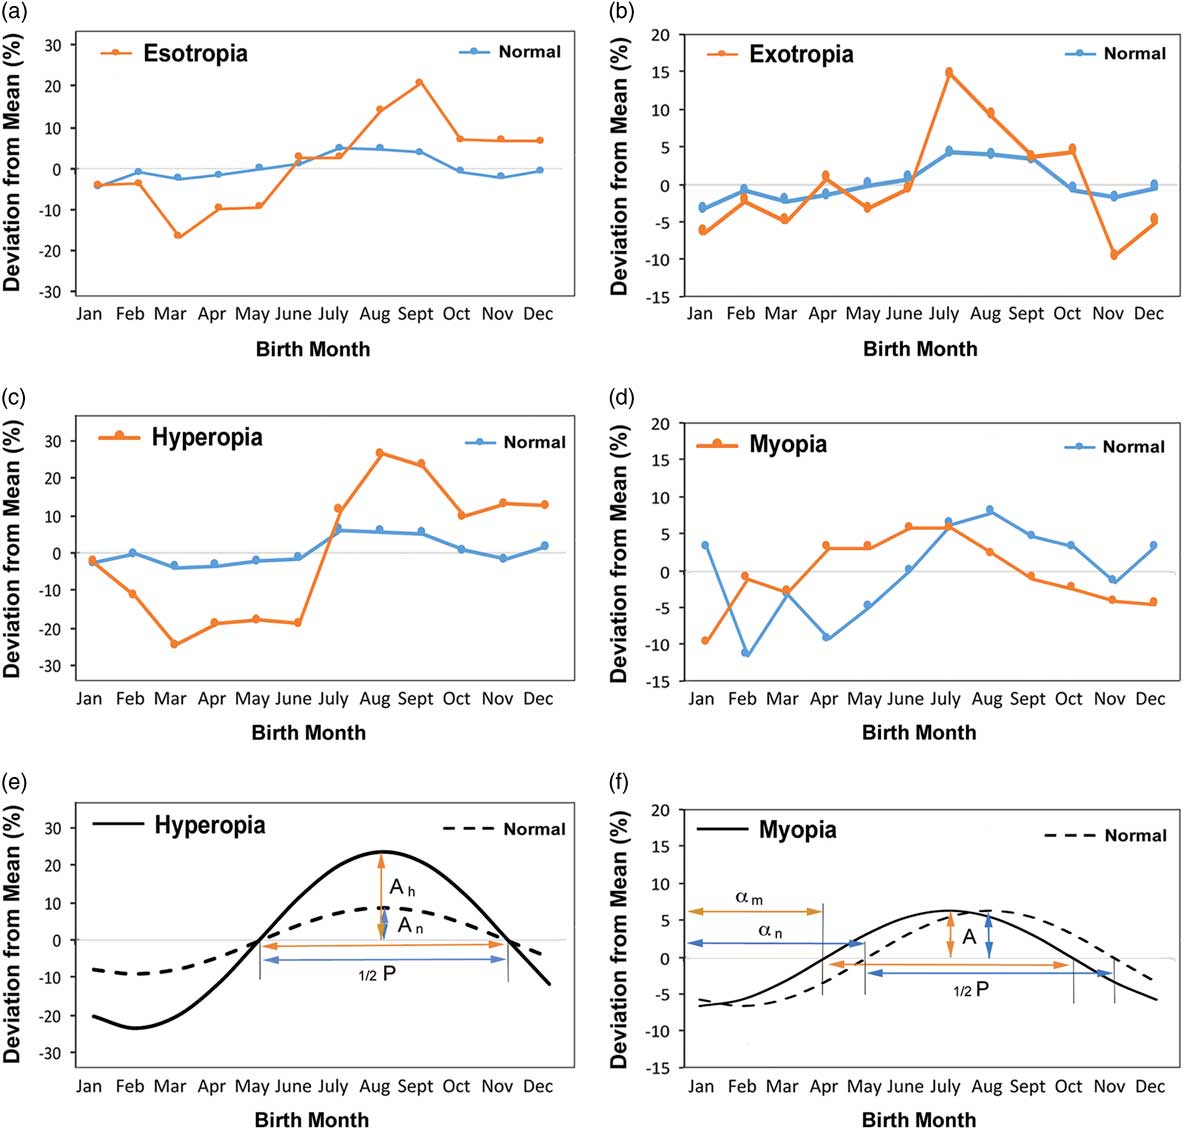
Patients with esotropia often have hyperopia, and patients with exotropia often have myopia, as has been reviewed.Reference von Noorden and Campos14 Therefore, we compared our strabismus births with previous reports of birth seasonality for severe or moderate hyperopiaReference Matsuda, Yokoyama and Nakagawa15, Reference Matsuda, Yokoyama, Fukui, Morita and Kozaki17 and severe or moderate myopia.Reference Mandel, Grotto and El-Yaniv16 We plotted the birth frequency from the Osaka studyReference Matsuda, Yokoyama, Fukui, Morita and Kozaki17 against the normal local birth seasonalityReference Matsuda and Kahyo35 (Fig. 2c). In hyperopia, the seasonal birth amplitude was enhanced more than four-fold, from 4.85 to 23.0% (Fig. 2c). When compared with esotropia births (Fig. 2a), it becomes apparent that the esotropia seasonality is essentially identical to hyperopia (r=0.8936, Pearson’s r correlation test, Fig. 2a and 2c), confirming previous conclusions.Reference Matsuda, Yokoyama and Nakagawa15 To compare esotropia and hyperopia with myopia births, we plotted the birth frequency from the 2008 Israel myopia studyReference Mandel, Grotto and El-Yaniv16 against the normal seasonal variation of the local population, as reported in 2009.Reference Friger, Shoham-Vardi and Abu-Saad45 The resulting graph (Fig. 2d) shows a phase-shift of approximately one month (Fig. 2d), but no change in seasonal birth amplitude (as was observed in hyperopia). The myopia seasonality does not resemble the exotropia seasonality (Fig. 2b and 2d). The data for myopia from a 2016 studyReference Matsuda, Yokoyama, Fukui, Morita and Kozaki17 also showed a birth deficit in October through December, but there was no sustained peak in spring and early summer births (data not shown).Reference Matsuda, Yokoyama, Fukui, Morita and Kozaki17 However, unlike the Israeli study,Reference Mandel, Grotto and El-Yaniv16 the 2016 studyReference Matsuda, Yokoyama, Fukui, Morita and Kozaki17 did not distinguish severe, moderate and mild myopia, and mild myopia showed very little seasonality.Reference Mandel, Grotto and El-Yaniv16 We fitted sine waves to the birth seasonalities of refractive error, in order to emphasize the differences with regard to amplitude and phase shift (Fig. 2e and 2f).
Comparison of seasonality of births in horizontal strabismus and refractive errors: esotropia (a), exotropia (b), hyperopia (c, e), myopia (d, f). (Panels a–d) Data from subjects with strabismus or with refractive errors are shown in orange, relative to the normal local population (blue). Data for esotropia and exotropia are the combined cohorts from Nevada and Osaka.Reference Matsuda, Nakagawa and Yokoyama18 Data for hyperopia are from Osaka,Reference Matsuda, Yokoyama, Fukui, Morita and Kozaki17, Reference Matsuda and Kahyo35 and data for myopia are from Israel.Reference Mandel, Grotto and El-Yaniv16, Reference Friger, Shoham-Vardi and Abu-Saad45 Note that the birth distribution for esotropia (a) and hyperopia (c) is very similar, while the birth distribution for exotropia (b) and myopia (d) is not. Hyperopia and myopia birth distributions form amplitude- or phase-altered sine waves, with hyperopia increasing the amplitude of the normal seasonal variation (c, e), while myopia has the same amplitude, but is phase-shifted (precocious) by about 1 month compared with the normal seasonal variation (d, f). Hyperopia births have the minimum in spring (c, e), while myopia has the minimum in winter (d, f). The seasonality curves were modeled as sine waves in panels e (hyperopia) and f (myopia). A, amplitude; Ah, amplitude for hyperopia; An, Amplitude for normal population; αm, phase shift for myopia; αn, phase shift for normal population; P, period (=wavelength); 1/2 P, one half period. Note that a sine wave’s amplitude is defined differently than a birth seasonality’s amplitude.Reference Martinez-Bakker, Bakker, King and Rohani33
Schizophrenia
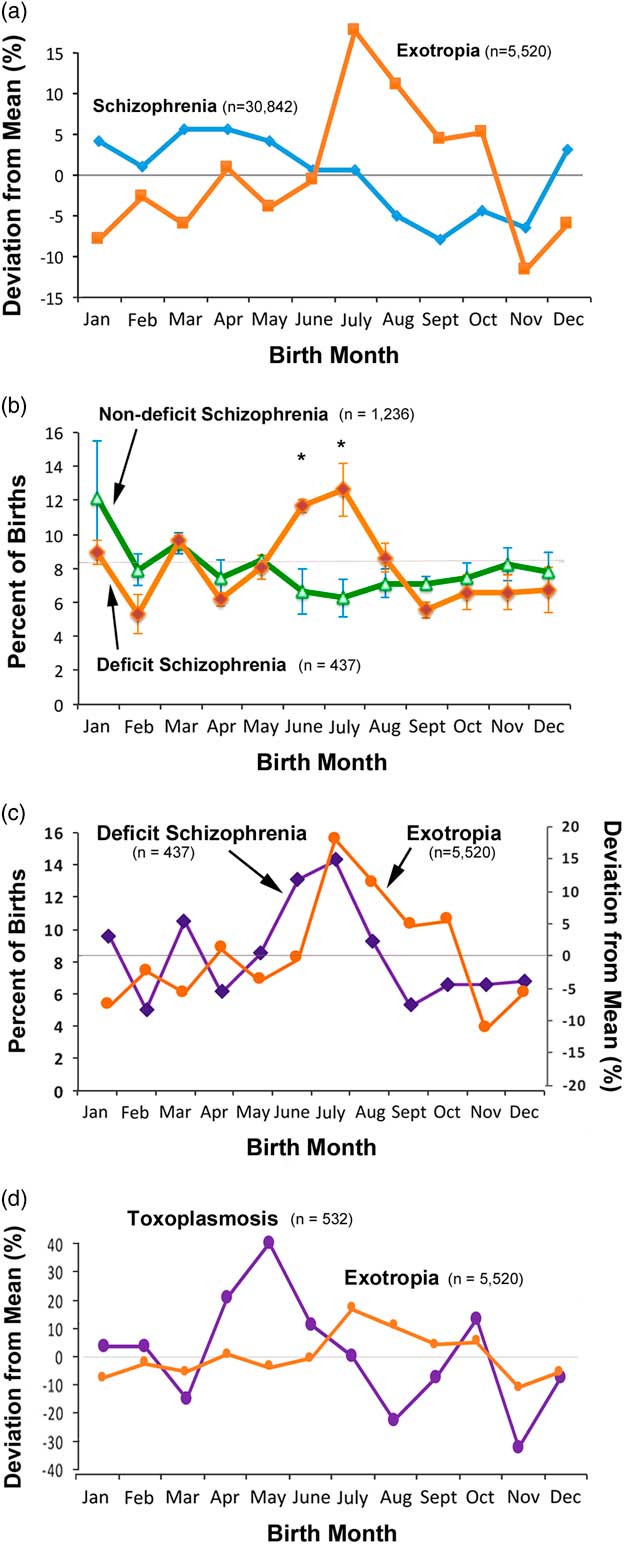
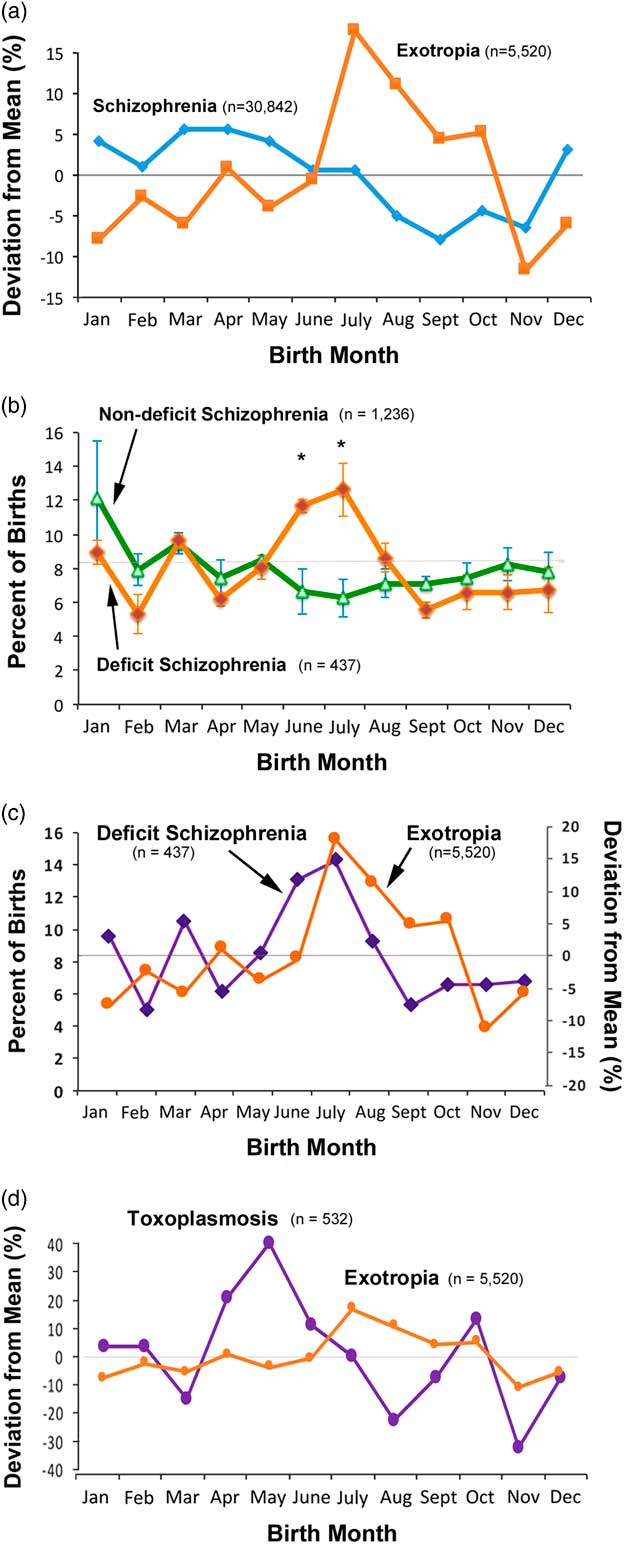
When compared with previously published data for births of patients with schizophrenia, there was no correlation between schizophrenia patients and exotropia patients (r=0.01), and a negative month-by-month correlation between exotropia patients and the majority of schizophrenia patients who have an excess of births in winter and spring months (r=−0.43)Reference Torrey, Miller, Rawlings and Yolken4, Reference Davies, Welham, Chant, Torrey and McGrath5 (Fig. 3a). However, the pattern of winter births holds only for patients with schizophrenia who have positive symptoms without enduring negative symptoms (about 80% of schizophrenia cases), but not those with enduring, primary negative symptoms, which has been termed ‘deficit schizophrenia.’Reference Carpenter, Heinrichs and Wagman25–Reference Kirkpatrick and Galderisi27 This subtype within schizophrenia has a well-replicated excess of births in summer months (pooled odds ratio of 1.95)Reference Messias, Kirkpatrick and Bromet21 (see Table 1; Fig. 3b).Reference Kallel, Brunelin and Zghal46–Reference Mete, Sarıkaya and Erol53 When we compared seasonality of births between patients with exotropia and people with schizophrenia of the deficit type, we found that the peak in these summer months was remarkably similar to that of patients with exotropia (Fig. 3a and 3b). There was a large difference in the similarity of exotropia with deficit and non-deficit schizophrenia births: non-deficit schizophrenia births were negatively correlated with exotropia births (r-values of −0.14 to −0.47);Reference Messias, Kirkpatrick and Bromet21, Reference Kallel, Brunelin and Zghal46 whereas deficit schizophrenia correlated positively and strongly (r-values ranging from +0.39 to +0.61),Reference Messias, Kirkpatrick and Bromet21, Reference Kallel, Brunelin and Zghal46 with an overall r-value of +0.62, with a z-score of 2.52, and P=0.01, which is highly significant. This is a remarkably robust result, because of the limitation of n=12, due to the monthly data collection scheme. To directly show the similarity of birth seasonality in people with exotropia and those with deficit schizophrenia, we present the two curves within the same panel (Fig. 3c).
Comparison of seasonality of births for exotropia, two types of schizophrenia, and congenital toxoplasmosis. (Panel a) Exotropia births (orange squares) compared with schizophrenia births (blue diamonds) for similar latitudes (30–39°).Reference Davies, Welham, Chant, Torrey and McGrath5 (Panel b) Comparison of births for deficit schizophrenia and non-deficit schizophrenia, compiled from four data sets.Reference Messias, Kirkpatrick and Bromet21, Reference Kallel, Brunelin and Zghal46 Data from Messias et al., 2004Reference Messias, Kirkpatrick and Bromet21 were redrawn with permission. Note that the summer peak extends into August in at least four of the nine studies showing an excess of summer births (Table 1). Note also that the period of excess births in schizophrenia as a whole extends between December and May, with some variation, but always occurs in winter/spring. Error bars = SEM. *, data points are significantly different, P<0.01, t-test. (Panel c) Comparison of the birth seasonalities of people with exotropia (combined cohorts from Nevada and Osaka) and people with deficit schizophrenia (combined cohorts from UK, Ireland, Spain, New York and Tunisia). The graph for deficit schizophrenia was plotted as percent births per month (purple scale on left side, as in the original studies), while the exotropia graph was plotted as deviation from the mean (orange scale on right side). Note the similarities between the two seasonality graphs, and thus between the two disease conditions: exotropia and deficit schizophrenia. (Panel d) Comparison of seasonality of toxoplasmosis birthsReference Meenken, Rothova, Kijlstra and Oosting22 (purple dots) and the current study’s data on exotropia (orange dots). A similar seasonality was reported in two other studies for toxoplasmosis, supporting maternal infection in winter, and an increased number of affected offspring born in spring.Reference Logar, Soba, Premru-Srsen and Novak-Antolic41, Reference Sagel, Mikolajczyk and Krämer42 Note that there is no similarity between the timing of toxoplasmosis infection and exotropia births (r-value=0.0556, Pearson’s r correlation test).
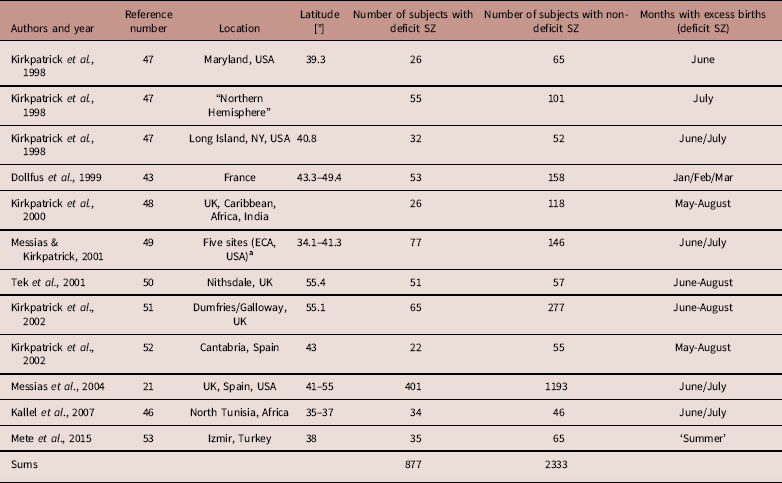
Studies on seasonality of births comparing deficit and non-deficit schizophrenia (SZ) in the Northern hemisphere

a ECA, Epidemiological Catchment Area of the National Institute of Mental Health.
Regarding the association between exotropia and schizophrenia, the significance of our finding of birth seasonalities in exotropia depends on deficit schizophrenia indeed having an excess of summer births. Since most work on summer births in deficit schizophrenia originated from one group or network (Dr. Kirkpatrick and his colleagues, see Table 1) and since one of the early studies failed to replicate this pattern,Reference Dollfus, Brazo and Langlois43 we examined the entire literature on this topic, including the most recent studies from Tunisia and Turkey.Reference Kallel, Brunelin and Zghal46, Reference Mete, Sarıkaya and Erol53 As shown in Table 1, nine out of the 10 studies support the proposed association of deficit schizophrenia with summer, rather than winter births, while non-deficit schizophrenia is associated with a peak of winter and early spring births in the Northern hemisphere, as has been established for schizophrenia as a whole in multiple meta-analyses.Reference Torrey, Miller, Rawlings and Yolken4, Reference Davies, Welham, Chant, Torrey and McGrath5
Toxoplasmosis
Since toxoplasmosis has been implicated as a risk factor for both schizophrenia23, Reference Torrey, Bartko and Yolken24 and eye disease,Reference Meenken, Rothova, Kijlstra and Oosting22 and since toxoplasmosis birth seasonality is known to be correlated with seasonality of births among people with schizophrenia as a whole,23 we compared the seasonality of births for congenital toxoplasmosis from three published studiesReference Meenken, Rothova, Kijlstra and Oosting22, Reference Logar, Soba, Premru-Srsen and Novak-Antolic41, Reference Sagel, Mikolajczyk and Krämer42 with our strabismus (exotropia) data. These studies either collected data on birthsReference Meenken, Rothova, Kijlstra and Oosting22 or maternal seroconversion (typically in the last trimester).Reference Logar, Soba, Premru-Srsen and Novak-Antolic41, Reference Sagel, Mikolajczyk and Krämer42 The three studies agree on a peak of maternal infection in winter months.Reference Meenken, Rothova, Kijlstra and Oosting22, 23 The peak of toxoplasmosis births is in May (Fig. 3d),Reference Meenken, Rothova, Kijlstra and Oosting22 which precedes the excess exotropia births in July/August by 2–3 months (there is no correlation: r-value=0.0556, Pearson’s r correlation test).
Discussion
Developmental factors can affect disease expression and prevalence.Reference Wadhwa, Buss, Entringer and Swanson1–Reference Almond and Currie3, Reference Martinez-Bakker, Bakker, King and Rohani33 Such influences may manifest through seasonal risk factors and may be visible by fluctuations in birth frequencies. Seasonality of births has been extensively studied for schizophrenia,Reference Torrey, Miller, Rawlings and Yolken4–Reference Bembenek6 but one, relatively frequent condition that is a risk factor for schizophrenia, exotropic (outwards) horizontal strabismus,Reference Agarwal, Christensen and Feng13 has remained virtually unstudied for seasonal factors. Only one previous study examined seasonality of births in patient populations with horizontal strabismus: a Japanese study in the 1980s.Reference Matsuda, Nakagawa and Yokoyama18 This older and the current study both found that patients with exotropia had a distinct excess of births in the summer months of July and August, while esotropia showed birth months with a later and broader peak, from August to October (our Nevada data) or August to December.Reference Matsuda, Nakagawa and Yokoyama18 The similarity of patterns between the two studies suggests that this seasonality is a global, rather than a local phenomenon. Importantly, the timing of the summer births is very similar to that seen in one type of schizophrenia: deficit schizophrenia, which has been previously associated with distinct oculomotor and vision abnormalities.Reference Ross, Thaker and Buchanan28–Reference Nkam, Thibaut and Denise30
Multiple factors may contribute to seasonality of births, including seasonal viral and parasitic maternal infections and immune reactions,Reference Torrey, Miller, Rawlings and Yolken4, Reference Meenken, Rothova, Kijlstra and Oosting22, Reference Martinez-Bakker, Bakker, King and Rohani33, Reference Brown and Patterson54 temperature, rainfall,Reference McGrath, Selten and Chant55, Reference Messias, Mourao and Maia56 dietary fluctuations, differences in sperm quality, external toxins,Reference Torrey, Miller, Rawlings and Yolken4 cultural variation of procreation,Reference Häfner, Haas, Pfeifer-Kurda, Eichhorn and Michitsuji57, Reference Tochigi, Okazaki, Kato and Sasaki58 effects of religious rules and customs (including Christmas, the Hajj and Ramadan),Reference Friger, Shoham-Vardi and Abu-Saad45, Reference Odegård59 and vitamin D and light (sunshine) exposure.Reference McGrath, Selten and Chant55 Interestingly, variation in the length of daylight appears to be a relevant factor that affects eye growth and therefore pertains to myopia/hyperopia,Reference Mandel, Grotto and El-Yaniv16 with a peak sensitive period that was calculated to be at about 5 months of age.Reference Matsuda, Yokoyama, Fukui, Morita and Kozaki17
Refractive errors
We are intrigued by our finding of a seemingly reverse pattern of esotropia and exotropia seasonality: esotropia shows a gradually increasing number of births in the first half of the year, from March until September, while exotropia shows a gradually decreasing number of births in the second half of the year, from July through November (compare Fig. 2e with Fig. 2f). This pattern – resembling in some ways a mirror image – suggests a gradually advancing factor in spring/summer for esotropia, possibly due to an increasing period of light or increasing deviation from the average length of the light period,Reference Matsuda, Yokoyama, Fukui, Morita and Kozaki17 until a distinct peak and reversal point is reached in September (Fig. 1e). On the other hand, exotropia births display an abrupt peak and reversal point in July, followed by a gradual decrease to a minimum in November (Fig. 1f), possibly due to a decreasing period of light or decreasing deviation from the average length of the light period.Reference Matsuda, Yokoyama, Fukui, Morita and Kozaki17 We found that seasonality of hyperopia and myopia involves a distinct phase-shifting of the sine-wave between the two conditions, as illustrated in Fig. 2e and 2f. Recognition of these distinct seasonal patterns constitutes an extension of previous work,Reference Matsuda, Yokoyama, Fukui, Morita and Kozaki17 and strongly suggests that changes in light periods and light exposure are involved, since the peak and turning point between the two conditions’ seasonality marks the time of maximal light in the Northern hemisphere. Elucidation of the relevant parameters requires further studies, since the current conclusions rely on only one or two reports for each condition. A third myopia studyReference McMahon, Zayats and Chen60 generally confirmed the conclusions of the previous two studies,Reference Mandel, Grotto and El-Yaniv16, Reference Matsuda, Nakagawa and Yokoyama18 but did not report monthly births (and did not compare with normal seasonal variation), and therefore could not be evaluated for the apparent phase shift of 1–2 months.Reference McMahon, Zayats and Chen60 The seasonal and daily changes in the eye and eye growth that occur in response to light and darkness are complex and, despite significant progress, have to date eluded any simple or even comprehensive explanations.Reference Nickla61
Schizophrenia
Regarding the hypothesis of a similar pattern of births for patients with exotropia and patients with schizophrenia, we did not find a pattern in exotropia patients similar to that of subjects with schizophrenia as a whole (i.e., with and without primary negative symptoms), who have an excess of winter/spring births.Reference Torrey, Miller, Rawlings and Yolken4, Reference Davies, Welham, Chant, Torrey and McGrath5 This shows that patients with the main type of schizophrenia do not have a birth seasonality similar to patients with exotropia. However, a sizable fraction of patients with schizophrenia (about 20%) have a well-validated, distinct syndrome with primary negative symptoms. Patients with these clinical features differ from those without such features in multiple ways, including other signs and symptoms, course of illness, biological correlates, etiological risk factors and treatment response.Reference Carpenter, Heinrichs and Wagman25–Reference Kirkpatrick and Galderisi27 People with this type of schizophrenia (deficit schizophrenia with primary negative symptoms) have a replicated excess of births in summer months (June–JulyReference Messias, Kirkpatrick and Bromet21, Reference Kirkpatrick, Ram and Amador47–Reference Messias and Kirkpatrick49, Reference Kirkpatrick, Tek, Allardyce, Morrison and McCreadie51 or May–August,Reference Kirkpatrick, Castle, Murray and Carpenter48, Reference Tek, Kirkpatrick, Kelly and McCreadie50, Reference Kirkpatrick, Herrera Castanedo and Vazquez-Barquero52 Table 1). It has been concluded that the size of the season-of-birth effect in schizophrenia as a whole is larger in sites further away from the equator, and therefore geographic locations of similar latitudes need to be compared.Reference Davies, Welham, Chant, Torrey and McGrath5, Reference Messias and Kirkpatrick49, Reference Welham, Chant and Saha62 Multiple studies examining the seasonality of births in deficit schizophrenia have been conducted at 34–55° latitude in the Northern hemisphere (Table 1), which includes the latitudes of our cohorts in Washoe County (39.5°) and in Osaka (34.7°).Reference Matsuda, Nakagawa and Yokoyama18 The season of birth effect reveals that etiologically distinct subgroups within schizophrenia may be differentially influenced by genes and the environment.Reference Franzek and Beckmann63 We wish to emphasize that similarity in seasonality of births does not prove disease association or any causality between diseases – its presence (similarity) only makes a developmental association more likely, while a dissimilarity makes an association less likely.
Regarding the magnitude of the winter/spring birth excess for schizophrenia as a whole, this is often stated to be about 5–8%.Reference Torrey, Miller, Rawlings and Yolken4, Reference Davies, Welham, Chant, Torrey and McGrath5 It should be noted that this excess would be considerably larger for people with schizophrenia of the non-deficit type when one subtracts people with schizophrenia of the deficit type.Reference Messias, Kirkpatrick and Bromet21 Since this subgroup has a substantial excess in summer births (Table 1), this would increase the effect size of winter/spring births for people with non-deficit schizophrenia.
The nature of the association between exotropia and schizophrenia remains unclear, but vision appears to be fundamental for the development of schizophrenia. Congenital blindness (or very early loss of vision) has been reported to protect against developing schizophrenia,Reference Silverstein, Wang and Keane64, Reference Landgraf and Osterheider65 while abnormal vision and/or abnormal early visual experiences (as would be frequent in children with exotropia) appears to be a significant risk factor for schizophrenia.Reference Agarwal, Christensen and Feng13
Our findings raise the possibility that exotropia is a risk factor specifically for deficit schizophrenia. The question whether people with deficit schizophrenia have exotropia more often than would otherwise be expected has not yet been tested, but should be explored. If exotropia is indeed a risk factor primarily for development of schizophrenia with negative symptoms, then this could provide new insights into the pathophysiological etiology of this type of schizophrenia.
It has been recommended that children diagnosed with exotropia should be monitored for mental illness and in particular signs of psychosis and development of schizophrenia.Reference Schiffman, Maeda and Hayashi7, Reference Mohney, McKenzie and Capo8, Reference Ndlovu, Nhleko and Pillay12 Recent work did not find that surgical correction of childhood exotropia significantly affected the rate of mental illness in younger people (mental illness diagnosed at 8–18 years of age),Reference Kilgore, Barraza, Hodge, McKenzie and Mohney66 but the question for schizophrenia, which has a peak for first diagnosis at 18–25 years of age for males and 25–35 for females,Reference Ochoa, Usall, Cobo, Labad and Kulkarni67 remains unexplored.
Limitations of our study include that our subject numbers, even when cohorts were combined (n=6020 for esotropia, and n=5520 for exotropia), were smaller and therefore statistically less robust than some previous studies, for example, on myopia (~30,000 subjects with severe or moderate myopia).Reference Mandel, Grotto and El-Yaniv16 We investigated only strabismus, but not schizophrenia and its different subtypes, in the same population, so we had to compare our data with those from previous studies at other sites (Table 1). Future research with additional cohorts is needed to confirm that exotropia is associated with a peak of births in summer months, to explore possible reasons for the seasonality of exotropia births, and to determine whether exotropia is indeed linked primarily to the deficit type of schizophrenia rather than schizophrenia with positive symptoms. This line of research may identify strategies for disease prevention, since some developmental risk factors such as light exposure and misalignment of eyes during infancy can be manipulated or controlled.
Conclusions
People with esotropia and exotropia have seasonality of births, as do people with hyperopia or myopia, but with distinctly different patterns when compared with the seasonal variation in the normal population. Exotropia showed significant excess in summer births that correlated with the seasonality of births for deficit schizophrenia, but not schizophrenia as a whole. Further studies are needed to confirm the link between exotropia and deficit schizophrenia, and explore its etiology.
Acknowledgments
The authors thank Kyra Morgan, Chief Biostatistician, Nevada Division of Public and Behavioral Health, Carson City, Nevada, and the office staff of Sierra Eye Associates, Reno, Nevada for help with data collection and processing. The authors also thank Dr. Fuller Torrey (Stanley Medical Research Institute, Kensington, MD) for helpful comments on this project.
Financial support
This work was supported by grants from the National Institutes of Health (C.S.v.B, GM103554 and GM104944).
Conflicts of interest
Except for B.K., the authors have no conflict of interests or potentially conflicting interests. B.K. receives licensing royalties and travel support from ProPhase for use of the brief negative symptoms scale (BNSS) by for-profit groups; these fees will be donated to the Brain and Behavior Research Foundation. He has also received fees and travel support from ProPhase for teaching the BNSS, consulting fees and travel support from Genentech/Roche, and consulting fees to anonymized pharmaceutical companies through Decision Resources, Inc. He also receives fees from Walsh Medical Media for editorial services, and received fees for editorial services from Physicians Postgraduate Press, Inc.
Ethical standards
The authors assert that all procedures contributing to this work comply with the ethical standards of the relevant national guidelines on human experimentation (Code of Federal Regulations on the Protection of Human Subjects, 45 CFR) and with the Helsinki Declaration of 1975, as revised in 2008, and has been reviewed by the institutional committee (University of Nevada, Reno Biomedical IRB). The IRB determined that this project is exempt from IRB review according to federal regulations (Exemption category #4; Decision Date: December 29, 2014; Reference Number 699359-1).