




No CrossRef data available.
SEQUENTIAL CHANGE-POINT DETECTION IN GARCH(p,q) MODELS
Published online by Cambridge University Press: 01 December 2004
Abstract
We suggest a sequential monitoring scheme to detect changes in the parameters of a GARCH(p,q) sequence. The procedure is based on quasi-likelihood scores and does not use model residuals. Unlike for linear regression models, the squared residuals of nonlinear time series models such as generalized autoregressive conditional heteroskedasticity (GARCH) do not satisfy a functional central limit theorem with a Wiener process as a limit, so its boundary crossing probabilities cannot be used. Our procedure nevertheless has an asymptotically controlled size, and, moreover, the conditions on the boundary function are very simple; it can be chosen as a constant. We establish the asymptotic properties of our monitoring scheme under both the null of no change in parameters and the alternative of a change in parameters and investigate its finite-sample behavior by means of a small simulation study.This research was partially supported by NSF grant INT-0223262 and NATO grant PST.CLG.977607. The work of the first author was supported by the Hungarian National Foundation for Scientific Research, grants T 29621, 37886; the work of the second author was supported by NSERC Canada.
Information
- Type
- Research Article
- Information
- Copyright
- © 2004 Cambridge University Press
1. INTRODUCTION
The assumption that the parameters remain stable over time plays a crucial role in statistical modeling and inference. If the parameters have changed within the observed sample, then, e.g., forecasts lose accuracy and the parameter estimates no longer provide meaningful information. Because of the importance of parameter stability, the detection of possible changes in the data generating process has become an active area of research. There are hundreds of papers studying various aspects of change-point detection in econometric settings. We list those most closely related to the present work later in this section. For surveys concerned with the general statistical methodology for change-point detection, we refer to Besseville and Nikifirov (1993), Brodsky and Darkhovsky (1993, 2000), and Csörgő and Horváth (1997).
The present paper is motivated by the work of Chu, Stinchcombe, and White (1996), who pose the following problem: “Given a previously estimated model, the arrival of new data invites the question: is yesterday's model capable of explaining today's data?” These authors develop fluctuation and cumulative sum (CUSUM) monitoring procedures for linear regression models. Our paper focuses on generalized autoregressive conditional heteroskedasticity (GARCH) models, which are important in financial applications (see, e.g., Gouriéroux, 1997) and, as explained later, differ from linear models in ways that make a direct application of the approach of Chu et al. (1996) not readily possible.
Before outlining the central ideas of Chu et al. (1996) and contrasting our approach with theirs, we note that procedures for detecting parameter changes in a GARCH specification may have a number of useful applications. For example, risk managers use GARCH for calculating portfolio risk measures such as value at risk. GARCH parameters are typically estimated over a rolling window of returns, and change points in this window will introduce bias. Similarly, option traders use GARCH to make up for the well-known biases in Black–Scholes option prices. A detection of parameter changes may lead to a more cautious interpretation of the calculated option prices. Although our paper is not concerned with such applied issues, we do hope that it will make a contribution to the important problem of monitoring for changes in GARCH models.
As argued convincingly in Chu et al. (1996), the sequential analysis of economic and financial data is somewhat different from engineering applications. The sampling is costless under the no change null hypothesis, and no action is required if the observed processes is “in control,” i.e., there is no change in the parameters of the data generating process. Because it is impossible to eliminate false alarm due to chance, the probability of stopping under the no change null hypothesis should be less than a given level 0 < α < 1. On the other hand, it is desirable to stop with probability one if a change occurs. With these goals in mind, Chu et al. (1996) propose to consider decisions functions of the form

where m denotes the number of initial observations used to estimate the model and the

are model residuals that are estimated sequentially. The idea of their procedure is as follows: denoting by W(·) the standard Wiener process, suppose it can be shown that, as m → ∞,

and that a function g can be found such that

provided the sequence Sn satisfies a functional central limit theorem. It can then be concluded from (1.2) and (1.3) that

For several judicious choices of g, the probability on the right-hand side of (1.4) can be computed analytically, and consequently a monitoring scheme can be developed such that asymptotically, as m → ∞, the decision function |Qt(m)| crosses the boundary

at some future date n with a prescribed probability α, provided the parameters have not changed.
The present paper is concerned with the detection of changes in GARCH(p,q) processes that are used to model volatility. Statistics designed for detecting changes in volatility are typically based on the squares of observations or the squares of residuals. The squares of residuals from a GARCH(p,q) process do not satisfy a functional limit theorem with the Wiener process in the limit because of the presence of extra terms in their covariance structure (see, e.g., Boldin, 1998; Horváth, Kokoszka, and Teyssière, 2001; Koul, 2002, Ch. 8; Berkes and Horváth, 2003; Kulperger and Yu, 2003). Thus the approach of Chu et al. (1996) cannot be readily applied. In this paper, we put forward a different approach that does not use model residuals but relies more directly on the quasi-likelihood function. Suppose we have observed y1,…,ym for which we have postulated a model with d parameters. Denote by u a generic element of the parameter space and by

the conditional quasi-likelihood of yi given yi−1,…,y1, so that the quasi-likelihood function is

. For time series models, the

typically cannot be computed exactly because of the dependence on the unobserved yk,k ≤ 0, and some approximations

must be used instead. Denote by

the d-dimensional row vector of partial derivatives with respect to the model parameters and consider the matrix

where

is the quasi–maximum likelihood parameter estimate. We can now construct the d-dimensional process

Our approach relies on the realization that the process Gm(·) can be well approximated by the process

where Wj(·),j = 1,…d are independent standard Wiener processes. By taking appropriate functionals, it is then easy to construct a monitoring scheme with a controlled probability of a false rejection of the null hypothesis. The details are presented in Section 3.
Although the preceding idea is applicable to essentially any parametric model for which a reasonable approximate quasi-likelihood function can be found, a rigorous verification for a complex nonlinear model requires some effort. First of all, appropriate approximations

must be used. To obtain them, we use an expansion developed in Berkes, Horváth, and Kokoszka (2003), which is described in Section 2. Second, asymptotics for the matrix

in (1.5) must be established that allow us to approximate the process G(·) by a bridge-type multidimensional Gaussian process (see Lemma 6.6 in Section 6). The corresponding result is stated in Proposition 3.1, which is proved in Section 5. Finally, the partial sum process

must be carefully approximated, which is accomplished in several stages presented in Section 6.
By considering the quasi-likelihood scores, our approach is related to that of Nyblom (1989), but it is different in that our focus is on controlling the probability of false alarms, whereas Nyblom (1989) concentrates on constructing locally most powerful tests against alternatives that assume that the parameter changes θk − θk−1 from time k − 1 to time k form a martingale sequence with known covariance matrices Gk = E [(θk − θk−1)(θk − θk−1)T]. Such assumptions are not appropriate in the context of on-line monitoring for a change in the GARCH(p,q) parameters. Moreover, to prove a functional limit theorem similar to our relation (6.53), Nyblom (1989) needs to impose a number of additional technical assumptions on the asymptotic properties of the likelihood scores. Our assumptions pertain only to model parameters and the distribution of the model errors and are very weak, essentially necessary for the consistency and asymptotic normality of the quasi–maximum likelihood estimator. Another important contribution to the theory of optimal a posteriori (in-sample) change-point tests under local alternatives is made by Sowell (1996), who considers a much more general setting. His assumptions, however, also impose various conditions on scorelike objects rather than on the model parameters and errors.
There has been a growing literature concerned with the change-point problem specifically in GARCH setting or with a more general problem of detecting changes in volatility. Lamoureux and Lastrapes (1990) and Mikosch and Stărică (2002), among others, show that change points in a GARCH specification may lead to the presence of spurious persistence in volatility. Mikosch and Stărică (2002) also propose a periodogram-based on-line change-point detection procedure but do not develop it theoretically. The following papers deal with change-point detection in a historical sample (a posteriori methods). Inclan and Tiao (1994), Kokoszka and Leipus (1999, 2000), Kim, Cho, and Lee (2000), and Andreou and Ghysels (2002) study CUSUM type tests based on squared observations. Tests based on the empirical distribution function of the squared residuals are studied by Horváth et al. (2001) and Kokoszka and Teyssière (2002). Inoue (2001) proposes a simulation-based method based on the empirical distribution function of the observations and applies it to stochastic volatility models. CUSUM tests based on the partial sums of powers of residuals are developed by Kulperger and Yu (2003). Kokoszka and Teyssière (2002) also study a generalized likelihood ratio test. Chu (1995) and Lundbergh and Teräsvirta (2002) investigate Lagrange multiplier tests. The preceding list is not meant to be exhaustive but is intended to indicate a recent interest in and a variety of approaches to the problem of change-point detection in GARCH processes. For a review of sequential testing strategies in the case of independent observations, see, e.g., Gombay (1996, 2003).
The paper is organized as follows. In Section 2 we present the necessary technical background on GARCH processes, which includes very weak assumptions on the model parameters and errors. In particular, we do not require that the innovations εi have a smooth density or that the observations yi have finite expected value. Section 3 describes the monitoring scheme and contains results establishing its asymptotic behavior under the null and under the alternative. Results of a small simulation study are presented in Section 4. Proofs are collected in Sections 5–7.
2. DEFINITIONS AND ASSUMPTIONS
In this section we present the general framework used throughout the paper. We recall the definition of a GARCH(p,q) process and present recursions needed to define the quasi–maximum likelihood estimator. We state the conditions for the existence of a stationary solution to the GARCH(p,q) equations and for the consistency and asymptotic normality of the maximum likelihood estimator. The section is based primarily on the results of Bougerol and Picard (1992a, 1992b) and Berkes et al. (2003).
We assume that

and under the no change null hypothesis

where θ = (ω,α1,…,αp,β1,…,βq) is the parameter of the process. Under the alternative

i.e., a change in the parameters occurred at time k* and the new parameter is θ* = (ω*,α1*,…, αp*,β1*,…,βq*). In the following discussion, we refer to the specification (2.9) as the null hypothesis H0 and to (2.10) for some integer k* as the alternative hypothesis HA.
Throughout this paper we assume that

Note that like Bougerol and Picard (1992a) we do not assume that the errors εk have mean zero. Our procedure is not based on the deviations of residuals from zero. Additional assumptions on the distribution of the εk are stated in conditions (2.17)–(2.19).
Our procedure is based on the quasi–maximum likelihood estimator of the parameters of a GARCH process developed by Lee and Hansen (1994), Lumsdaine (1996), and Berkes et al. (2003). (For a more general method we refer to Berkes and Horváth, 2004.) To define this estimator for general GARCH(p,q) processes, denote by u = (x,s1,…,sp,t1,…,tq) the generic element of the parameter space U, which, following Berkes et al. (2003), is defined as follows: let 0 < u < u, 0 < ρ0 < 1, qu < ρ0. Then

We assume that

Define now the log quasi-likelihood function as

where

The functions ci(u), 0 ≤ i < ∞ are defined by recursion. If q ≥ p, then

and if q < p, the preceding equations are replaced with

In general, if i > R = max(p,q), then

The preceding recursions ensure that for the true value θ, σk2 = c0(θ) + [sum ]1≤i<∞ ci(θ)yk−i2.
To formulate a necessary and sufficient condition for the existence of a unique stationary sequence satisfying (2.8) and (2.9) we must introduce further notation. Let
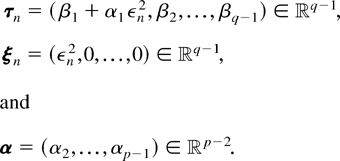
(Clearly, without loss of generality we may and shall assume min(p,q) ≥ 2.) Define the (p + q − 1) × (p + q − 1) matrix An, written in block form, by

where Iq−1 and Ip−2 are the identity matrices of size q − 1 and p − 2, respectively. The norm of any d × d matrix M is defined by

where ∥·∥d is the euclidean norm in

. The top Lyapunov exponent γL associated with the sequence {An,−∞ < n < ∞} is

assuming that

(We note that ∥A0∥ ≥ 1; cf. Berkes et al., 2003.) Bougerol and Picard (1992a, 1992b) show that if (2.13) holds, then (2.8) and (2.9) have a unique stationary solution if and only if

We note that (2.14) implies β1 + ··· + βq < 1 (cf. Bougerol and Picard, 1992b).
The next two conditions are needed to uniquely identify the parameter θ:

and

We also assume

which will be needed to estimate the moments of w0(u)/w0(θ) (cf. Berkes et al., 2003).
Finally, the last set of conditions concerns the moments of ε0:

and

Berkes et al. (2003) show that

is asymptotically normal if (2.8), (2.9), and (2.13)–(2.19) hold.
3. MAIN RESULTS
Suppose we have observed y1,…,ym, which represent available historical data. The estimator for the unknown parameter θ based on these data is defined by

where U is a suitably chosen compact set defined in Section 2. Using the notation introduced in Section 2, we also define the conditional likelihoods

and the matrix

(Here T denotes the transpose of vectors and matrices.)
Let |·| denote the maximum norm of vectors and matrices. We can now define the stopping time km as

If km < ∞, we say that a change occurred. We choose the boundary function b(t) so that

where 0 < α < 1 is a prescribed number and

Recall that H0 is defined by (2.8) and (2.9) and HA by (2.8) and (2.10). Conditions on the boundary function b(·) are specified in the following two sections, which study the asymptotic behavior of the monitoring scheme, respectively, under H0 and HA. Unlike for the scheme of Chu et al. (1996), which requires more complex boundary functions, in our setting, the simplest choice satisfying all the assumptions is to take a constant b(t) = b > 0.
3.1. Monitoring Scheme under H0
Throughout this section we assume that (2.8) and (2.9) hold.
It follows from the definition that the matrix

is nonnegative definite. We show in Proposition 3.1, which follows, that

is nonsingular with probability tending to one as m → ∞. Hence

exists with probability tending to one as m → ∞.
To formulate Proposition 3.1, we define

Finally, define

PROPOSITION 3.1. If (2.8), (2.9), and (2.13)–(2.19) are satisfied, then

Also, D is a positive definite, nonsingular matrix.
The proof of Proposition 3.1 is presented in Section 5.
We impose the following conditions on the boundary function b(t):

and

THEOREM 3.1. If (2.8), (2.9), (2.13)–(2.19), and conditions (3.23) and (3.24) are satisfied, then

where {W(t), 0 ≤ t ≤ 1} denotes a Wiener process.
The proof of Theorem 3.1 is presented in Section 6.
Choosing b(t) = b, a constant function, and using the well-known formula for the distribution function of sup0≤t≤1|W(t)| (cf. Csörgő and Révész, 1981, p. 43) we obtain the following corollary.
COROLLARY 3.1. If (2.8), (2.9), (2.13)–(2.19), and conditions (3.23) and (3.24) are satisfied, then

Corollary 3.1 allows us to specify the critical level b for any significance level α in (3.21).
3.2. Monitoring Scheme under HA
Under the alternative (2.10) the parameter changes from θ to θ* at time k* > m. We define the sequence {zk, −∞ < k < ∞}, which represents the model after a change in parameters, by the equations

and

The error sequence εk has not changed.
Our first condition is that the parameter θ* defines a GARCH(p,q) process. The vectors

are defined as τn and α in Section 2, but αi and βi are replaced by αi* and βj*. Similarly to An we define

The top Lyapunov exponent of the sequence An*, −∞ < n < ∞ is denoted by γL*. As in Section 2, the equations (3.25) and (3.26) have a unique stationary solution if and only if

assuming that

Similarly to

we define

Hence

Let

We assume that

and

We note that under some regularity conditions g′(u) = 0 if and only if u = θ* (cf. Berkes et al., 2003, Lemma 5.5). We also assume that

and

THEOREM 3.2. If (2.8), (2.10), (2.13)–(2.19), (3.23), (3.24), and (3.25)–(3.32) hold, then

The proof of Theorem 3.2 is presented in Section 7.
4. SIMULATIONS
In this section we report the results of a simulation study intended to assess the behavior of the procedure in finite samples. Even before we commenced the numerical experiments, it was clear to us that much larger sample sizes than those considered by Chu et al. (1996) would be needed for the asymptotic behavior to manifest itself. There are two main reasons for this. First, the required model estimation in Chu et al. consists essentially in estimating the mean of normal variables, and it is well known that already for samples of size 50 such estimates are very accurate. In our context, we have to estimate the parameters of a GARCH process via nonlinear optimization. It is well known that although these estimates are optimal when the innovations are normal (the case we considered in the simulation study), they may have large biases and standard errors even for samples as large as 1,000. For a sample size of 1,000, these estimators are accurate for a wide range of parameters, but for some choices of parameters they exhibit large biases. Second, our procedure requires the estimation of the covariance matrix

. Because there is no close formula for

, it would have to be estimated even if the parameters were known. We conducted a number of experiments, not reported here in a systematic way, in which we used the exact values of the GARCH parameters rather than their estimates. Even in this situation, samples of size about 1,000 are required to obtain relatively stable estimates of

.
We now proceed with a detailed description of our simulation study and the conclusions it leads to. We focused on the popular GARCH(1,1) models and considered a wide range of the parameters ω, α1, and β1. The GARCH models were simulated and estimated using the S+ module GARCH, whereas for the estimation of

it was necessary to write a much faster C++ code and interface it with S+.
We report the results for three GARCH(1,1) models:
Model I: ω = 0.05, α1 = 0.4, β1 = 0.3;
Model II: ω = 0.05, α1 = 0.5, β1 = 0.0;
Model III: ω = 1.0, α1 = 0.3, β1 = 0.2.
The results for these three models are fairly representative of the overall conclusions.
To facilitate the graphical presentation of the results, we work with the normalized decision function

A change in parameters is signaled if C(k) > c(α), where c(α) satisfies

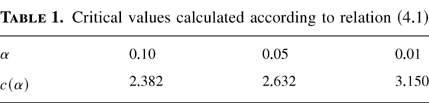
Table 1 gives the critical values for the conventional significance levels.
Critical values calculated according to relation (4.1)

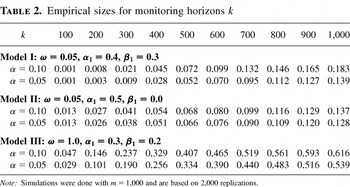
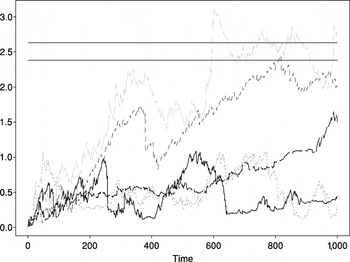
In Table 2 we report the empirical rejection probabilities of the null hypothesis of no change in the model parameters assuming this hypothesis is true. It is seen that for models with pronounced GARCH characteristics, i.e., parameters α1 and β1 much larger than ω, the procedure has correct size for monitoring horizons of about 500 time units with the 10% bound being somewhat more reliable. By a monitoring horizon we understand here the length of time we are willing to use the procedure without updating the parameters. We note that the theory developed in this paper shows that the empirical size tends to the nominal size as m → ∞, so for any finite m size distortions will be present. This is particularly visible if the GARCH parameters are difficult to estimate, as in Model III (the process looks more like a white noise); the procedure has a high probability of type I error. We conjecture that in such situations m much larger than 1,000 would be required to obtain empirical size close to the nominal size. Using the true values of α1, β1, and ω, leads to entries about half the size of those reported in Table 2. With m = 1,000, the method is not accurate for monitoring horizons longer than 500 and cannot be used in an automatic way. As we mention in the discussion toward the end of this section, a visual real-time inspection of the graph of C(k) following an alarm (critical level exceeded) might indicate that there is no reason to suspect a change in model parameters (see Figure 3). Alternatively, finite-sample corrections could be obtained by simulation for specific values of m and monitoring horizons of interest. Such simulations would be specific to a problem at hand and have not been conducted.
Empirical sizes for monitoring horizons k

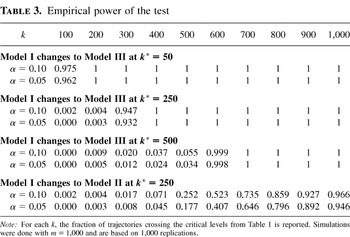
The power of the procedure for three change-point scenarios is reported in Table 3. As can be expected, large changes in parameters are detected more reliably.
Empirical power of the test

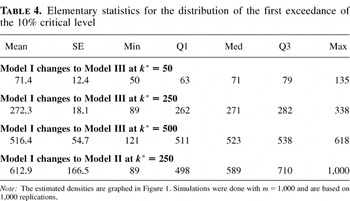
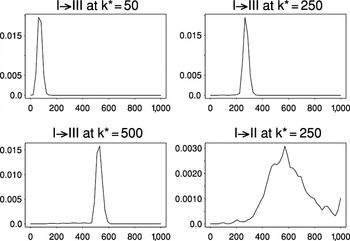
From a practical point of view, it is more useful to study the distribution of the detection delay time or, equivalently, the distribution of the random time when the decision function C(k) first exceeds a critical level. In Table 4, we report selected descriptive statistics for such distributions. The estimated densities are depicted in Figure 1.
Elementary statistics for the distribution of the first exceedance of the 10% critical level


Estimated densities of the first exceedance of the 10% critical level. Estimates were obtained using the cosine kernel with support of length 70. Simulations were done with m = 1,000 and are based on 1,000 replications.
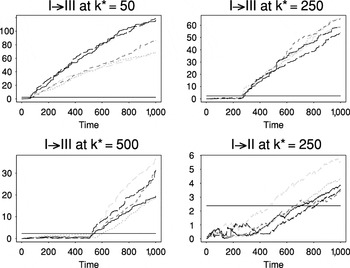
Focusing first on the first three change-point models reported in Table 4, we note that the distribution of the delay time is fairly symmetric but its spread increases as the change point moves further away from the point where the monitoring was initiated. Similar findings were reported in Chu et al. (1996). However, unlike for the fluctuation monitoring scheme investigated in Chu et al., the average delay time does not appear to increase with the distance of the change point from the initiation point, and it is about 20 for a change from Model I to Model III. For relatively less significant changes in parameters, such as the change from Model I to Model II, the delay time is much longer. Even in such situations, however, a visual real-time inspection of the graph of C(k) may suggest that something is happening to the parameters of the model. In the panel in the right-bottom corner of Figure 2, five randomly selected trajectories of C(k) for the change from Model I to Model II are shown. A picture of this type may be fairly typical in real-data applications as the parameters need not switch immediately into a new regime but may evolve gradually through a number of smaller changes. In contrast, as shown in Figure 3, if there is no change, the trajectory of C(k) may occasionally exceed the critical value, but it will not show a pronounced upward trend such as that manifest in Figure 2.

Five randomly selected realizations of the sequence C(k) for the data summarized in Table 4. The vertical lines correspond to 10% critical values. The corresponding estimated densities of the first hitting time are depicted in Figure 1.

Five randomly selected realizations of the sequence C(k) for Model I and m = 1,000. The two horizontal lines correspond to 5 and 10% critical values from Table 1. The fractions of trajectories crossing these lines before time k are reported in Table 2.
5. PROOF OF PROPOSITION 3.1
Let

In the proof of their Lemma 5.8, Berkes et al. (2003) show that there is a constant 0 < ϱ < 1 and a positive random variable ξ such that

Berkes et al. (2003) also show that

is a stationary sequence and

Hence

by Lemma 2.2 of Berkes et al. (2003).
Next we show that

By (6.49) we have that

Using the independence of ε0 and (w0(u),σ02), u ∈ U we get that

Lemma 5.1 of Berkes et al. (2003) yields that

and Lemma 3.6 of Berkes and Horváth (2004) gives

Hence the proof of (5.36) is complete. For each

is a stationary and ergodic sequence. So by (5.36) we can use the ergodic theorem, resulting in

Next we show that there are a constant C1 and U* ⊆ U, a neighborhood of θ, such that

Using (6.49) we can write

where

Using the mean value theorem coordinate-wise we get that

By the Hölder inequality we have

By (5.37), the first expected value is finite in (5.41). Using the Cauchy inequality we get that

The first expected value on the right-hand side of (5.42) is finite according to Lemma 3.6 of Berkes and Horváth (2004). The second expected value on the right-hand side of (5.42) is finite by Lemma 3.7 of Berkes and Horváth (2004) assuming that U* is a small enough neighborhood of θ. Hence

Similar arguments show that

implying that

assuming that U* is a small enough neighborhood of θ. By symmetry, we have that

Hence the proof of (5.39) is complete.
We note that

Because

is a stationary and ergodic sequence with finite mean by (5.39), the ergodic theorem implies that

with some constant c*. Hence by (5.38) we have that

Berkes et al. (2003) show that

and therefore the first part of Proposition 3.1 follows from (5.47).
The nonsingularity of D = D(θ) is proved by Berkes et al. (2003), and the positive definiteness of D is obvious.
6. PROOF OF THEOREM 3.1
The proof of Theorem 3.1 is based on several lemmas, which we present after introducing some additional notation.
Let

We note that

and we define

LEMMA 6.1. If the conditions of Theorem 3.1 are satisfied, then

as m → ∞.
Proof. By Lemmas 5.8 and 5.9 of Berkes et al. (2003) we have that

implying Lemma 6.1. █
Let

LEMMA 6.2. If the conditions of Theorem 3.1 are satisfied, then there is U*, a neighborhood of θ, such that

Proof. This is Lemma 5.6 in Berkes et al. (2003). █
LEMMA 6.3. If the conditions of Theorem 3.1 are satisfied, then

as m → ∞.
Proof. First we show that there is a neighborhood of θ, say, U*, such that

as m → ∞. Because

is a stationary sequence, by (3.24) it is enough to prove that

However, (6.51) is an immediate consequence of Lemma 6.2. Theorem 4.4 of Berkes et al. (2003) implies that

Using the mean value theorem coordinate-wise for

and then (6.50), (6.52) for the coordinates of

we get Lemma 6.3. █
LEMMA 6.4. If (2.8), (2.9), and (2.13)–(2.19) are satisfied, then

as m → ∞.
Proof. Lemma 6.4 follows from Theorem 4.4 of Berkes et al. (2003). █
LEMMA 6.5. If the conditions of Theorem 3.1 are satisfied, then

as m → ∞.
Proof. We note that

by conditions (3.23), (3.24), and the asymptotic normality of

(cf. Berkes et al., 2003). Hence putting together Lemmas 6.3 and 6.4 we get the result in Lemma 6.5. █
LEMMA 6.6. If the conditions of Theorem 3.1 are satisfied, then

as m → ∞, where WD(s) is a Gaussian process with EWD(s) = 0 and EWDT(s)WD(s′) = min(s,s′)D.
Proof. As is shown in Berkes et al. (2003),

is a stationary ergodic martingale difference sequence; clearly

. Hence the Cramér–Wold device (cf. Billingsley, 1968, p. 206) yields that for any T > 0

Hence

for any T > 0 as m → ∞. By the Hájek–Rényi–Chow inequality (cf. Chow, 1960) we have

for any x > 0. The coordinates of WD(t) are Brownian motions, so by the law of the iterated logarithm and (3.24) we have

Lemma 6.6 now follows from (6.53)–(6.56). █
Proof of Theorem 3.1. Putting together Lemmas 6.1–6.6 we get that

Elementary arguments show that

where Ip+q+1 is the identity matrix in

. Computing the covariances one can verify that

where W1,W2,…,Wp+q+1 are independent Wiener processes. Hence

completing the proof of Theorem 3.1. █
7. PROOF OF THEOREM 3.2
By Proposition 3.1 it is enough to show that

as m → ∞. Theorem 3.1 yields that

as m → ∞. Let

and d = (ω*,0,…,0)T. Using (2.9) and (2.10) we get that

and induction yields

Condition (3.25) and the independence of the matrices Aj* yield that there is a constant 0 < ϱamp;* < 1 such that

Thus

and

Hence following the proof of Lemma 6.1, one can easily derive from (7.58) and (7.59) that

Using the mean value coordinate-wise and the ergodic theorem we get that

Choosing any sequence

satisfying

we get from (7.60)

because |g′(θ)D−1/2| ≠ 0 by (3.29).
References
REFERENCES
Andreou, E. &
E. Ghysels
(2002)
Detecting multiple breaks in financial market volatility dynamics.
Journal of Applied Econometrics
17,
579–600.Google Scholar
Berkes, I. &
L. Horváth
(2004)
The efficiency of the estimators of the parameters in GARCH
processes.
Annals of Statistics
32,
633–655.Google Scholar
Berkes, I. &
L. Horváth
(2003)
Limit results for the empirical process of squared residuals in
GARCH models.
Stochastic Processes and Their Applications
105,
279–298.Google Scholar
Berkes, I.,
L. Horváth, &
P. Kokoszka
(2003)
GARCH processes: Structure and estimation.
Bernoulli
9,
201–227.Google Scholar
Besseville, M. &
I.V. Nikifirov
(1993)
Detection of Abrupt Changes: Theory and Applications.
Prentice Hall.
Billingsley, P.
(1968)
Convergence of Probability Measures.
Wiley.
Boldin, M.V.
(1998)
On residual empirical distribution functions in ARCH models with
applications to testing and estimation.
Mitteilungen aus dem Mathematischen Seminar Giessen
235,
49–66.Google Scholar
Bougerol, P. &
N. Picard
(1992a)
Strict stationary of generalized autoregressive processes.
Annals of Probability
20,
1714–1730.Google Scholar
Bougerol, P. &
N. Picard
(1992b)
Stationarity of GARCH processes and of some nonnegative time series.
Journal of Econometrics
52,
115–127.Google Scholar
Brodsky, B.E. &
B.S. Darkhovsky
(1993)
Nonparametric Methods in Change-Point Problems.
Kluwer.
Brodsky, B.E. &
B.S. Darkhovsky
(2000)
Non-Parametric Statistical Diagnosis.
Kluwer.
Chow, Y.S.
(1960)
A martingale inequality and the law of large numbers.
Proceedings of the American Mathematics Society
11,
107–111.Google Scholar
Chu, C.-S.J.
(1995)
Detecting parameter shift in GARCH models.
Econometric Reviews
14,
241–266.Google Scholar
Chu, C.-S.J.,
M. Stinchcombe, &
H. White
(1996)
Monitoring structural change.
Econometrica
64,
1045–1065.Google Scholar
Csörgő, M. &
L. Horváth
(1997)
Limit Theorems in Change-Point Analysis.
Wiley.
Csörgő, M. &
P. Révész
(1981)
Strong Approximations in Probability and Statistics.
Academic Press.
Gombay, E.
(1996)
The weighted sequential likelihood ratio.
Canadian Journal of Statistics
24,
229–239.Google Scholar
Gombay, E.
(2003)
Sequential change-point detection and estimation.
Sequential Analysis
22,
203–222.Google Scholar
Gouriéroux, C.
(1997)
ARCH Models and Financial Applications.
Springer-Verlag.
Horváth, L.,
P. Kokoszka, &
G. Teyssière
(2001)
Empirical process of the squared residuals of an ARCH sequence.
Annals of Statistics
29,
445–469.Google Scholar
Inclan, C. &
G. Tiao
(1994)
Use of cumulative sums of squares for retrospective detection of
change in variance.
Journal of the American Statistical Association
89,
913–929.Google Scholar
Inoue, A.
(2001)
Testing for distributional change in time series.
Econometric Theory
17,
156–187.Google Scholar
Kim, S.,
S. Cho, &
S. Lee
(2000)
On the cusum test for parameter changes in GARCH(1,1) model.
Communications in Statistics—Theory and Methodology
29,
445–462.Google Scholar
Kokoszka, P. &
R. Leipus
(1999)
Testing for parameter changes in ARCH models.
Lithuanian Mathematical Journal
39,
231–247.Google Scholar
Kokoszka, P. &
R. Leipus
(2000)
Change-point estimation in ARCH models.
Bernoulli
6,
513–539.Google Scholar
Kokoszka, P. &
G. Teyssière
(2002)
Change Point Detection in GARCH Models: Asymptotic and Bootstrap
Tests.
Preprint available at
http://stat.usu.edu/∼piotr/research.html.
Utah State University.
Koul, H.
(2002)
Weighted Empirical Processes in Dynamic Nonlinear Models.
Springer.
Kulperger, R. &
H. Yu
(2003)
High Moment Partial Sum Processes of Residuals in GARCH Models.
Preprint,
University of Western Ontario.
Lamoureux, C. &
W.D. Lastrapes
(1990)
Persistence in variance, structural change, and the GARCH model.
Journal of Business and Economic Statistics
8,
225–234.Google Scholar
Lee, S.-W. &
B.E. Hansen
(1994)
Asymptotic theory for the GARCH(1,1) quasi-maximum likelihood
estimator.
Econometric Theory
10,
29–52.Google Scholar
Lumsdaine, R.L.
(1996)
Consistency and asymptotic normality of the quasi-maximum
likelihood estimator in IGARCH(1,1) and covariance stationary
GARCH(1,1) models.
Econometrica
6,
575–596.Google Scholar
Lundbergh, S. &
T. Teräsvirta
(2002)
Evaluating GARCH models.
Journal of Econometrics
110,
417–435.Google Scholar
Mikosch, T. &
C. Stărică
(2002)
Long-range dependence effects and ARCH modeling. In
P. Doukhan,
G. Oppenheim, &
M.S. Taqqu (eds.),
Theory and Applications of Long-Range Dependence, pp.
439–459.
Birkhäuser.
Nyblom, Y.
(1989)
Testing for the constancy of parameters over time.
Journal of the American Statistical Association
6,
223–230.Google Scholar
Sowell, F.
(1996)
Optimal tests for parameter instability in the generalized method
of moments framework.
Econometrica
64,
1085–1107.Google Scholar
Critical values calculated according to relation (4.1)
Empirical sizes for monitoring horizons k
Empirical power of the test
Elementary statistics for the distribution of the first exceedance of the 10% critical level
Estimated densities of the first exceedance of the 10% critical level. Estimates were obtained using the cosine kernel with support of length 70. Simulations were done with m = 1,000 and are based on 1,000 replications.
Five randomly selected realizations of the sequence C(k) for the data summarized in Table 4. The vertical lines correspond to 10% critical values. The corresponding estimated densities of the first hitting time are depicted in Figure 1.
Five randomly selected realizations of the sequence C(k) for Model I and m = 1,000. The two horizontal lines correspond to 5 and 10% critical values from Table 1. The fractions of trajectories crossing these lines before time k are reported in Table 2.
 You have
Access
- 115
- Cited by