What kind of market structure promotes rapid technological progress? This question can be traced back to at least the writings of Joseph Schumpeter. In the Theory of Economic Development (published in 1911) Schumpeter viewed small entrepreneurial ventures as seedbeds of technological discovery, yet three decades later in Capitalism, Socialism and Democracy (published in 1942) he advanced the now familiar hypothesis that large firms with market power accelerate the rate of innovation. Because market power is endogenous to Schumpeterian growth—new firms enter and may come to dominate an industry through creative destruction—his 1911 and 1942 arguments are not entirely separable. For the most part, however, the literature has focused on Schumpeter's 1942 position to understand whether, “a market structure involving large firms with a considerable degree of market power is the price that society must pay for rapid technological progress.”1
Nelson and Winter, Evolutionary Theory, p. 278.
How to create a balance between what society gains from Schumpeterian innovation and what it loses through high pricing and restrictions of output is a recurrent issue in the economics of antitrust enforcement.
2 Gilbert and Katz, “Economist's Guide.”
Despite the huge literature spawned by Schumpeter's ideas, empirical support for them has been lacking. According to Wesley Cohen and Richard Levin, “the empirical results concerning how firm size and market structure relate to innovation are perhaps most accurately described as fragile,” and F. M. Scherer concludes that, “the weight of the existing statistical evidence goes against Schumpeter's 1942 argument that large corporations are particularly powerful engines of technological progress.”3
Cohen and Levin, “Empirical Studies,” p. 1069. Scherer, “Schumpeter,” p. 1423.
Since the publication of Adolf Berle and Gardiner Means's
The Modern Corporation and Private Property in 1932, scholars have been especially concerned that agency problems may reduce the effectiveness of R&D in large firms, and that incumbents may be resistant to change or unable to respond to radical innovation because of organizational inertia.
4 Berle and Means, Modern Corporation. Henderson, “Underinvestment.”
Several authors have shown that insulation from competitive pressures discourages innovation and growth, while refutations of Gibrat's Law imply that smaller—not larger—firms tend to innovate more than proportionately to their size.
5 See for example, Blundell, Griffith, and Van Reenen, “Market Share”; Nickell, “Competition”; and Porter, Competitive Advantage. On Gibrat's Law, see Sutton, “Gibrat's Legacy.”
Although the Schumpeter hypothesis has come in for some hard empirical knocks, at least one strand of the literature suggests that it should not be rejected altogether. Theory shows that market power can stimulate technological progress because firms innovate on the expectation of receiving monopoly rents.6
Aghion and Howitt, “Model”; and Caballero and Jaffe, “Standing on the Shoulders.”
Thus, Philipe Aghion and his coauthors build on F. M. Scherer's inverted-U relationship where competition has a positive effect on innovation up to an inflexion point after which its effect decreases.
7 Aghion et al., “Competition”; and Scherer, “Firm Size.”
Where rivals are close—in “neck-and-neck” industries—competition always increases innovation, but in “unleveled industries” characterized by technology gaps competition may reduce incentives to innovate if laggards expect a reduction in their post-entry rents. The authors, using innovation data on a panel of U.K. firms, confirm the coexistence of competition and Schumpeterian innovation effects.
This article aims to make a further contribution to the literature on Schumpeterian innovation dynamics. Early twentieth century American industrial structure provides a particularly clean illustration of the conditions under which firms with strong market positions become powerful engines of technological progress. Although this epoch profoundly influenced Schumpeter's writings on capitalism and creative destruction, the economic and political characteristics of the time make an historical examination of industry structure and innovation even more compelling. The creation of firms can be illustrated by the high rate of business formation during the great merger wave in American business (1897–1904); the disruption of these firms can also be observed as markets developed and new technologies came on stream. Paul David and Gavin Wright illustrate how electricity pushed out the technology frontier and how demand and supply side impulses, from an upgrading of labor market skills to buoyant stock market rewards, favored the rapid diffusion of new innovation.8
David and Wright, “Early Twentieth Century Productivity Growth.”
Theorists have suggested that major technological improvements and productivity growth manifest where institutions and government policy set a favorable climate for change.
9 See for example, Acemoglu, Aghion, and Zilibotti, “Distance.”
To the extent that the government held a benign view of big business during the 1920s, institutions were strong and the market was unfettered, this is an ideal setting for analyzing the forces that may be conducive to innovation-based growth.
HISTORICAL SETTING
Joseph Schumpeter's analysis of capitalism and creative destruction is deeply rooted in early-twentieth-century American history. His oft-cited observation that new technologies bring about competition “which strikes not only at the margins of the profits and outputs of existing firms, but at their foundation and very lives” is especially apposite during this period.10
Schumpeter, Capitalism, p. 84.
According to Schumpeter unfettered big business delivered new technologies that accelerated economic growth and improved the standard of living. Waves of creative destruction characterized the “Industrial Revolution” of the 1920s—the decade of electrification, movies, the first transatlantic flight, and the Model T.
If anything persuaded Schumpeter of the virtues of large firms, constrained only by market forces, it was probably the great turn-of-the-century merger wave. Between 1897 and 1904 approximately 200 industrial consolidations were formed, which changed the entire landscape of American business. Although price fixing and market sharing agreements were commonplace, the mega mergers of this era were most likely a response to the demand for efficiency rather than the desire to exploit monopoly positions.11
Banerjee and Eckard, “Mega Mergers.”
While successful conglomerates built up research infrastructures leading to radical technological breakthroughs, less efficient combinations rapidly ceded their positions of market dominance to newer rivals.
12 Lamoreaux, Great Merger Movement.
Schumpeter was confident that dynamic competition would provide a rationale for governments to leave markets alone. The costs of large firms with market power were likely to be outweighed by their propensity to keep the capitalist engine in motion. When General Electric and Westinghouse agreed to pool their patents in 1896, the industry became a duopoly, which probably delayed reductions in the price of electrical apparatus up to 1900. According to Leonard C. Reich, research-generated patents in electricity were often designed to protect monopoly positions “both offensively and defensively either to gain concessions from competitors, or to short-circuit new inventions that might have had disruptive possibilities.”13
Reich, “Research,” p. 34.
On the other hand, through extensive investments in R&D,
General Electric and
Westinghouse also pushed out the frontier of productivity-enhancing electrification technology. The rapid fall in the price of electrical apparatus after the First World War aided factory electrification of the mass production economy. By 1920, 53 percent of mechanical power was provided by electricity, rising to 78 percent by 1930.
14 A massive productivity shock accompanied the diffusion of electrification as a general-purpose technology.
In other instances, however, it is more difficult to discern welfare benefits from an industry structure where firms are able to exert considerable market power. The Supreme Court's 1908 decision in Continental Paper Bag Company v. Eastern Paper Bag Company ratified patents even if they were not currently in use.15
Mowery, “Industrial Research.”
Subsequently, firms were keen to obtain property rights in order to maintain market position whether or not the patent embodied any utility value. The American conglomerates Du Pont, Standard Oil, Allied Chemicals, the English firm I.C.I. and I.G. Farben of Germany captured a commanding share of the fertilizer market through the construction of a patent thicket involving 1,800 patents relating to the synthetic nitrogen process. United Shoe Machinery protected its patents using contracts to prohibit users from making copies, thereby enhancing network effects and lock-in.
16 Engelbourg, “Some Consequences.”
Probably one of the most profitable of all patents during this period was awarded to United States Gypsum for folding cardboard over the edge of dry plaster to prevent chipping. Through patent license agreements the company managed to maintain a price differential of more than 100 percent between “gypsum lath” and “gypsum board,” despite the marginal technical difference between the two that the former required a finishing coat of plaster and the latter, with a smooth surface, could be used as a finished wall.
17 Comer, “Outlook,” p. 161.
Schumpeter was aware that instances of market power abuse “do occur and it is right and proper to work them out,” but he also suggested they were likely to be “fringe-end cases to be found mainly in the sectors furthest removed from all that it most characteristic of capitalist activity.”
18 Schumpeter, Capitalism, p. 85.
Although the regulatory agencies responsible for antitrust enforcement maintained a more hostile attitude towards the concentration of market power than Schumpeter envisaged, scholars who have researched the political economy of this period are virtually unanimous in their opinion that early antitrust policy was unable to curb output restrictions and excess profits.
19 Kovacic and Shapiro, “Antitrust Policy.”
The landmark Sherman antitrust cases against Standard Oil and American Tobacco epitomized Progressive Era ideology that monopoly was unethical, deceptive, and damaging to the public interest. Yet, businessmen easily navigated the legal thicket to claim that monopoly was not a breach of American law. Although the 1914 Clayton and Federal Trade Commission Acts attempted to improve the legal basis of antitrust policy under the 1890 Sherman Act, the successful cooperation of large firms in wartime mobilization implied that monopoly could be regulated without strict antitrust enforcement. Under Herbert Hoover's ‘associative state’ government policy became much more permissive of concentration in industry, leading to Franklin D. Roosevelt's 1930 lament that “50 or 60 large corporations, each controlled by two, three, or four men, do 80 percent of the industrial business of the country.”
20 Laidler, Concentration, p. 3.
THE DATA
How did such a concentrated industrial structure influence the propensity of firms to innovate? To answer this question the remainder of the article describes and analyzes financial, patent count, and market share data for a group of publicly traded companies active in early- twentieth-century America. Publicly traded companies do not represent the universe of corporations, but they are the only sub-set of firms for which systematic financial data are available. Two preconditions determined the nature of data collection. First, information relating to both product and financial markets was required. Although technological change manifests itself in product markets, financial markets also have a bearing on incentives (or disincentives) for innovation. Thus, according to William N. Parker, Schumpeterian growth is characterized by “technological change and innovations financed by the extension of credit.”21
Cited in Mokyr, Lever, p. 6
Second, because technological change is more of an evolutionary than a transitory process, tracking innovation over time permits a fuller understanding of the forces at work than observing a snapshot of a moment in time. Although the main focus of the article is on the 1920s, benchmark data going back to 1908 are also included. Data collection proceeded in three stages: company financials, innovation, and information relating to the extent of a firm's market share.
Company Financials
The main source for financial data is Moody's Manual of Industrials, which together with Poor's Manual of Industrials comprise the standard references for historical company balance sheets. Although the data in these sources are detailed enough to replicate key variables of interest that re-searchers routinely extract from COMPUSTAT, the lack of frequent income statements precludes the incorporation of sales or cash-flow figures. Prior to the foundation of the Securities and Exchange Commission in 1934 company balance sheets were often less transparent, and subject to measurement error. However, although firms were not obliged to disclose their true financial positions, many actively did so because of the market's propensity to self-regulate. Media scrutiny, in particular, acted as an antidote to informational asymmetries between firm owners and prospective investors.22
Banerjee and Eckard, “Why Regulate Insider Trading.”
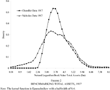
The sample includes every firm with at least four years of continuous data in Moody's and Poor's, which gives a reasonable span over the time-series dimension without subjecting the data to survival bias. Because the First World War marks a structural break in the data, the sample of firms is organized into two panels. Data on 89 firms are included in the first panel, covering the years 1908–1918, and the second panel, spanning the period 1919–1928, includes 119 firms. Seventy-nine firms present in the second panel are also included in the first, and two firms present in the first panel drop out of the second, giving a total of 121 firms. Figure 1 illustrates the distribution of firms according to their year of incorporation. It can be seen that both panels are dominated by firms incorporated during the great merger wave, though the right-hand tail is fatter for the second panel due to the entry of firms such as B.F. Goodrich, and Gillette Safety Razor, incorporated in 1912 and 1917 respectively. Table 1 illustrates that the bulk of the firms sampled were incorporated in the states of New York and New Jersey, which is consistent with the known concentration of industrial activity in the East Coast manufacturing belt.23
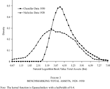
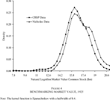
Figures 2, 3, and 4 provide additional insights into the structure of the sample. Seventy of the firms included in the 1908–1918 panel are also included in Alfred Chandler's listing of the 200 largest industrial enterprises in the United States in 1917 ranked by assets size. Fifty-three of the firms in the 1919–1928 panel are listed in Chandler's cohort for 1930.24
Chandler, Scale. The matching firms are also distributed widely across the major product line groups classified by Chandler, hence the sample covers the whole range of industries characteristic of the corporate sector at this time.
and
3 plot the distribution of asset sizes for the Chandlerian firms and my data set of firms for comparable years. To the extent that Chandler focused only on the largest enterprises in the economy it is no surprise that my data reflects a broader coverage of the corporate sector. This aspect of the data is illustrated further in
Figure 4 which shows closely comparable distributions for the market value of common stock for my sample of firms and the population of CRSP industrial firms listed on the New York Stock Exchange (NYSE) in 1925.
25 I downloaded the full database of CRSP (Center for Research in Securities Prices), which has an inception year of 1925 and excluded all nonindustrial stocks. This gave 641 companies. I then excluded companies that did not have share price information for 1925. This gave 391 companies. I then calculated the market value of the common stock for the 391 companies by multiplying shares outstanding by the price at the end of December 1925.
Even though
Moody's and
Poor's did not possess information on all publicly traded firms, and the sample does not include all the firms for which
Moody's and
Poor's did provide financial data (because balance sheets were not always published concurrently)
Figures 2,
3, and
4 suggest that my data provide a good coverage of publicly traded corporations in early-twentieth-century America.
26 As a way of augmenting the number of firms included, and covering as broad a range of firms as possible, I did not confine myself to the NYSE. This means that I also have information on firms such as Quaker Oats (initially listed on the Chicago exchange) and United Shoe Machinery (initially listed on the Boston exchange).
In order to compute COMPUSTAT-comparable variables for the firms sampled, I used the algorithm proposed by E. Lindenberg and Steven Ross.27
Lindenberg and Ross, “Tobin's Q Ratio.” There are a number of alternative methodologies, most notably the NBER procedure documented in Hall et al., “Research.” Lewellen and Badrinath, “On the Measurement,” argue that both the Lindenberg and Ross and NBER methods are flawed and propose an alternative approach. However, their recommended adjustment presupposes accurate information on accumulated book depreciation, which is not available for my sample.
Market value is measured as the product of common equity and year-end market price (from the
Commercial and Financial Chronicle) plus the book value of outstanding debt and the value of preferred stock (which is assumed to be a perpetuity discounted at the average industrial bond yield reported by
Moody's). Capital assets are estimated using a replacement schedule, which adjusts for the price level through the GNP implicit deflator and for depreciation at an assumed 5 percent.
28 The replacement schedule is
where I is the inflation rate and Δ is the depreciation rate, assumed to be 5 percent. Superscripts denote replacement value (rc) and book value (bv). The initial observation t=0 is set to the book value of the firm's net fixed assets.
Inventory is estimated at replacement cost by adjusting for inflation through the wholesale price index. Average
q is then calculated as the ratio of the firm's market value to the replacement cost of its tangible assets.
Patents
The innovative output of firms is proxied using counts of patents granted, which are detailed in the Official Gazette of the United States Patent and Trademark Office (USPTO). Uncovering the relevant pre-1920 data is labor intensive because the USPTO has not automated patent files for this period.29
1976 is the earliest year for which full-text searches of the USPTO database (and hence citations) are available.
Information relating to patents granted after 1920 can be more efficiently gathered due to automation of USPTO data by the European Patent Office (EPO). Entering a company name and year into a web-based search program yields a list of patent numbers and titles that can be readily manipulated into a spreadsheet. A combination of both search methods revealed that 13,621 patents were assigned to firms in the first panel and 18,598 patents were assigned to firms in the second panel. Between 1908 and 1918 one-quarter of firms were assigned an average of approximately eight patents per year, with the highest frequency patenting firm being General Electric (an annual average of 381 patent assignments). Between 1919 and 1928, one quarter of firms were assigned an average of approximately ten patents per year. The highest frequency patenting firm was Westinghouse (General Electric's chief rival) with an annual average of 404 assignments. In both panels, 21 firms did not patent at all.
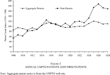
Figure 5 plots patents taken out by the firms in the sample against aggregate
USPTO patents for equivalent years. Not surprisingly, due to their size and technological capabilities, the growth rate of patenting by the firms sampled is much greater than that for patents granted generally.
It is well known in the industrial organization literature that patents provide an imperfect measure of innovative output. It is commonly argued first, that not all significant technologies are patented (witness the program written by Tim Berners-Lee—Enquire Within—which paved the way for the World Wide Web), and second, that most patents are trivial and have zero economic value. Although the first of these problems is difficult to resolve, particularly in industries where firms do not use patents as a primary mechanism to appropriate from R&D effort (as used to be the case in the semiconductor industry, for example), the second problem can be mitigated using quality adjustments to patent measures. Of the numerous methods proposed in the literature two can be applied here: citation; and patent scope weights.
PATENT CITATIONS
Patent counts can be quality adjusted using forward citations because “the number of times a patent document is cited may be a measure of its technological significance.”30
Trajtenberg, “Penny for your Quotes,” p. 27.
Where existing knowledge is embodied in a new patent, reference to this “prior art” may be assumed proportional to the influence of the cited patent on a particular technology space. This method of patent weighting has become increasingly feasible for researchers following automated full text searches of USPTO patents granted since 1976, and the efforts of Bronwyn Hall, Adam Jaffe and Manuel Trajtenberg, who collated these data and matching COMPUSTAT statistics into the NBER patent database file.
31 See Jaffe and Trajtenberg, Patents.
This data set utilizes a novel set of citations. I obtained citation data for patents assigned to the firms in my sample by plugging into the USPTO database a patent number from the Official Gazette or EPO search. This revealed the number of times a patent assigned to one of the sampled firms was cited in the universe of patent grants between 1976 and 2002. Given time and resource constraints, citations were collected only for the second panel of firms, and for the years 1920–1928.
Although citations are routinely used to attenuate the noise of raw patent counts, one concern stands out with respect to my data: with a minimum time lag of almost half a century between the date of a patent grant and the date of earliest citation, and a maximum time lag of 82 years between these two points, do these citations represent important knowledge flows, or are they merely statistical artifacts?32
There are, of course, benefits from truncation as well, namely that citation intensity will not be correlated with patents of different grant years, a problem that requires simulation of citation lag structures for samples that utilize patents in the NBER data file.
It is difficult to answer this question definitively using insights from the current literature because most studies utilize patents where the citation span is approximately a decade or two. Using a comprehensive collection of patents granted between 1975 and 1992, Ricardo Caballero and Adam Jaffe show that the bulk of citations happen within ten years of a patent grant, after which the probability of citation falls off sharply.
33 Caballero and Jaffe, “Standing on the Shoulders.”
Those studies that consider citation lag explicitly warn that if patentees routinely reference prior art, or only “cite the classics,” the signal-to-noise ratio of long-lagged patent citations may, in fact, be weak.
34 See for example, Lanjouw and Schankerman, “Quality.”
On the other hand, these studies also suggest that later citations may provide a different, but nonetheless important type of information if they reflect news about the significance of a technology as it passes through the life cycle. It is not generally known at time of patent grant whether a technology will be a success or a failure. If information is asymmetric, later citations “may be a better measure of what the patentee and others know at time zero than a measure restricted to citation close to the date of patent application.”35
This may be one reason why lagged citations are strongly correlated with firm market values.
36 Hall, Jaffe, and Trajtenberg, “NBER Patent Citation Data File.”
To the extent that citations turn out to be positively correlated with firm market value in my data set, I assume that the citations observed do reflect important knowledge flows.
Of the 17,559 patents granted to firms between 1920 and 1928, 21 percent are cited in patents granted between 1976 and 2002. In order to benchmark this figure I use three pieces of information. First, a lower bound on the expected number of citations would be close to zero because, as a rule of thumb, one-half of patents granted are never cited. Second, even if a patent is cited, most citations happen within a decade, which implies a low probability for a 1976–2002 patent citing a patent granted between 1920 and 1928. Third, I calculate an upper bound on the expected number of citations using references to patents granted to the great inventor-entrepreneur Thomas Edison between 1910 and 1930.37
Edison's patents are listed at http://edison.rutgers.edu/patents.htm. I obtained citations by plugging the patent numbers into the USPTO database. The minimum number of citations for one of Edison's patents is zero, the maximum number of citations is 11 (patent number 1,417,464) and the average number of citations over all 132 patents is 0.67.
Edison was issued 132 successful grants by the USPTO between these years, 42 (31.8 percent) of which are cited in patents granted between 1976 and 2002. Taken together, the benchmarking exercise suggests that the fraction of citations observed in my data set is both large and significant.
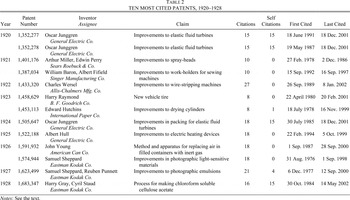
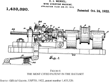
Of the 3,648 patents cited in my sample, 60 percent (2,208) receive one citation and 20 percent (736) two citations, with the top ten cited patents being summarized in Table 2. The most cited patent (cited as recently as 8 January 2002) is 1,433,320, a wire-stripping machine by Charles Wersel that was assigned to Allis-Chalmers Mfg Co., the industrial and agricultural machinery giant famous for building tractors. An image of this machine is shown in Figure 6. General Electric and Eastman Kodak score highly in the citation pool, which may reflect both their technological capabilities and a self-citation bias. Two of the patents in Table 2—granted to John Young of American Can, and Harry Gray and Cyril Staud of Eastman Kodak—may be considered as process innovation, whereas the remainder relate to the invention of products. In accordance with standard procedures, I weight each patent by the number of citations that it receives, therefore summing the total number of citations for each firm, each year.38
Procedure used in Hall, Jafee, and Trajtenberg, “NBER Patent Citation Data File,” p. 33.
PATENT SCOPE
I use the USPTO Patent Classification scheme to construct a proxy for patent scope. Whenever the Patent Classification scheme is updated, the universe of patents is also re-classified, such that the examination process currently assigns a patent to one or more of 462 classes and over 136,000 subclasses. Although Josh Lerner recommends using the International Patent Classification scheme because “it reflects the economic importance of new inventions as opposed to the technical focus of the U.S. scheme,” these data only become available in 1969.39
Lerner, “Importance,” p. 321.
To obviate the additional complication noted by Lerner that the USPTO subclasses are not systematically stratified, I use the number of times a patent was allocated to each of the 462 main classes to measure patent scope. I determined the number of classes each patent was assigned to by adding an extra line of code to the search for citations in the
USPTO database. This revealed that the majority of patents in the sample (62 percent) were assigned to one class at the patent-examination stage and 24 percent of patents were assigned to two classes. The eight broadest patents are detailed in
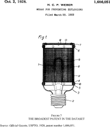
Table 3. The broadest patent of all, an invention by Henry Weber of
Westinghouse relating to the prevention of gas explosions in confined spaces, covers ten classes (see
Figure 7).
40 I document the top eight rather than the top ten because 25 patents had seven citations.
Although broad patents may be detrimental to social welfare if they allow firms to monopoly price, the breadth of a patent may confer significant private benefits to the firm by augmenting market value, especially in differentiated product markets where consumers find it easy to switch to a substitute product.41
On monopoly pricing, see Gilbert and Shapiro, “Optimal Patent Length.” Klemperer, “How Broad Should the Scope.”
Broad patents may therefore reflect one (or both) of two effects: the generality of an innovation, or strategic behavior by firms to allay the threat of preemption. Given the time structure of this data set, I assume that citation intensity would be correlated with general patents but not strategic patents, the latter effect being nullified by the citation lag.
Figure 8 plots the number of cited patents against the number of patent classes for each firm, which provides strong evidence that patent scope reflects an additional dimension of patent quality. A negative binomial regression of cited patents on scope frequency reveals that an extra patent class assignment leads to a 0.0028 proportional change or 0.28 percent change in the expected number of citations received with a z-statistic of 11.74. OLS yields a coefficient of 0.23 (
t-statistic 84.34) and an
R2 of 0.88. In accordance with the citation weighting procedure, I weight each patent by the number of classes it was assigned to, therefore summing the total number of classes for each firm, each year.
Market Power
The extent of a firm's market power is a key variable of interest in tests of the Schumpeter hypothesis. It is conventionally measured in a variety of ways, the most common methods being sales data to approximate market share, concentration measures such as the Herfindahl index, or the Lerner index which measures the relative “markup” of price over cost. None of these measures are available for the years covered by my data. Naomi Lamoreaux, however, shows that market power can be measured at the firm level during the early twentieth century using a qualitative indicator of market share. She adopts three market-share categories for firms formed during the great merger movement—more than 70 percent, between 40 and 69 percent, and less than 40 percent—which I use to categorize my firms into high, medium, and low market share groups respectively.42
Lamoreaux, Great Merger Movement.
This process of coding firms according to their level of market power involved searching the literature on concentration in American industry in the early twentieth century. Much of this literature cites records of Department of Justice (DOJ) and Federal Trade Commission (FTC) investigations into firm behavior during the heyday of U.S. antitrust enforcement. Quoting from an FTC report, H. Laidler reveals that in 1921 the Singer Sewing Machine Company accounted for “some 72 percent of the total domestic sewing machine production in the nation.”43
Laidler, Concentration, p. 298.
In other instances scholars have tabulated market share for firms, or provide details of company histories that are useful for cross-checking the market-power coding. Thus, W. Shepherd estimates that Eastman Kodak held 90 percent market share in 1910, while Laidler reports that, “in the manufacture of the camera, the Eastman Kodak Co. is supreme.”
44 Sheperd, Treatment, p. 308. Laidler, Concentration, p. 312. Further sources for the market power data are as follows: Burns, “Competitive Effects”; Conant, “Competition”; Comer, “Outlook”; French, United States Tire Industry; Hise, Concentration; Lamoreaux, Great Merger Movement; Mahoney, “Backsliding Convert”; Means, “Growth”; Nutter, Extent; Roe, “United Shoe Machinery Company”; Sheperd, Treatment; Stigler, “Kinky Oligopoly Demand Curve”; and Whitney, Antitrust Policies.
Unfortunately, there is not enough information in such sources to observe market share each year, so the category variables are time invariant within each panel. Thus, 27 percent of firms are allocated to the high, 33 percent to the medium, and 40 percent to the low market-share categories for the period 1908–1918. For the second panel of firms, the respective percentages are 10, 34.5, and 55.5.
A benefit of the coding process is that the data can be used to estimate the effects of market power on innovation econometrically. That said, the methodology also raises problems. It will not capture tacit cooperation between firms through pooling arrangements to fix prices and divide sales, which may increase collective market share beyond that observed for individual firms. Moreover, large diversified corporations have not one, but a set of market shares, which means that the “product market” is difficult to define homogeneously. Although American Tobacco held monopoly control over several lines of tobacco goods, it never produced more than 15 percent of annual cigar output between 1904 and 1910.45
Lindahl and Carter, Corporate Concentration, p. 186.
Despite the details of industry structure provided by the DOJ and the FTC reports, there is no error-free way of defining “market power,”' let alone determining systematically whether or not companies were market power abusers. In 1913 the DOJ requested a divestiture of American Can Co. for exploiting its alleged monopoly position, yet a district judge ruled that he was “frankly reluctant to destroy so finely adjusted an industrial machine as the record shows [the] defendant to be.”
46 [Insert citation for the opinion quote here.]
In 1920 the Supreme Court famously ruled against the dissolution of United States Steel on the grounds that the company was not formed with the interest of restraining trade even though it controlled approximately 80–90 percent of the country's output of steel.
47 Whitney, Antitrust Policies, pp. 109–205.
Despite these potential sources of measurement error, the market-power data provide a valuable source of information for understanding the importance of market power in innovation markets. It is interesting to note that the proportion of firms allocated to the high-market-share category is much smaller for the second than for the first panel of firms. This observation is consistent with what is known about the decline of dominant firms during the period. Richard E. Caves, M. Fortunato, and Pankaj Ghemawat study 42 dominant firms formed during the merger wave whose mean market share was 69 percent in 1905, but 45 percent in 1929.48
Caves, Fortunato, and Ghemawat, “Decline.”
International Harvester, for instance, lost almost half of its market share between 1910 and 1935, as competition between firms was fomented by favorable demand conditions and rapid changes in farm-tractor technology.
49 With respect to my sample of firms, 23 firms present in the second panel had much higher market shares than in the first panel. I use this information to construct a “loss of market power” variable, which helps to determine the effect of radical changes in market share (i.e., creative destruction) on the propensity of firms to innovate.
ESTIMATION STRATEGY
To get an initial insight into the structure and composition of the data, descriptive statistics on the aforementioned variables are given in Table 4. A number of points stand out. First, size appears to be neither a necessary nor a sufficient condition for market power. Although low-market-share firms are the smallest by assets size, medium-market-share firms are more than double the size of high-market-share firms. Second, q (the ratio of the firm's market value to the replacement cost of its assets) tends to be higher the greater the firm's market share. Relative to the period 1908–1918, q is larger for all firm groups between 1919–1928, but q is almost 50 percent larger for high-market-share firms, compared with 32 percent and 29 percent larger for medium- and low-market-share firms respectively. Third, high-market-share firms generate more patents per unit of fixed capital than any other group of firms, which is also the case when scope and citation weights are introduced. Based on these data alone, firms with high levels of market power appear to have been disproportionately innovative.
Summary statistics, however, conceal a great deal of information about the distribution of observations, so a more complete analysis of the data is required. My empirical strategy is based on the principle embodied in Richard Blundell, Rachel Griffith, and John Van Reenan's work that innovation and market value equations need to be estimated concurrently to fully understand the innovation–market power dynamic.50
Blundell, Griffith, and Van Reenen, “Market Share”
The logic behind this dual approach is that product markets and financial markets behave interactively to determine the equilibrium level of innovation. Suppose, for example, that a firm engages optimally in “search” for new technologies and wishes to equate marginal benefits with marginal costs. Its decision problem will depend on factors such as the extent of competition in product markets and the rewards it receives from innovating in financial markets.
Theory suggests that if appropriability is perfect a monopolist gains more from innovating at the margin than does a firm operating under competitive market conditions. If an efficiency effect dominates, a monopolist may invest in more search because the marginal benefits are higher.51
Gilbert and Newbery, “Preemptive Patenting.”
On the other hand if a replacement effect dominates a monopolist merely replaces an existing stream of rents, so may delay search for new technologies because the marginal benefits are lower.
52 Reinganum, “Uncertain Innovation.”
These effects, in turn, depend on whether the new technology is incremental or drastic—how much the incumbent stands to benefit or lose from engaging in a race to win an innovation.
In a world of Schumpeterian creative destruction both effects may exist concurrently. Although incumbents might preemptively innovate to prevent the dissipation of industry profits, entrepreneurs stimulate new entry by seeking to profit from their technological discoveries. Where incumbents are reluctant to innovate for fear of ‘replacement’ they become vulnerable to drastic innovations that create new markets. Although incumbents may bar entry to new innovations, and thereby absorb creative destruction, such instances are “in the conditions of the perennial gale, incidents, often unavoidable incidents, of a long run process of expansion which they protect rather than impede.”53
Schumpeter, Capitalism, p. 88.
Innovation Equation
For the innovation equation, I assume that innovative output is a function of patent counts measured over scope and citation dimensions. Because the number of patents granted is a non-negative integer, I use count data regressions as described by Jerry Hausman, Bronwyn Hall, and Zvi Griliches.54
Hausman, Hall, and Griliches, “Econometric Models.”
I prefer negative binomial specifications because the Poisson model assumes equality of mean and variance and so may be less reliable in a heterogeneous sample of innovating firms. Negative binomial regressions introduce more flexibility in the specification of the variance function by allowing for “overdispersion.” The conditional expectation, equation 1, is a familiar version of the patent production function, with an exponential mean, μ
it and multiplicative individual effect i
i. The full empirical model is given by equation 2.
The main variables of interest in the patent production function relate to the firm's market power. HPOWER and MPOWER correspond to firms with high and medium market shares respectively. These variables are dichotomous, so low-market-share firms serve as a control group. Assuming Schumpeter was correct about the innovation–market power dynamic, both HPOWER and MPOWER should enter positively. To the extent that market power may be correlated with firm size, I include a separate size proxy—capital assets, k. Because HPOWER and MPOWER turn out to be weakly (if at all) correlated with k, size and market-power effects should be disentangled.55
The correlation between k and HPOWER is–0.016 (p = 0.580) and between k and MPOWER 0.191 (p = 0.000).
More problematic is the endogeneity of market share. In a Schumpeterian economy, firms gain market share by innovating but lose it through creative destruction. One (albeit imperfect) way to tackle this issue is to probe the causal structure of the data. Recall that Caves, Fortunato, and Ghemawat find significant drops in the level of market share for several major firms during this period. Therefore 23 firms with lower market shares for t = 1919–1928 compared with t=1908–1918 are coded one for the dummy variable LOSPOW, which is then plugged in to the patent production functions. This gives point estimates for the conditional mean of the patent distribution for these firms as they operate under different market conditions.
To complete the model I add three additional explanatory variables. First, initial capabilities may have large effects on innovative output, thereby reducing the hazard of exit.56
Mowery, “Industrial Research”; and Thompson, “Surviving in Ships.”
is calculated as time
t minus the year of incorporation.
57 I experimented with a polynomial in EXPER but it was generally insignificant.
Second, for each firm in the sample, the year that bonded debt showed up on the balance sheet is known, which helps to address an often neglected aspect of the Schumpeter hypothesis, namely access to capital for innovation. Schumpeter argued that capital expansion through creative destruction depends on the extension of credit. Bonds offered firms a relatively cheap source of long-term capital during this period.
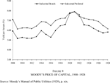
Figure 9 shows a lower price of capital for industrial bonds compared with industrial preferred stock for the period 1908–1928 with the exception of the recession years of 1920/21 when bond defaults (among other factors) raised the risk premium.
BOND is dichotomous coded one for years in which bonded debt appeared on the firm's balance sheet and zero when it did not.
58 Although this variable is endogenous, as investors make judgments about the future profitability of firms, the upside is that BOND acts as an additional control variable because it is also correlated with firm size.
Third, to the extent that optimal capital structure—the mix between debt and equity finance—varied between firms, a dummy variable for new issues of common stock,
STOCK, is included.
59 In a Modigliani-Miller world of perfect capital markets, substituting cheap debt for more expensive equity will not lead to an overall reduction in the cost of capital because additional debt makes the remaining equity more risky. However, there is strong evidence to suggest that capital markets were imperfect during the 1920s (e.g., Cantillo Simon, “Rise”). Therefore, a firm's financial structure may have mattered for innovation.
Although many high-risk investment projects would also have been financed from retained earnings, data on such projects are not available from
Moody's and
Poor's.
Market-Value Equation
To construct a market-value equation, I assume a well functioning financial market where the value of a firm depends on the evolution of its future cash flows, which firms attempt to maximize from their tangible and intangible capital. Because capital has a “useful life” over which value may be expected to diminish, tangible capital is measured at replacement cost, k. Intangible capital is given by the firm's stock, g, of (scope- and citation-weighted) patents (gs, gc), which is constructed using the declining balance formula git = (1–q)git–1 + patit with a depreciation rate q = 0.15. Although it is common in the literature to specify an additively separable value function, market power m and g will enter multiplicatively in a Schumpeterian economy as firms with strong market positions gain more from innovating. Therefore, equations 3 expresses the firm's market value, v, as a function of k, g, and m, where π represents the shadow value of assets. Assuming that discount rates are reflected in equity prices and that equation 3 is linearly homogenous in k, a semi-logarithmic “q-equation” can be derived in the usual way (equation 4). The parameters π0 and π1 measure how far q departs from its long run equilibrium value of unity given a vector of additional covariates
.
My empirical model given by equation 5 departs from equation 4 in two ways. First, I use the logarithm of market value rather than the logarithm of q as a dependent variable because it provides better results when the equity component is the driving force behind changes in q.60
Boyan Jovanovic and Peter Rousseau show that market capitalization dramatically exceeded gross investment for publicly traded firms in the 1920s.
61 Jovanovic and Rousseau, “Vintage Organization Capital.”
Consequently, I shift
k and inventories,
INV, over to the right-hand side of the regression. Second, after experimenting with different functional forms I use a logarithmic specification for
g, which moderates extremes in the data and lessens the effect of outliers. Thus, the coefficient on log[1 + (
g/
k)] has an elasticity interpretation, where log[1 + (
gs/
k)] and log[1 + (
gc/
k)] refer to scope- and citation-weighted patent stocks respectively. I also include a dummy for when
gs,c equals zero to partial out the effect of adding one to the patent stock as a precondition of taking its logarithm. Regarding the interaction terms, the model analyzes whether firms with different levels of market power receive different stock market pay-offs when they innovate. These interactions have a clear bearing on the Schumpeter hypothesis for they illuminate the kind of reward structures that firms face when innovating under different market structure conditions.
RESULTS
Table 5 presents the negative binomial innovation equation results for the two panels of data, 1908–1918 and 1919–1928. The primary estimation method is random effects because it permits time-invariant variables (i.e., HPOWER, MPOWER, and LOSPOW) to be included and places a larger weight on the (possibly more important) cross-sectional dimension of the innovation–market power relationship. There is, however, a loss of efficiency associated with this modeling strategy if the individual effects are correlated with the regressors. Therefore, as a robustness check, fixed-effects estimates are presented wherever the data have a within-panel dimension. A full set of year dummies is included to partial out cyclical effects, such as the post–World War I recession (1920–1923) and the upsurge in economic activity during the second two-thirds of the 1920s. In the random effects models the individual effects are defined by a beta distribution with shape parameters a and b. The likelihood ratio (LR) test is against the null of a negative binomial with constant dispersion. The resulting values easily exceed the critical thresholds of χ2(1). As emphasized by Cohen and Levin, the size as well as the significance of the estimated coefficients is important in these regressions.62
Cohen and Levin, “Empirical Studies.”
For the continuous variables the coefficients can be interpreted as semi-elasticities, and the conditional mean is [exp(β)]–1 times larger for dichotomous variables when the dummy is set to unity.
The key period of interest is 1919–1928, and therefore the parameters of most importance in the innovation equations are presented in columns 3–8. A clear result to emerge from the data is a strong positive effect of firm size, k, on patenting, which is consistent under fixed-effects and random-effects estimation. Interestingly, size is a more important predictor of patent productivity from 1919–1928 compared to the estimates in columns 1 and 2 when k is positive but imprecisely determined. In column 3, although a one-unit ($1m) increase in k increases expected patent counts by just 0.44 percent, when scaled by the standard deviation ($127m) the conditional expectation increases by 56 percent. The effect of size on patenting is slightly smaller for both class-weighted and citation-weighted patent production functions, but it is never less than 41 percent. Intangible capital entered abruptly during the 1920s, and (unlike more recent periods) it was formed on a strong fixed capital base.
Experience, EXPER, enters positively and significantly in all but columns 7 and 8, where the coefficient is small and the standard error large. In columns 3 and 5 an extra year of experience increases unweighted and scope-weighted patent counts by 2.4 percent, or 2.9–3.1 percent when fixed effects are introduced. Moreover, there is no evidence of a polynomial in age, contrary to what theory predicts, so the effect of experience on patenting is very large for firms at the limit of the age distribution. Thus, for the oldest firm in the data set (incorporated 1850), the model predicts a 1.95 proportionate change or 195 percent increase in expected patent counts.
Access to external finance as measured by BOND is also associated with a positive shock to patent productivity. This variable has an important within-panel dimension because bonded debt appeared on the balance sheets of firms at different points in time. According to the parameters in columns 4, 6, and 8 the expected number of patents goes up by more than 45 percent when BOND equals one. Additionally, STOCK enters positively and significantly, though the coefficients are much smaller in size than those for BOND. In fact, it is interesting to note that, when comparing the two panel periods, bonded debt becomes a more important source of innovation investment than new issues of stock. W. N. Peach suggests that, following the success of Liberty Bonds during the First World War, investors became more willing to hold different types of securities issued by corporations, which gave the bond market added liquidity.63
Peach, Security Affiliates.
Moreover, as argued by Raghuram Rajan and Luigi Zingales, small investors added a broader array of securities to their portfolios during the bull market of the 1920s, which greased the wheels of trade in the financial sector more generally.
64 Rajan and Zingales, “Financial Systems.”
The results with respect to BOND and STOCK are consistent with Schumpeter's contention that a developed and efficiently functioning capital market has a positive effect on the rate of innovation. Equally, the market power variables support the basic Schumpeterian story. Table 5 reveals that firms with strong market positions tended to have higher patent counts, especially in the citation-weighted patent production function. The parameter on HPOWER equates to a 72 percent increase in citation-weighted patents, whereas for MPOWER the effect is 75 percent. Furthermore, these variables are estimated with larger and more precise coefficients in column 7 relative to columns 5 and 3, which relate to scope-weighted and unweighted patents counts respectively. It is important to note that for the period 1908–1918 HPOWER is negative, which suggests that there was something unique about dominant firms during the 1920s (or their operating environment) that made them predisposed to innovate.
One way of understanding the forces driving these results is to consider the variable LOSPOW. When LOSPOW is set to unity the conditional expectation for patent counts for the 1908–1918 panel is more than 66 percent lower; these firms also yield substantially fewer patents on average in the patent production function for 1919–1928. LOSPOW captures several of the large firms formed during the great merger wave that turned out to be inefficient, and hence were rapidly replaced by more innovative rivals. A plausible explanation for why the sign on HPOWER shifts from being negative to positive between panels is that the shakeout of firms through creative destruction offered an antidote to problems of inefficient incumbency. According to Schumpeter, “competition of the kind we now have in mind acts not only when in being, but also when it is merely an ever-present threat.”65
Schumpeter, Capitalism, p. 85.
Thus the prospect of rent dissipation may have disciplined the product market in general. Firms with strong market positions appear to have been especially powerful engines of technological progress in 1920s America, as evidenced by their propensity to increase the overall quality of patents granted. Market power and competition can have positive effects on innovation concurrently. This is the essence of Schumpeterian innovation through creative destruction.
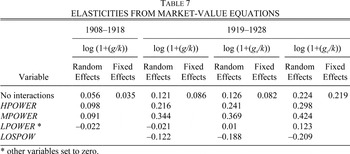
Innovation in a Schumpeterian economy also depends on firms being able to appropriate the returns from the introduction of new technologies. Table 6 reports the results of the market-value equations that illustrate how innovation was rewarded in financial markets. Although fixed-effects estimates are presented in columns 3, 10, 11, and 12, the dominant estimation strategy is random effects, both because of the time invariant construction of market power variables and because random effects gives a larger weight to “between” variation in the data, which in this study is large (see the values of R2 at the base of the table). Year dummies are used throughout to filter out the time trend in market capitalization. Table 6 contains 12 market-value regressions, with and without interactions. Because the addition of interactions changes the interpretation of all the coefficients in the model, it is useful to present the elasticities separately.66
For illustrative purposes, consider equation 5. Without interactions the effect of the firm's normalized stock of patents on market value is [theta]7. With interactions the effect also depends on the firm's level of market power. Thus for high market share firms (HPOWER) the effect is [theta]7+[theta]9.
Thus
Table 7 sets out the partial derivatives relating to the key hypotheses of interest: whether market value varied with an additional unit of the firm's normalized stock of patents, and whether this effect itself depended on the firm's level of market power.
The data unequivocally confirm that financial markets did reward firms for innovating, and they did so more during the 1920s than they had done beforehand. A 1 percent increase in the firm's normalized patent stock yielded a 0.056 percent increase in market value between 1908–1918, but a 0.121 percent increase between 1919–1928. Although the partial derivative is similar in size and significance for scope-weighted patents (0.126), it almost doubles in size to 0.224 when the patent stock is citation-adjusted. The estimated effect of innovation on market value is much larger when citation weights are introduced. Financial markets appear to have been particularly responsive to the introduction of quality patents during this period.
Including interaction terms allows the slope of the relationship between market value and the firm's patent stock to be different depending on the nature of the firm's market power. The regressions reveal a positive slope coefficient of between 0.216 and 0.298 for HPOWER and between 0.344 and 0.424 when MPOWER is the interacting variable.67
Blundell, Griffith, and Van Reenen, “Market Share,” interpret a positive coefficient on the interaction of market power and innovation as evidence of an efficiency effect—that incumbents have incentives to pre-emptively innovate because they receive stock market rewards for doing so.
Interestingly these effects are larger for the 1920s than for the period 1908–1918; even firms with low market shares,
LPOWER, received stock market pay-offs when innovating, which may have stimulated creative destruction. The results suggests that the marginal benefits to searching for new technologies were especially high during the 1920s stock market boom, a factor that helps explain the strong positive effect of market power on citation-weighted patents in
Table 5. The estimates relating to
LOSPOW in the innovation equations are also illuminated further by the way this variable enters interactively in the market value equation. Recall from
Table 5 that firms losing market share between panels produced lower than average patent counts during the 1920s. For a time when the stock market was placing a large premium on innovation, it is revealing that the elasticity estimates at the foot of
Table 7 are negative. To the extent that competition adversely affected appropriability, as reflected in stock market rewards, the perennial gale of creative destruction did strike, “not only at the margins of the profits and outputs of [these] firms, but at their foundation and very lives.”
68 Schumpeter, Capitalism, p. 84.
CONCLUSION
Although Joseph Schumpeter's analysis of the innovation–market power dynamic was shaped by the evolution of early-twentieth-century American industrial structure, this epoch has received little attention in the literature. Instead, researchers have tested Schumpeter's hypothesis in more recent time periods when innovation and firm financial data are more readily available. Despite a plethora of such studies, the evidence in favor of Schumpeterian innovation dynamics is weak. In fact, much of the empirical work stresses that competition, not market power, encourages firms to innovate.
Because the dynamics of the innovation market power relationship may be expected to vary temporally, there is a compelling rationale for understanding the contemporary context for Schumpeter's writings before extrapolating his ideas to modern innovation markets. This article has therefore analyzed Schumpeter in his time. A new data set has been assembled that permits innovation to be tracked in both product and financial markets, thereby allowing a comprehensive test of the Schumpeter hypothesis to be conducted. The historical setting is important insofar as the government held a benevolent view of big business in 1920s America, even though market power abuses by incumbents were commonplace. Furthermore, this period was characterized by rapid technological progress, and by heightened stock market rewards for innovation. The decline of several dominant firms permits creative destruction to be observed and its effects analyzed. Taken together, these features of early-twentieth-century America comprise a novel arena for analyzing the extent to which firms with strong market positions influenced the economy's output of innovations, and how innovation itself was shaped by the process of creative destruction.
The central argument here is that firms with high levels of market power tended to innovate more because they had strong incentives to do so pre-emptively: the threat of creative destruction loomed in the product market, and financial markets rewarded innovators with large payoffs. This is not to deny that other factors may also have been at work. Large firms with market power may have had the requisite know-how and resources to formulate a patent portfolio, although it is also possible that the positive relationship between innovation and market power was mediated by access to capital. Indeed it is important to note that the Schumpeter hypothesis is about much more than a positive correlation between size, market power, and innovation. Schumpeter's basic contention that industry structure and innovation are related holds true only insofar as the financial sector can reallocate capital efficiently to areas of highest value, which is borne out by the innovation equation results in Table 5. Furthermore, competition and market power should not be considered as separate aspects of market structure. This study has shown that both effects function concurrently, which is the fundamental nature of Schumpeterian innovation through creative destruction. Firms experiencing disrupted market shares produced fewer patent grants on average, while they also encountered an unfavorable stock market response to their product market performance. Firms that maintained, or enhanced, their market shares, on the other hand, had strong incentives to search for new technologies because they received large stock market rewards when patenting. Taking both effects together, it appears that the threat of creative destruction does discipline the product market even though “we are dealing with a process whose every element takes considerable time in revealing its true features.”69
Schumpeter, Capitalism, p. 83.
The lesson for policy makers is that antitrust intervention in product markets may disturb the very incentive structures that lead to rapid technological change. A more effective way of encouraging innovation may be to focus on policies that set up appropriate institutions that facilitate investment and technology adoption—institutions (especially financial) that act as a catalyst to creative destruction and hence the process of innovation-based growth.
The data on which this article is based were collected under a British Academy Postdoctoral Fellowship at the London School of Economics. I am very grateful to the Economic History Department for hosting me and for providing a congenial atmosphere for research. The article was written up while I was a Visiting Assistant Professor at MIT's Sloan School of Management. I thank Nick Crafts for encouraging me to refine my thinking on Schumpeter, Rebecca Henderson, Simon Johnson, and Josh Lerner for very thorough and astute comments, and Jim Bessen and the NBER productivity lunch for further suggestions on how to improve this piece. Two anonymous referees also made a significant contribution.