



Nomenclature
- r
-
relative position vector
- v
-
relative velocity vector
- J
-
sum of impulse velocity increments for the chaser
- Q
-
variance of
 $W(t)$
- W
-
random disturbance
- X
-
state parameter
- Y
-
observation quantity

Greek Symbol
-
$\omega $
-
threshold
-
$\omega $
-
orbital angular velocity
-
${\boldsymbol{\varPhi }}$
-
state transition matrices


1.0 Introduction
The explosion of the Nord Stream natural gas pipeline and the attack on the Friendship oil pipeline in Russia pose a threat to the energy security of the entire European region [Reference Kun1]. Simultaneously, the explosion and collapse of the dam at the “Kakhovka” hydroelectric power station in Ukraine have led to significant flooding risks for numerous local residents [Reference Vyshnevskyi, Shevchuk, Komorin, Oleynik and Gleick2]. Vigilant, long-term monitoring of such critical infrastructure is essential to prevent similar incidents. Many crucial assets in space, such as space stations and relay satellites, similarly require the continuous surveillance provided by sub-satellites to implement effective protective measures [Reference Raymond3]. Space surveillance has become a focal concern for nations engaged in space activities.
Optical payloads boast an extensive visible range, operate on a passive logic, and deliver intuitively clear observation effects. Simultaneously, they can conserve energy and have a relatively mature development with comparably low costs. Given appropriate lighting conditions, their operational efficacy is exceptional, making them the preferred means for space surveillance and holding significant research value [Reference Flohrer, Krag, Klinkrad and Schildknecht4].
As the space environment becomes increasingly complex, the number of entities threatening space assets (including debris, uncontrolled satellites, space weapons, and small celestial bodies) is rising sharply. Space surveillance satellites also often experience communication delays with ground stations, presenting a demand for autonomous planning capabilities in satellites equipped with observational capacities to address time-sensitive tasks. However, the computational capabilities on board satellites are significantly inferior to those on the ground, posing challenges for autonomous planning in optical space surveillance [Reference George and Wilson5].
Orbital pursuit-evasion games represent a highly representative category of time-sensitive tasks in space [Reference Zhang, Zhang, Zhang, Shi, Tang and Li6]. In addressing the multi-stage pulse evasion problem for dynamic targets, employing optical payloads implies the necessity of preempting the opponent’s sunlit areas by flying between the observer and the sun for observation. To address the ever-evolving landscape of emergency response operations, mainstream military command and control strategies predominantly employ two methodologies: highly procedural command and control, and intuitive or heuristic approaches characterised by lower data density requirements. Traditional command and control methodologies rely on comprehensive and formal decision-making processes, emphasising the collection of complete data sets followed by decision outputs derived from established models. Major Blair S. Williams [Reference Williams7] critiques this approach as a “stolid template,” noting that it necessitates extended decision-making periods. As the command-and-control environment becomes increasingly complex and volatile, there has been a rise in the adoption of intuitive or heuristic approaches, which demand lower computational requirements and facilitate rapid decision-making and response, exemplified by the OODA (Observe, Orient, Decide, Act) loop [Reference Bryant8]. However, the OODA loop’s sole focus on swift responses is not universally applicable to all emergency response scenarios [Reference Yang, Li, Zhu, Cui, Yi and Qin9], as rapid heuristic methods are generally perceived as unreliable, carrying significant decision-making risks. For satellites, where fuel is exceedingly precious and non-renewable, careful decision-making is paramount. It is reductive to evaluate these two methodologies without considering the decision-making environment. Yun [Reference Yun, Ko, Byun, Kim, Moon and Lee10] posits that both the quality and timing of decisions influence their effectiveness. Competent decision-makers must discern between decisions necessitating immediate responses and those that allow for delayed responses. In the specific context of satellite orbital manoeuvers examined in this study, if the satellite is in the transitional orbital phase at a considerable distance, with ample time for observation, orbit determination, and adjustment, the error risks associated with heuristic methods become unacceptable. Conversely, during the close-proximity pursuit phase, failure to promptly respond to target orbital manoeuvers renders the risks associated with heuristic errors tolerable, as prolonged decision-making inherently increases the likelihood of failure. Consequently, decision-makers must seek an optimal balance between decision-making time and accuracy to ensure the rationality of onboard decisions.
In recent years, systems engineering and granular computing methods have both emphasised the need to balance model accuracy and computational complexity. Systems engineering [Reference Cloutier and Verma11] emphasises the ability of human beings to abstract problems and solve complex problems through modeling and model organisation and management. When establishing system models, a balance must be struck between the authenticity and manageability of the models, utilising models with varying degrees of fidelity in fitting the physical system to address different problems. By discarding the encumbrance of details, one can oversee the entire problem, thereby avoiding reaction cycles that the expenditure of system analysis and evaluation does not permit. Additionally, granular computing and the concept of multiple granularities similarly involve constructing multi-granularity models with different fitting degrees, utilising models of varying granularity to accomplish decision-making, making them suitable for handling the balance between decision speed and accuracy [Reference Wang, Yang and Xu12]. Thus, constructing multi-granularity decision models for space observation planning is a viable approach.
The use of multi-granularity models hinges on the description of decision model granularity and the selection of granularity. Due to the intricate calculation processes involved in fine-grained computations of orbit determination (OD) and orbital manoeuver (OM), optimisation algorithms are predominantly employed. The stochastic nature of initial values and uncertainties in iteration cycles contribute to the existence of uncertainties in the cost and outcomes of multi-granularity decision-making. Three-way decision [Reference Yao, Wen, Li, Polkowski, Yao, Tsumoto and Wang13] making has emerged in recent years as a novel approach to address uncertain decision-making. In other domains, it has successfully resolved a series of uncertainty-related decision problems [Reference Qian, Liu, Miao and Yue14–Reference Yang, Li, Fujita, Liu and Yao16]. Building upon the foundation of multi-granularity models and incorporating the concept of three-way decision-making, this approach enables swift judgements in situations with sufficient information and employs delayed decision-making in scenarios with insufficient information, allowing for decisions to be made after acquiring additional information. To strike a balance between decision speed and quality, this paper proposes an optical space surveillance multi-granularity on-board decision method based on three-way decision-making.
The remaining sections of this paper are organised as follows. Section 2 introduces the orbital pursuit-evasion model of optical space surveillance satellites. Section 3 outlines the definition of multi-granularity observation models and granularity selection methods. Section 4 details the experimental procedures conducted to validate the proposed methodology under varying conditions. Finally, in Section 5, the conclusions of this research are presented.
2.0 Problem formulation
This section primarily aims to provide the mathematical description of the pursuit-evasion game under study and an introduction to the objective functions involved.
2.1 Scenario definition
This paper studies the orbital pursuit-evasion games problem of optical space surveillance satellites. The primary consideration is that for the important asset satellite whose space moving target is close to its own side, the observation satellite needs to observe the moving target and continuously monitor it. The intention of the moving target can be judged by means of load identification and orbit prediction, which can provide support for further defensive actions.
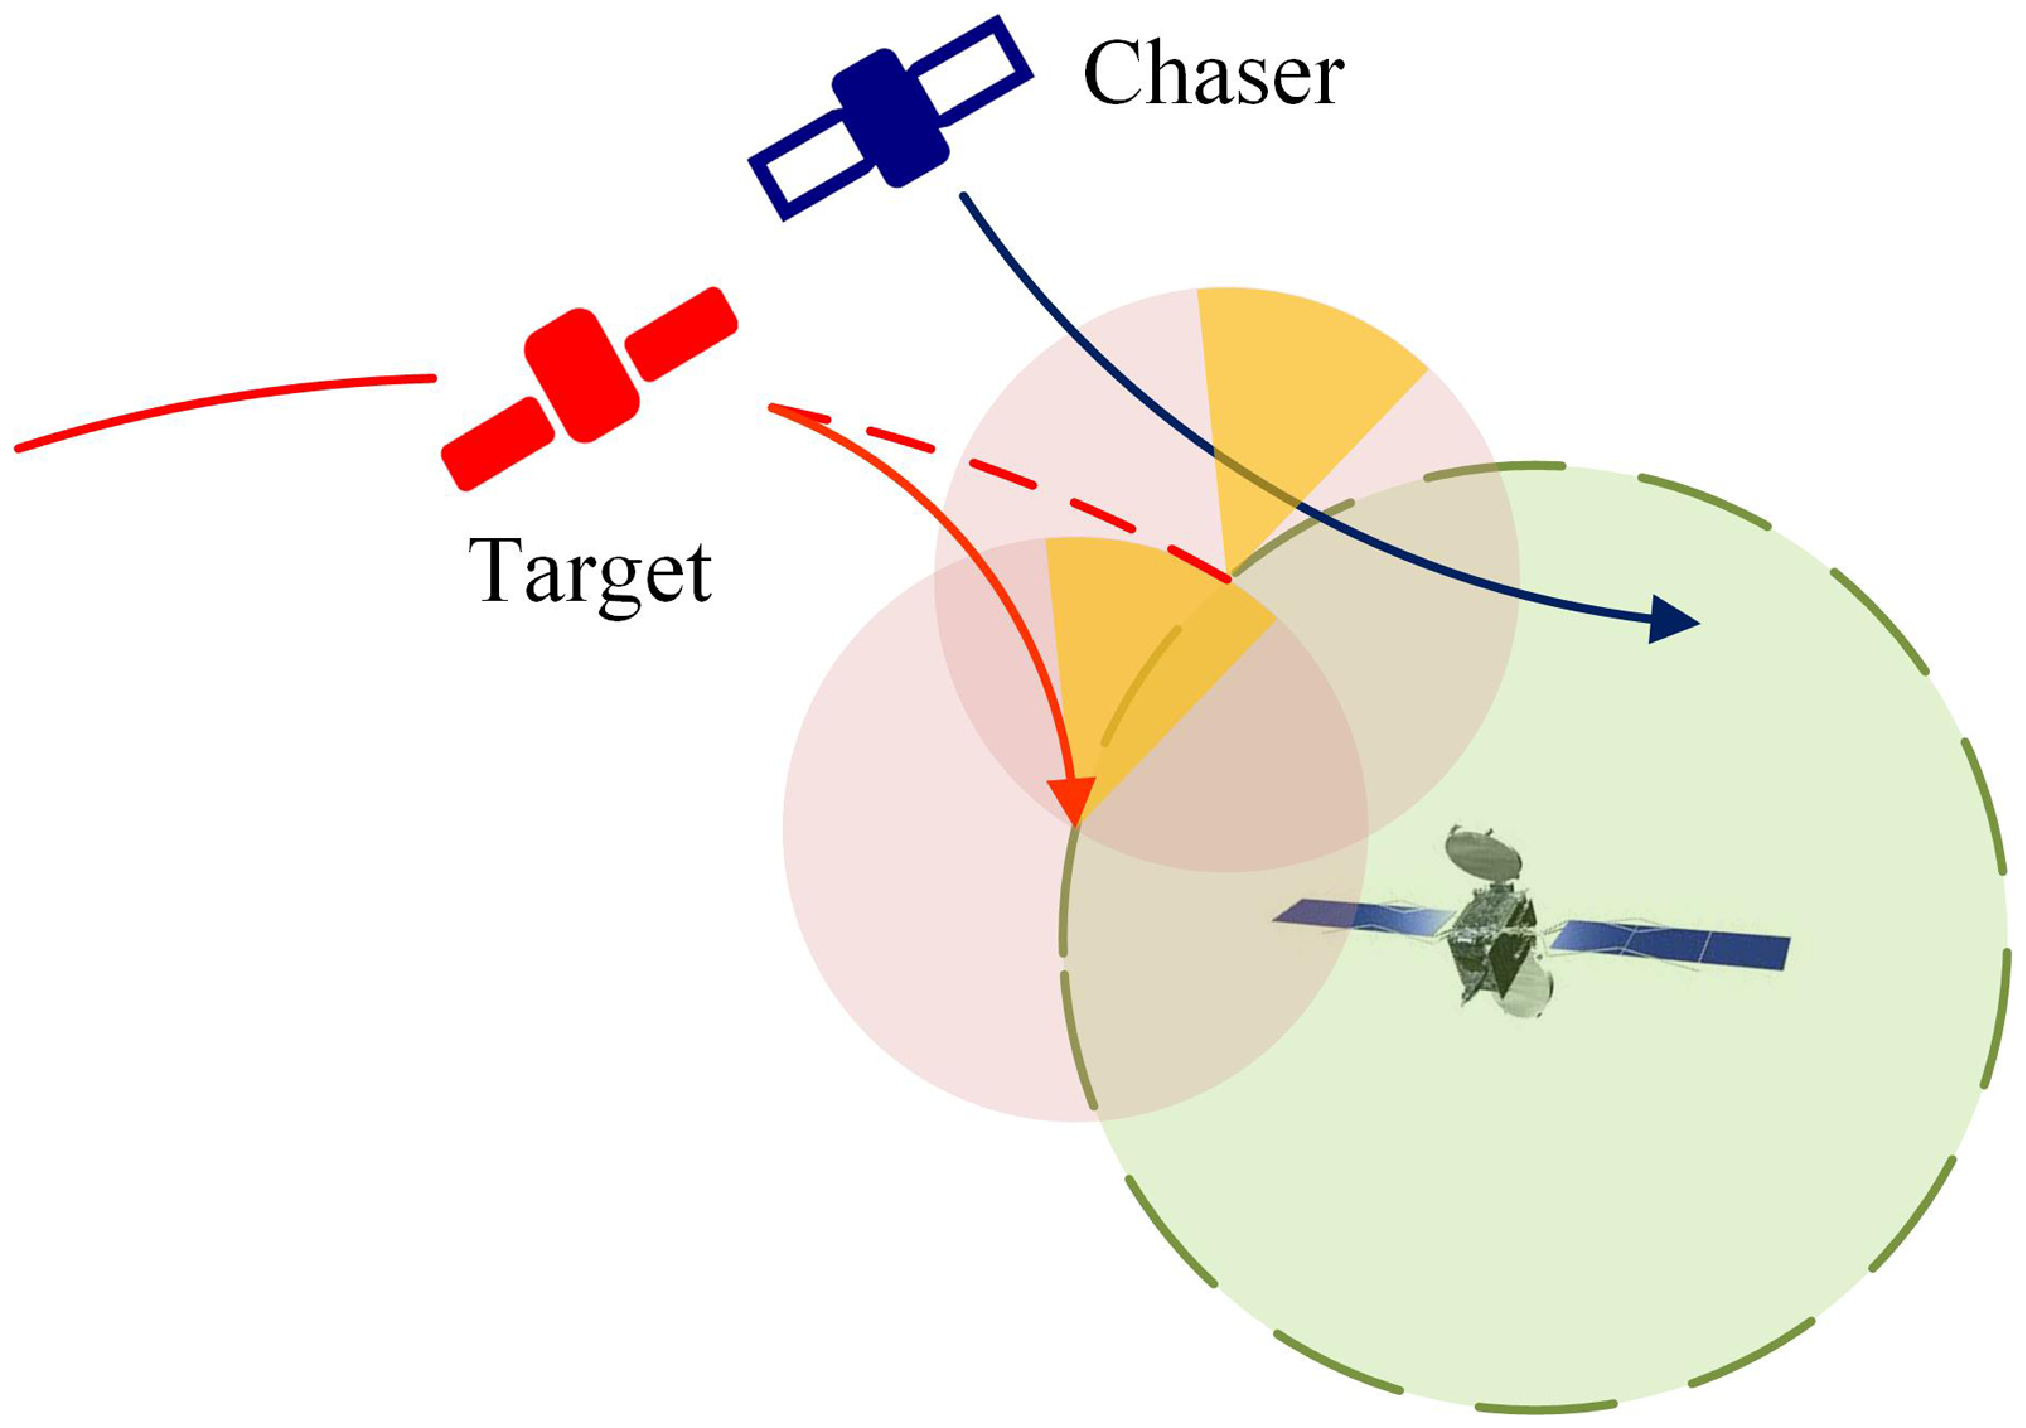
Three types of spacecrafts are defined: important asset spacecraft (Asset), such as space station, relay satellite, etc., running on geosynchronous orbit (GEO); the target satellite (Target), a non-cooperative target satellite close to the asset, runs near GEO; the chasing satellite (Chaser), our monitoring satellite carrying optical payload, is designed to approach the target satellite and observe it at close range. As shown in Fig. 1, assuming that the chasing satellite finds that the target satellite is close to the important asset spacecraft, the chasing satellite needs to apply multiple pulses to reach the target satellite’s solar-illuminated area in advance.
The orbital pursuit-evasion game.
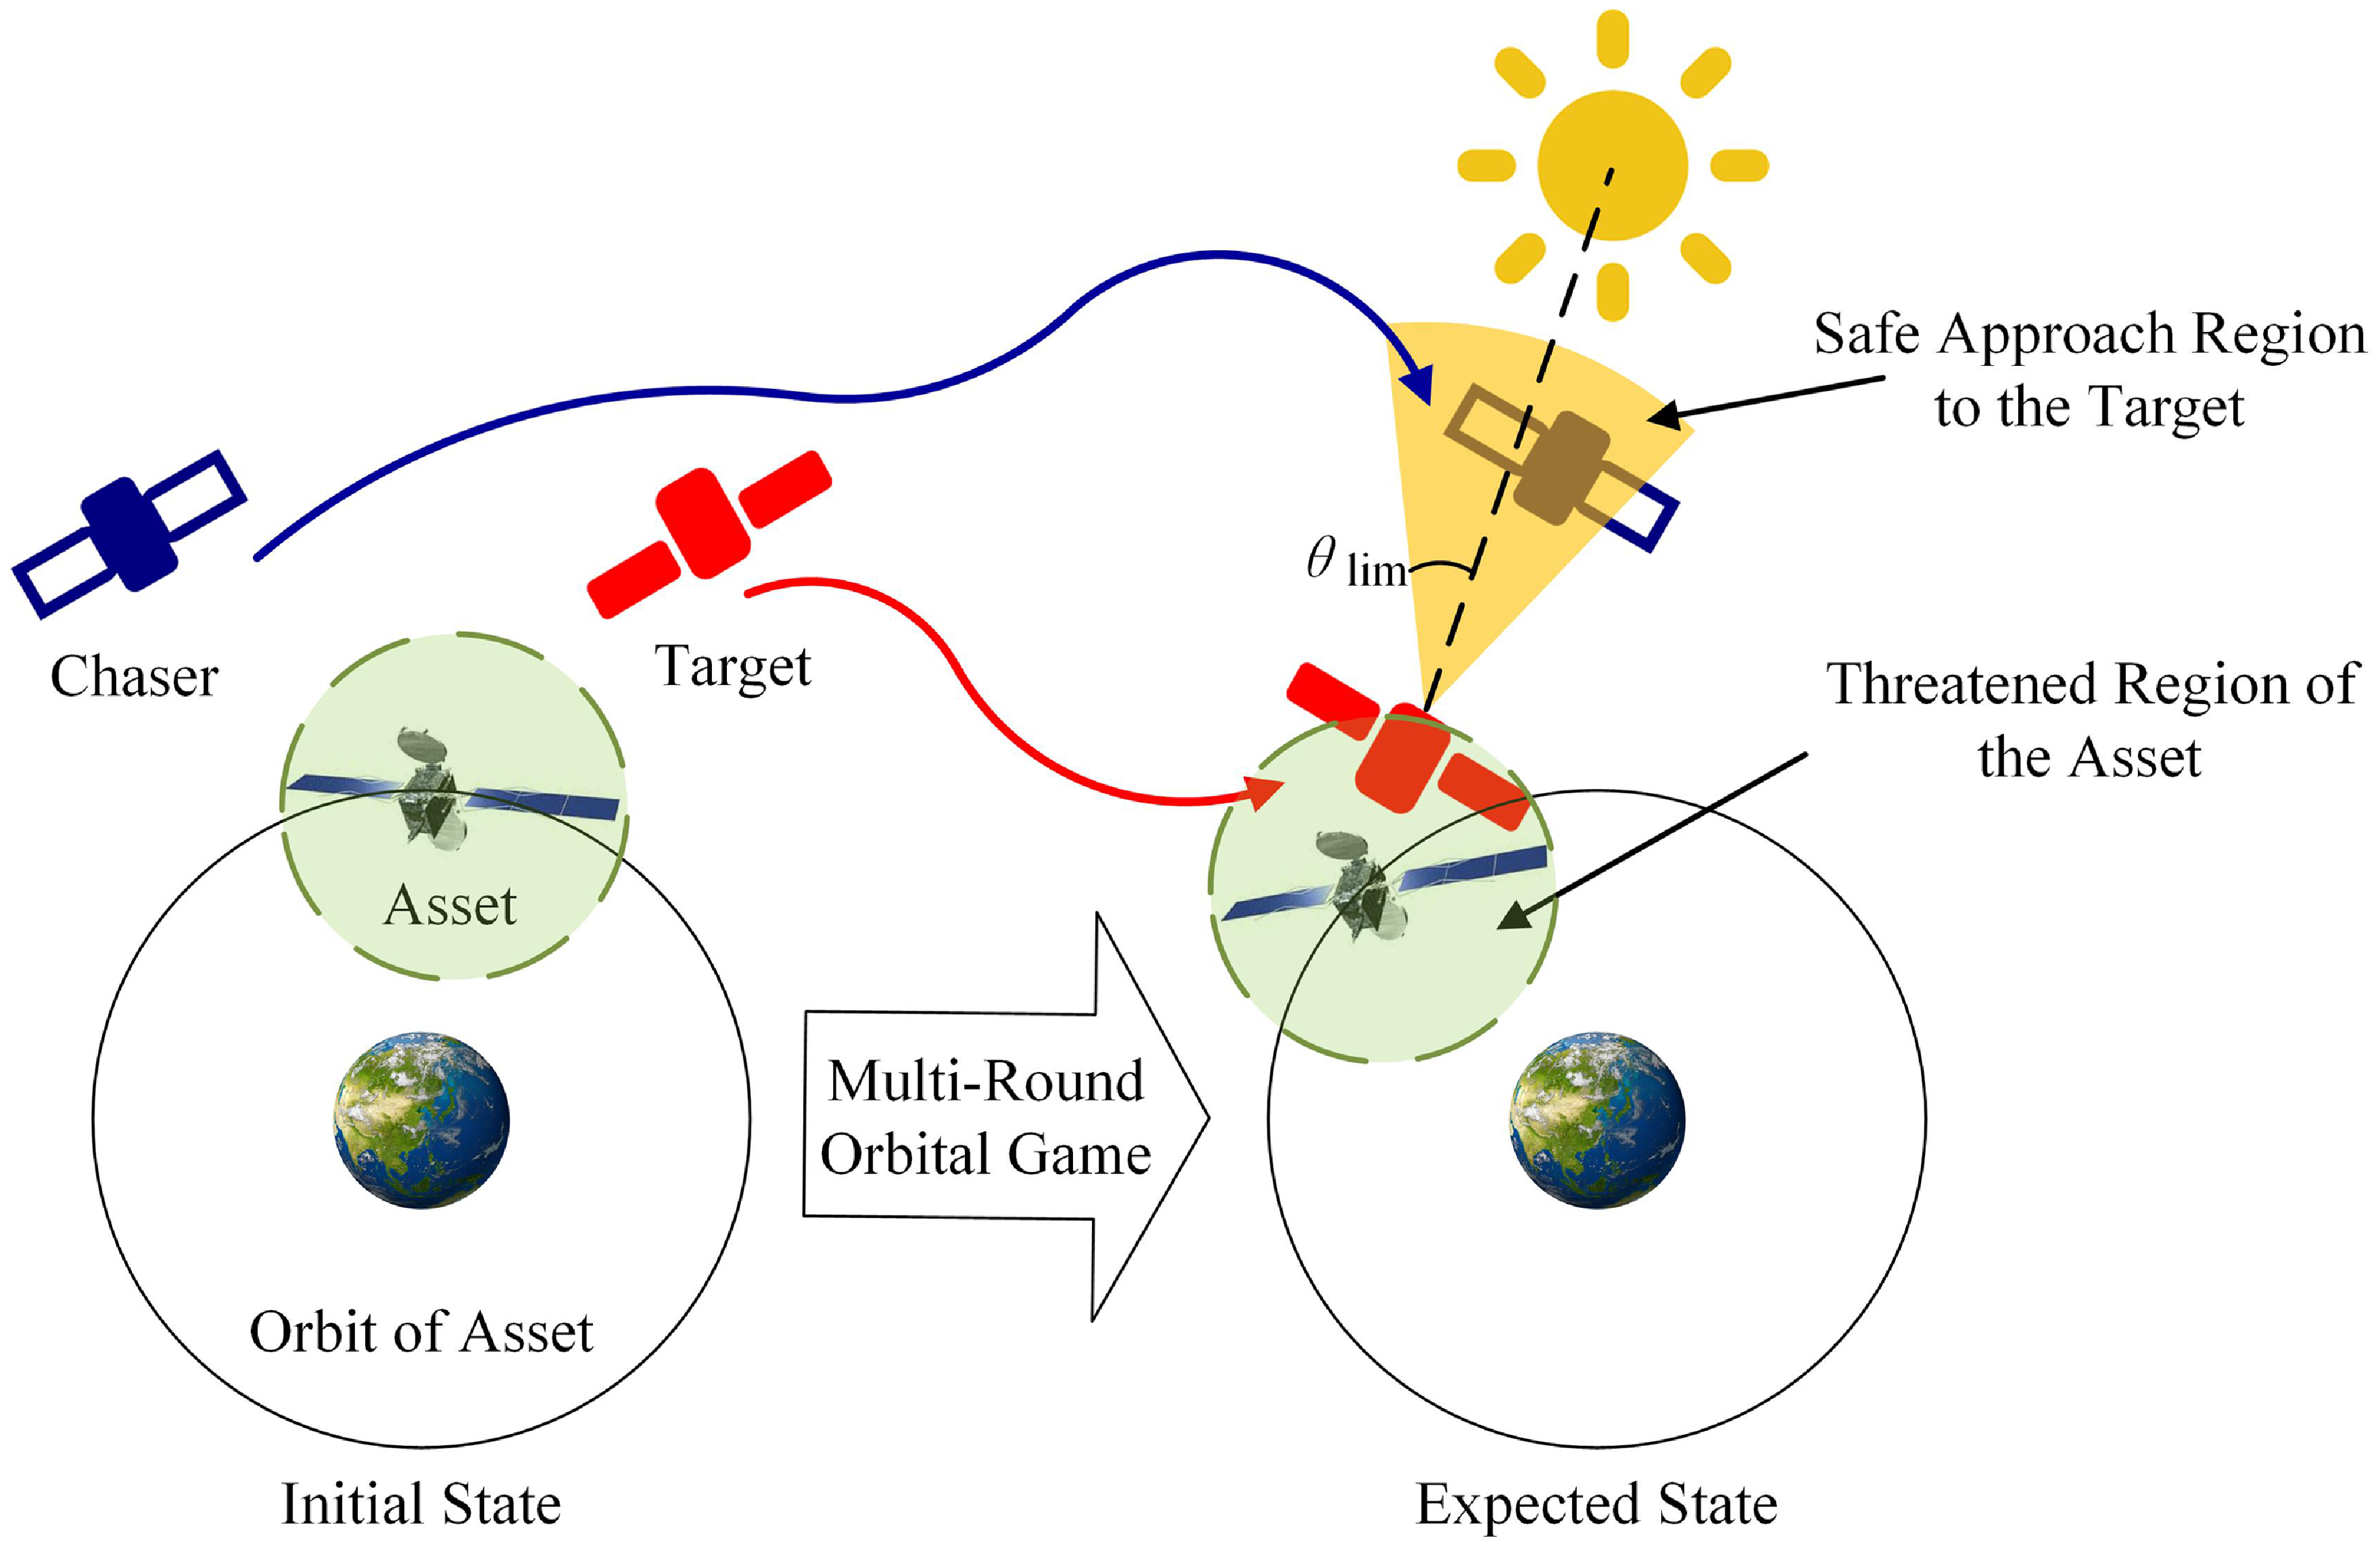
The safe approach region is defined with the target satellite as the vertex, encompassing the conical solar-illuminated area between the target satellite and the sun. Within this region, the camera field of view of the target satellite experiences a sunlit background, creating an approximate blind spot, while the chasing satellite’s camera field of view is optimal. This optimal field of view lays the foundation for subsequent assessments of the target satellite’s intentions and the subsequent response. The target satellite also carries optical payloads. Upon detecting the approach of the chasing satellite, the target satellite should undertake specific evasion manoeuvers based on the chasing satellite’s position and velocity. This is done to prevent the chasing satellite from entering its own solar-illuminated area. Simultaneously, the target satellite, in order to maintain its mission of observing asset spacecraft, needs to preserve its original orbital position and orientation as much as possible.
This paper considers close-range pursuit-evasion tasks with a dynamic model based on the two-body problem centred on Earth. During the orbital manoeuver process, the relative distance between the chasing satellite and the target satellite is much smaller than the orbital radius of GEO. The Clohessy–Wiltshire (CW) equations [Reference Clohessy and Wiltshire17] are employed to approximate the relative orbital motion of the two satellites. These equations are expressed as:
 \begin{align}\left\{ \begin{array}{l}\ddot x = 2\omega \dot y + 3{\omega ^2}x + {f_x}\\[5pt] \ddot y = - 2\omega \dot x + {f_y}\\[5pt] \ddot z = - {\omega ^2}z + {f_z}\end{array} \right.\end{align}
where
 $\omega = \sqrt {\mu /a_0^3} $
represents the average orbital angular velocity of the reference spacecraft.
Equation 1 is a second-order differential equation, and its solution is:
 \begin{align}\left[ {\begin{array}{*{20}{c}}{{\boldsymbol{r}}(t)}\\[5pt] {{\dot{\boldsymbol{r}}}(t)}\end{array}} \right] = \left[ {\begin{array}{c@{\quad}c}{{{\boldsymbol{\varPhi }}_{rr}}(\tau )} {}& {{{\boldsymbol{\varPhi }}_{rv}}(\tau )}\\[5pt] {{{\boldsymbol{\varPhi }}_{vr}}(\tau )} {}& {{{\boldsymbol{\varPhi }}_{vv}}(\tau )}\end{array}} \right]\left[ {\begin{array}{*{20}{c}}{{\boldsymbol{r}}({t_0})}\\[5pt] {{\dot{\boldsymbol{r}}}({t_0})}\end{array}} \right] + \int {\left[ \begin{array}{l}{{\boldsymbol{\varPhi }}_{rv}}(\tau )\\[5pt] {{\boldsymbol{\varPhi }}_{vv}}(\tau )\end{array} \right]} f(s)ds\end{align}
where
 ${\boldsymbol{r}}(t) = {\left[ {\begin{array}{*{20}{c}}{x(t)} {}{y(t)} {}{z(t)}\end{array}} \right]^T}$
is the relative position vector,
 ${\dot{\boldsymbol{r}}}(t) = {\left[ {\begin{array}{*{20}{c}}{\dot x(t)} {}{\dot y(t)} {}{\dot z(t)}\end{array}} \right]^T}$
is the relative velocity vector,
 $\tau = t - {t_0}$
is the flight time, and the state transition matrices are:
 \begin{align}{{\boldsymbol{\varPhi }}_{rr}}(\tau ) = \left[ {\begin{array}{c@{\quad}c@{\quad}c}{4 - 3\cos \omega \tau } {}& 0 & {}0\\[5pt] {6(\sin \omega \tau - \omega \tau )} & {}1 {}& 0\\[5pt] 0 {}& 0& {}{\cos \omega \tau }\end{array}} \right]\end{align}
 \begin{align}{{\boldsymbol{\varPhi }}_{rv}}(\tau ) = \left[ {\begin{array}{c@{\quad}c@{\quad}c}{\dfrac{1}{\omega }\sin \omega \tau } & {}{\dfrac{2}{\omega }(1 - \cos \omega \tau )} {}&0\\[5pt] {\dfrac{2}{\omega }(\cos \omega \tau - 1)}& {}{\dfrac{1}{\omega }\left( {4\sin \omega \tau - 3\omega \tau } \right)} {}&0\\[5pt] 0 {}& 0 {}& {\dfrac{1}{\omega }\sin \omega \tau }\end{array}} \right]\end{align}
 \begin{align}{{\boldsymbol{\varPhi }}_{vr}}(\tau ) = \left[ {\begin{array}{c@{\quad}c@{\quad}c}{3\omega \sin \omega \tau }& {}0& {}0\\[5pt] {6\omega (\cos \omega \tau - 1)} {}&0& {}0\\[5pt] 0 {}&0& {}{ - \omega \sin \omega \tau }\end{array}} \right]\end{align}
 \begin{align}{{\boldsymbol{\varPhi }}_{vv}}(\tau ) = \left[ {\begin{array}{c@{\quad}c@{\quad}c}{\cos \omega \tau } {}& {2\sin \omega \tau }& {}0\\[5pt] { - 2\sin \omega \tau }& {}{4\cos \omega \tau - 3} {}&0\\[5pt] 0& {}0& {}{\cos \omega \tau }\end{array}} \right]\end{align}
Considering impulse-type orbital manoeuvers, the expression for the solution to Equation 1 becomes:
 \begin{align}\left[ {\begin{array}{*{20}{c}}{{\boldsymbol{r}}(t)}\\[5pt] {{\dot{\boldsymbol{r}}}(t)}\end{array}} \right] = {\boldsymbol{\varPhi }}(t,{t_0})\left[ {\begin{array}{*{20}{c}}{{\boldsymbol{r}}({t_0})}\\[5pt] {{\dot{\boldsymbol{r}}}({t_0})}\end{array}} \right] + \sum\limits_{i = 1}^N {{\boldsymbol{\varPhi }}(t,{t_i})} \left[ {\begin{array}{*{20}{c}}0\\[5pt] E\end{array}} \right]\Delta {v_i}\end{align}
where t i is the time of the impulse orbital manoeuver, N is the number of manoeuvers that occurred before time t, and Δv i is the impulse velocity increment vector corresponding to the moment t i .
Geometrically defining the safe approach region, let r S denote the position of the sun in the Earth’s equatorial inertial frame. In the calculations, obtained based on ephemerides, the position vector from the target satellite to the sun at time t is given by:
 \begin{align}{\boldsymbol{L}}\left( t \right){\rm{ = }}{\boldsymbol{r}_S} - {\boldsymbol{r}_T}\left( t \right)\end{align}
2.2 Objective function
In the pursuit-evasion game, the chasing satellite needs to optimise its strategy to approach the safety proximity region of the target satellite, while the target satellite simultaneously optimises its strategy to prevent the chasing satellite from entering its own safety proximity region. Constructing the game model:
 \begin{align}\begin{array}{l}{{\dot x}_C} = f({x_C},{u_C},t)\\[5pt] {{\dot x}_T} = f({x_T},{u_T},t)\end{array}\end{align}
x C , x T represent the states of the chasing and target satellites, where C represents the chasing satellite, T represents the target satellite, and u denotes a pair of strategies.
The initial states constitute the initial boundary conditions for the game:
 \begin{align}\begin{array}{l}{x_C}({t_0}) = {x_{C0}}\\[5pt] {x_T}({t_0}) = {x_{T0}}\end{array}\end{align}
Terminal time constraint:
 \begin{align}t \lt {t_f}\end{align}
To ensure that the chasing satellite enters the safety proximity region of the target satellite at the terminal time, there are terminal position constraints:
 \begin{align}\left\{ \begin{array}{l}||\boldsymbol{r}_{CT}^o({t_f})||_{}^{} \le {\boldsymbol{r}_{\lim }}\\[5pt] {\theta _T}({t_f}) \lt {\theta _{\lim }}\end{array} \right.\end{align}
The objective of the target satellite is to perform orbital manoeuvers to ensure that, at the terminal time, the chasing satellite is not within its safety proximity region:
 \begin{align}\left\{ \begin{array}{l}||\boldsymbol{r}_{CT}^o({t_f})||_{}^{} \gt {\boldsymbol{r}_{\lim }}\\[5pt] or\\[5pt] {\theta _T}({t_f}) \gt {\theta _{\lim }}\end{array} \right.\end{align}
Simultaneously, the total fuel constraint is expressed through velocity increments:
 \begin{align}\left\{ \begin{array}{l}||\Delta {V_C}||_{}^{} \le \Delta {V_{C\max }}\\[5pt] ||\Delta {V_T}||_{}^{} \le \Delta {V_{T\max }}\end{array} \right.\end{align}
The objective function
 ${u_C}^{\ast},{u_T}^{\ast}$
for a set of optimal saddle point strategies is:
 \begin{align}\begin{array}{l}{\eta _T}(u_C^*,u_T^*) = \left\{ \begin{array}{l}\max ||\boldsymbol{r}_{CT}^o({t_f})||\\[5pt] \min ||\Delta {V_T}||\end{array} \right.\\ \\ {\eta _C}(u_C^*,u_T^*) = \left\{ \begin{array}{l}\min ||\boldsymbol{r}_{CT}^o({t_f})||\\[5pt] \min ||\Delta {V_C}||\end{array} \right.\end{array}\end{align}
3.0 Multi-granularity onboard decision method
This section introduces a multi-granularity decision-making approach to address decision-making under various mission urgency scenarios, comprising two main components: the multi-granularity observation algorithm model and the multi-granularity onboard decision module. The multi-granularity observation algorithm model includes the orbit determination algorithm model and the orbit manoeuver algorithm model. The orbit determination algorithm model is divided into coarse-grained orbit determination (coarse-grained OD), medium-grained least squares coarse fitting (medium-grained OD), and fine-grained least squares fine fitting (fine-grained OD). The orbit manoeuver algorithm model is divided into coarse-grained numerical approximation solution (coarse-grained OM), medium-grained coarse optimisation (medium-grained OM), and fine-grained fine optimisation (fine-grained OM). The multi-granularity onboard decision module includes orbit game strategies, decision cost analysis methods, and a granularity selection method based on sequential three-way decision. A granularity inheritance criterion is designed for multiple rounds of the game to reduce the computational load of the sequential three-way decision top-down architecture. The basic design concept of the multi-granularity decision framework is illustrated in Fig. 2.
The multi-granularity decision framework.
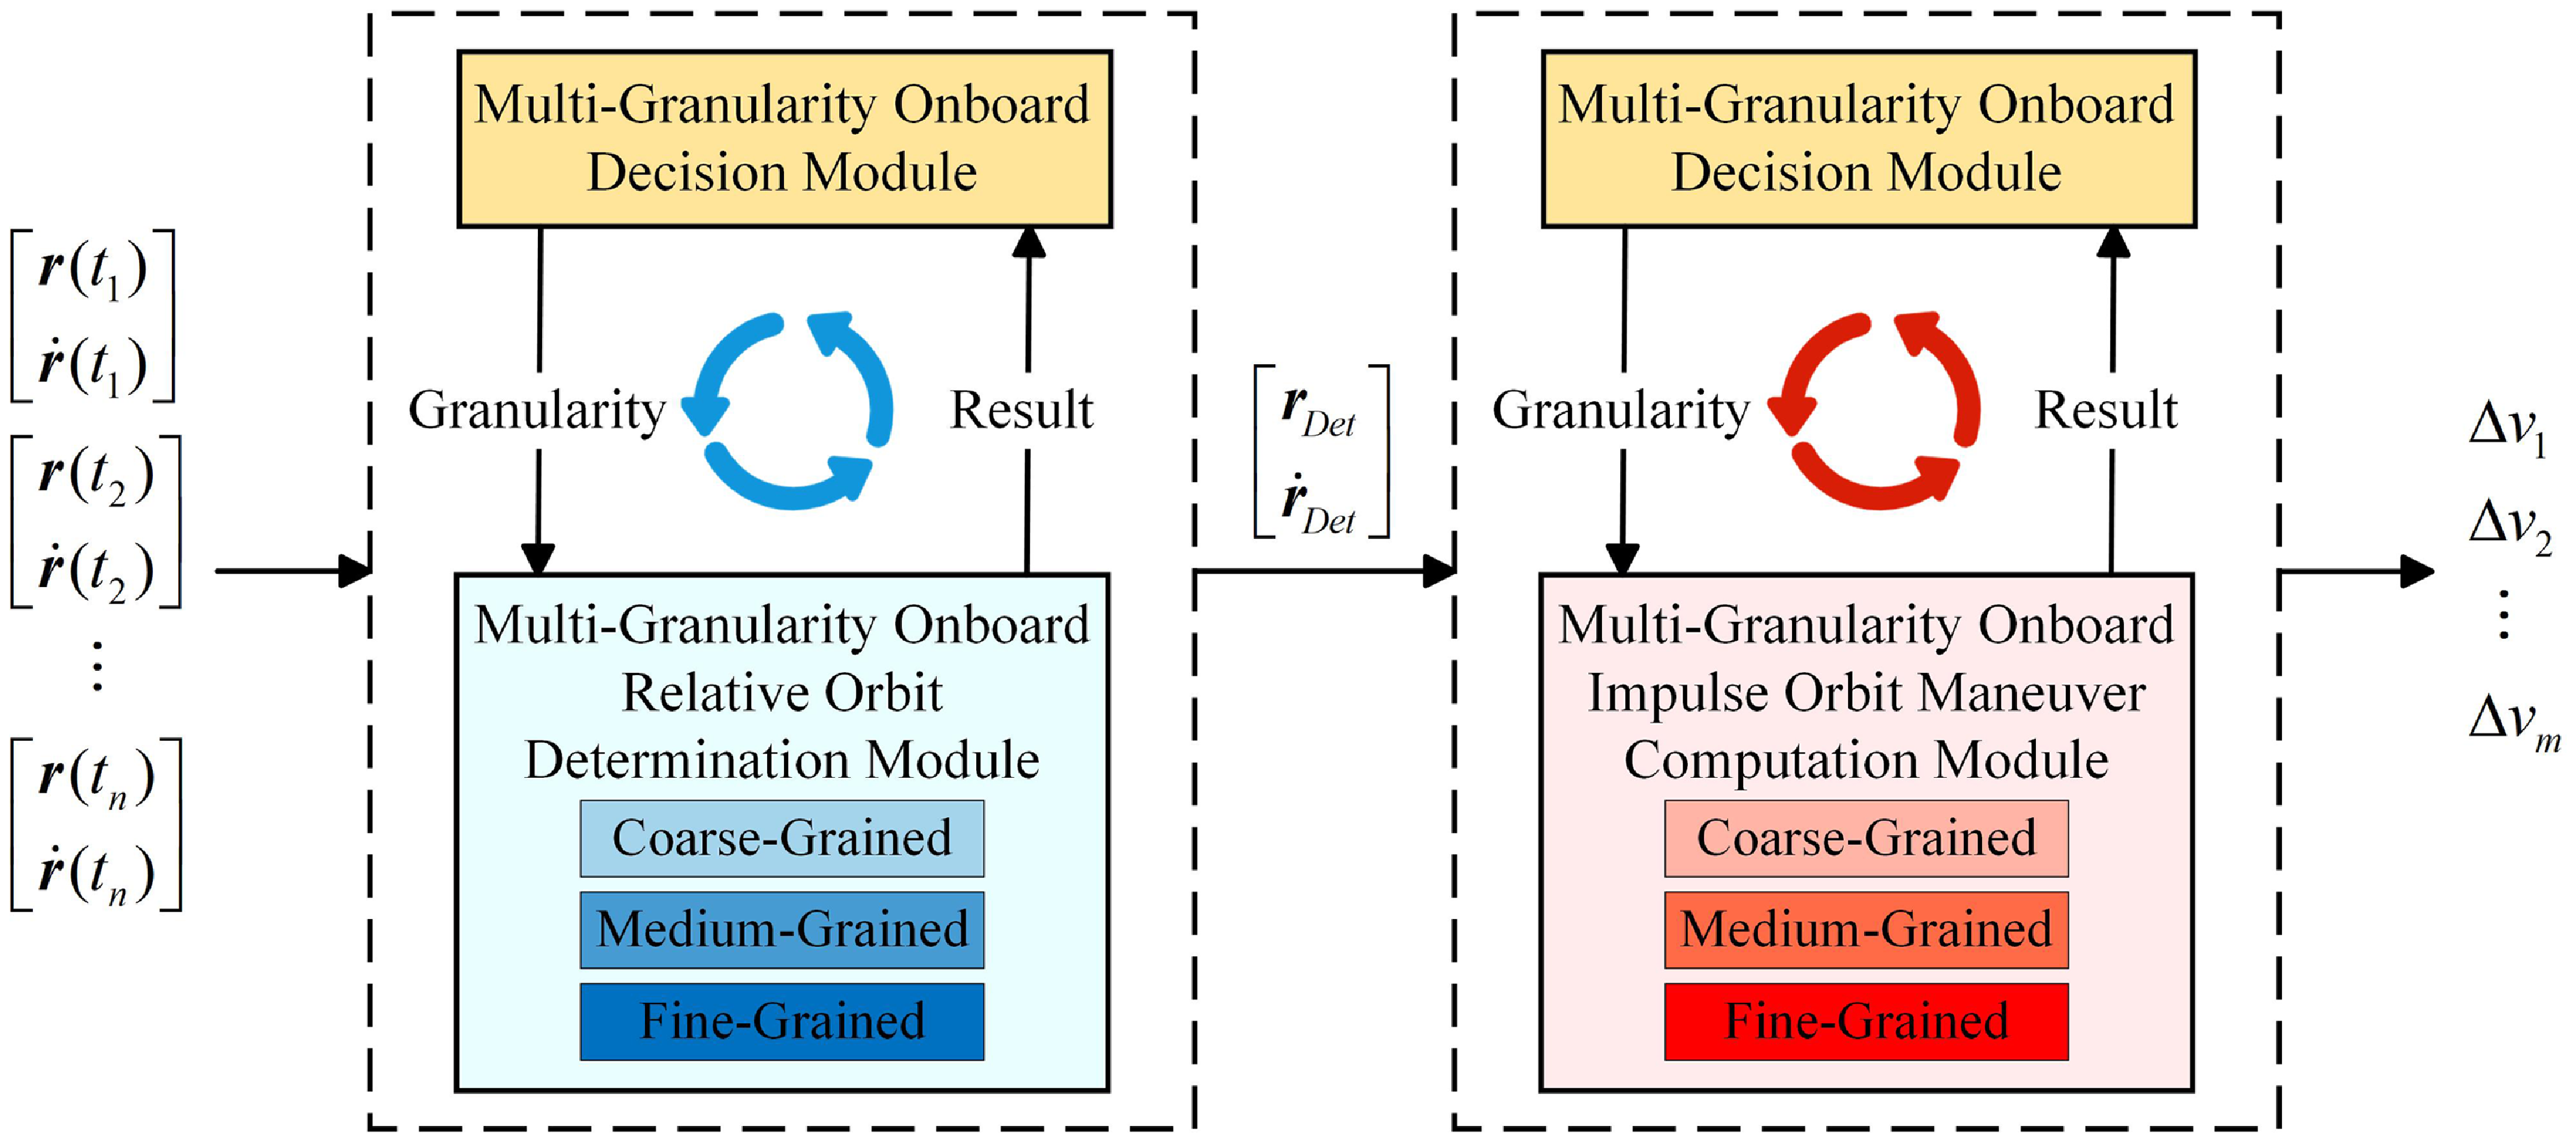
During the game process, the relative orbital parameter
 $\left[ {\begin{array}{*{20}{c}}{{{\boldsymbol{r}}_{Det}}}\\[5pt] {{{{\dot{\boldsymbol{r}}}}_{Det}}}\end{array}} \right]$
is obtained by calculating the observation parameter
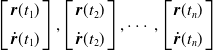 $\left[ {\begin{array}{*{20}{c}}{{\boldsymbol{r}}({t_1})}\\[5pt] {{\dot{\boldsymbol{r}}}({t_1})}\end{array}} \right],\left[ {\begin{array}{*{20}{c}}{{\boldsymbol{r}}({t_2})}\\[5pt] {{\dot{\boldsymbol{r}}}({t_2})}\end{array}} \right], \cdots, \left[ {\begin{array}{*{20}{c}}{{\boldsymbol{r}}({t_n})}\\[5pt] {{\dot{\boldsymbol{r}}}({t_n})}\end{array}} \right]$
. In the orbit determination phase, the multi-granularity on-board decision-making module may choose different granularity levels based on the specific conditions, triggering multiple iterations of the relative orbit determination algorithm. After determining the relative orbit, the obtained parameters are used as input to calculate the velocity impulses
 $\Delta {v_1},\Delta {v_2}, \cdots, \Delta {v_m}$
required for orbit manoeuvering. In the manoeuvering calculation process, the multi-granularity on-board decision-making module may also opt for different granularity levels, invoking multiple iterations of the orbit manoeuvering algorithm.
3.1 Multi-granularity onboard relative orbit determination model
This study contemplates using an optical camera and lidar data for relative orbit determination. The onboard relative orbit determination algorithm utilises multiple images and distance measurements within the instrument coordinate system to obtain state parameters for various relative position points. Employing fitting calculations at different computational granularities, the algorithm determines the initial relative position, thereby deriving the orbital parameters of the target. Subsequently, the orbit is extrapolated to facilitate the computation of proximity manoeuvers in the subsequent stages.
Due to pixel constraints in optical cameras, the relative positions r x , r y in the instrument coordinate system are determined by the centre position of the pixel block where the target is located in the camera’s field of view. For instance, if the actual relative position of the target with respect to the camera’s instrument centre is (+30.3, −20.7) m, and each pixel block on the camera represents a spatial distance of 1m, then the measured values from the camera would be (+30, −21) m at this distance. The lidar measurement r z is subject to systematic errors and is directly proportional to the actual distance. The velocities v x , v y , v z are obtained through interval sampling and interpolation.
The state equation and observation equation are defined as follows, with input and output state variables shown in Fig. 3.
 \begin{align}X(t) = \left[ {\begin{array}{*{20}{c}}{{\boldsymbol{r}}(t)}\\[5pt] {{\dot{\boldsymbol{r}}}(t)}\end{array}} \right],{X_{Det}} = \left[ {\begin{array}{*{20}{c}}{{{\boldsymbol{r}}_{Det}}}\\[5pt] {{{{\dot{\boldsymbol{r}}}}_{Det}}}\end{array}} \right]\end{align}
The state variables for relative orbit determination.

Selecting state parameter
 ${X_i},i = 1, \cdots, N$
, the motion state equation for the studied object can be expressed in the following form of first-order differential equations:
 \begin{align}{\rm{d}}X(t)/{\rm{d}}t = \,f(X) + G(t) \cdot W(t)\end{align}
where
 $W(t)$
is a random disturbance, with a mean value
 $E[W(t)] = 0$
.
The correlation function is:
 \begin{align}\begin{array}{l}COV[W(t),W(\tau )] = Q(t)\delta (t - \tau )\\[5pt] \delta (t - \tau ) = \left\{ \begin{array}{l}1\,\,\,\,\,\,t = \tau \\[5pt] 0\,\,\,\,\,\,t \ne \tau \end{array} \right.\end{array}\end{align}
where
 $Q(t)$
is the variance of
 $W(t)$
.
The initial estimate of the state vector is:
 \begin{align}X({t_0}) = {X_0}\end{align}
The observation quantity
 ${Y_j},j = 1, \cdots, M$
expresses the observation equation in vector form.
 \begin{align}Y{\rm{(}}t{\rm{)}} = h{\rm{(X)}} + V{\rm{(t)}}\end{align}
where
 $V(t)$
is a random disturbance, with a mean value
 $E[V(t)] = 0$
.
The correlation function is:
 \begin{align}COV[V(t),V(\tau )] = R(t)\delta (t - \tau )\end{align}
where
 $R(t)$
is the variance of
 $V(t)$
.
Assume that
 $W(t)$
and
 $V(t)$
are mutually independent.
 \begin{align}COV[W(t),V(\tau )] = 0\end{align}
Both the medium-grained OD and fine-grained OD models utilise the least squares fitting method. Assuming that at time t0, the state of the studied object is X0, the state at time t is obtained by solving the state equation using numerical methods:
 \begin{align}{X_{\rm{t}}} = {X_0} + \,\int_{{{\rm{t}}_0}}^{\rm{t}} {f(X) + G({\rm{t}}) \cdot W({\rm{t}})} \end{align}
The deviation between observed measurement values and calculated values
 \begin{align}\Delta Y = {Y_{\rm{M}}} - Y({X_t})\end{align}
The change in state variables after one iteration is defined as
 $\Delta X = \mathop {{X_0}}\limits^ \wedge - {X_0}$
Using the numerical finite difference method, calculate the partial derivative matrix of the observations with respect to the improved state.
 \begin{align}H(\Delta X) = \frac{{\partial Y}}{{\partial \Delta X}} = \frac{{Y({X_0} + \Delta X) - Y({X_0})}}{{\Delta X}}\end{align}
So, the new estimate after one iteration is
 \begin{align}\mathop {{X_0}}\limits^ \wedge = {X_0} + {\left( {{H^T}WH} \right)^{ - 1}}{H^T}W\Delta Y\end{align}
Repeatedly iterate until convergence to obtain the value of
 ${X_{Det}}$
.
The following introduces three granularity levels of orbit determination models.
-
(1) Coarse-grained OD
At the coarse-grained level, only a small number of observations are calculated. The orbit is propagated by the observation time interval, and pairwise averages are taken. This granularity level has the smallest computational load but the poorest fitting effect.
-
(2) Medium-grained OD
At the medium-grained level, the least squares fitting algorithm is employed with fewer iterations, resulting in a slightly better fitting effect. At this granularity level, adopting a small number of observations and a larger convergence error helps the algorithm quickly exit the iteration, reducing computation time.
-
(3) Fine-grained OD
At the fine-grained level, a larger number of observations, a smaller convergence error and a larger maximum iteration count are adopted to achieve higher fitting accuracy and obtain better initial orbit fitting results. However, the corresponding fitting time is also the longest.
3.2 Multi-granularity onboard impulse orbit manoeuver model
The orbital manoeuver model employs a variable-timing multi-impulse orbital manoeuver design. To mitigate the risk of the chasing satellite adopting a two-impulse strategy, where the first impulse concludes before the target executes an evasive manoeuver, resulting in the need for additional fuel to correct the orbit after the initial impulse, a multi-impulse orbital manoeuver approach is employed. The multi-impulse orbital manoeuver, after a certain degree of optimisation, generally results in a smaller first impulse compared to the first impulse of a two-impulse manoeuver. Subsequent orbital manoeuvers incur reduced fuel consumption. A representative three-impulse scenario is illustrated in Fig. 4.
-
(1) Coarse-grained OM
The three-impulse orbital manoeuver.
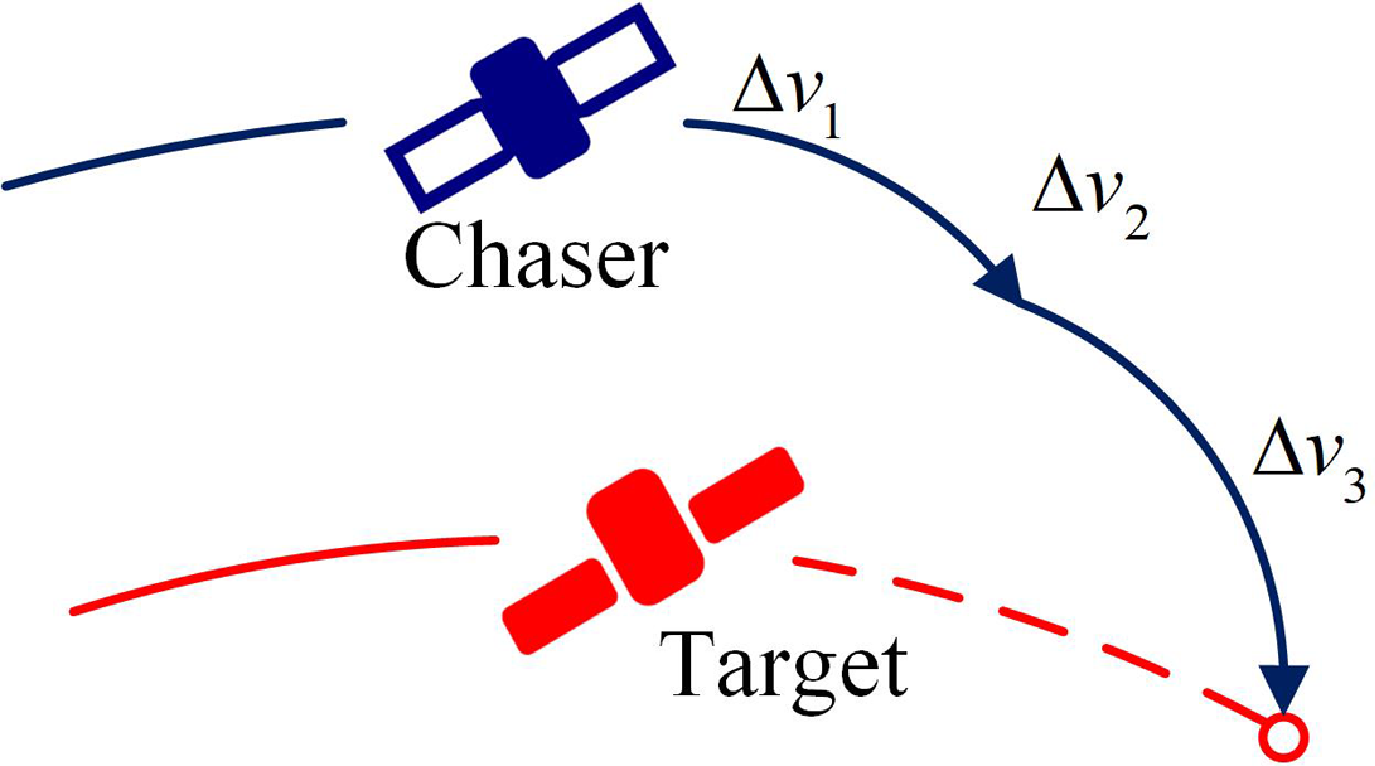
The numerical solution coarse optimisation granularity initially employs numerical approximation to calculate and obtain multiple pulse values, swiftly yielding usable initial values. Utilising the numerical solution as a starting point, a narrow-range optimisation is performed in the vicinity of the numerical solution. This approach involves fewer iterations and computational steps, resulting in the fastest computational speed. However, the optimisation effect on fuel consumption is comparatively worse, often converging to a local saddle point.
Using the orbit determination result
 ${X_{Det}}$
as the input parameter at time t0.
From the state transition matrix, the relationship between the position and velocity states at time t 0 and t f is given by:
 \begin{align}\left[ {\begin{array}{*{20}{c}}{{\boldsymbol{r}}({t_f})}\\[5pt] {{\dot{\boldsymbol{r}}}({t_f})}\end{array}} \right] = \left[ {\begin{array}{*{20}{c}}{{{\boldsymbol{\varPhi }}_{rr}}(\tau )} {}{{{\boldsymbol{\varPhi }}_{rv}}(\tau )}\\[5pt] {{{\boldsymbol{\varPhi }}_{vr}}(\tau )} {}{{{\boldsymbol{\varPhi }}_{vv}}(\tau )}\end{array}} \right]\left[ {\begin{array}{*{20}{c}}{{\boldsymbol{r}}({t_0})}\\[5pt] {{\dot{\boldsymbol{r}}}({t_0})}\end{array}} \right]\end{align}
The straight vector
 ${\boldsymbol\rho _{f,0}}$
from
 ${\boldsymbol{r}}({t_f})$
to
 ${\boldsymbol{r}}({t_0})$
represents the expected approach orbit. Let
 ${\boldsymbol{r}}(t)$
be the relative position vector of the satellite to the straight vector
 ${\boldsymbol\rho _{f,0}}$
at time t. Obviously,
 ${t_0} \le t \le {t_f}$
, and the boundary conditions for
 $\boldsymbol\rho (t)$
are:
 \begin{align}\left\{ \begin{array}{l}\boldsymbol\rho ({t_0}) = {\boldsymbol\rho _{f,0}}\\[5pt] \boldsymbol\rho ({t_f}) = 0\end{array} \right.\end{align}
Using N(N ≥ 3) velocity impulses, the chasing satellite moves from the initial position
 ${\boldsymbol{r}}({t_0})$
(i.e.,
 $\boldsymbol\rho ({t_0}) = {\boldsymbol\rho _{f,0}}$
) to the final position
 ${\boldsymbol{r}}({t_f})$
(i.e.,
 $\boldsymbol\rho ({t_f}) = 0$
) within the time T. The straight vector
 ${\boldsymbol\rho _{f,0}}$
is decomposed into N-1 equally spaced segments. A velocity impulse is applied at the beginning and end of each segment. The time interval between the two impulses in each segment is the same, i.e., Δt = T(N-1).
Positions along the manoeuvers at each instance from
 ${\boldsymbol\rho _{f,0}}$
:
 \begin{align}\Delta \boldsymbol\rho = \frac{{{\boldsymbol\rho _{f,0}}}}{{N - 1}}\end{align}
For the kth impulse,
 \begin{align}\begin{array}{l}{\boldsymbol{r}}({t_{k - 1}}) = {\boldsymbol{r}}({t_f}) + {\boldsymbol\rho _{f,k - 1}}\\[5pt] {\boldsymbol{r}}({t_k}) = {\boldsymbol{r}}({t_f}) + {\boldsymbol\rho _{f,k}}\end{array}\end{align}
The initial velocity after the kth manoeuver can be obtained.
 \begin{align}{\dot{\boldsymbol{r}}}(t_{k - 1}^ + ) = {G_{rr}}{\boldsymbol{r}}({t_{k - 1}}) + {G_{rv}}{\boldsymbol{r}}({t_k})\end{align}
Similarly, the final velocity before the kth manoeuver.
 \begin{align}{\dot{\boldsymbol{r}}}(t_{k - 1}^ - ) = {G_{vr}}{\boldsymbol{r}}({t_{k - 2}}) + {G_{vv}}{\boldsymbol{r}}({t_{k - 1}})\end{align}
where:
 \begin{align}\begin{array}{l}{G_{rr}} = - {\boldsymbol{\varPhi }}_{rv}^{ - 1}(T){{\boldsymbol{\varPhi }}_{rr}}(T),\quad \quad \quad \quad \quad \quad {G_{rv}} = {\boldsymbol{\varPhi }}_{rv}^{ - 1}(T)\\[5pt] {G_{vr}} = {{\boldsymbol{\varPhi }}_{vr}}(T) - {{\boldsymbol{\varPhi }}_{vv}}(T){\boldsymbol{\varPhi }}_{rv}^{ - 1}(T){{\boldsymbol{\varPhi }}_{rr}}(T),\quad {G_{vv}} = {{\boldsymbol{\varPhi }}_{vv}}(T){\boldsymbol{\varPhi }}_{rv}^{ - 1}(T)\end{array}\end{align}
The velocity increment required for the kth impulse is
 \begin{align}{\boldsymbol{v}_{k,k - 1}} = {\dot{\boldsymbol{r}}}(t_{k - 1}^ + ) - {\dot{\boldsymbol{r}}}(t_{k - 1}^ - )\end{align}
-
(2) Medium-grained OM
At the medium-grained level, particle swarm optimisation [Reference Marini and Walczak18] is used for the solution. In this granularity, a smaller number of particles, a smaller upper limit of iteration count, and a larger iteration termination error are employed. The optimisation effect is better, but the calculation time is longer compared to coarse-grained.
Using the sum of N impulse velocity increments as the optimisation objective.
 \begin{align}J = \sum\limits_{i = 1}^N {|\Delta {v_i}|} \end{align}
From Equation 34, the fuel optimisation function is constructed and expressed as follows:
 \begin{align} &\textrm{min}\; J = \sum\limits_{i = 1}^N {|\Delta {v_i}|}\nonumber \\[5pt] &s.t.\nonumber \\[5pt] &\quad \left\{ \begin{array}{l@{\quad}l}{t_0} \le {t_i} \le {t_0} + T, & i = 1 \cdots N\\[5pt] {t_i} \le {t_j}, & i \lt j\\[5pt] |\Delta {v_i}| \geqslant 0, & i = 1 \cdots N - 2\end{array} \right.\end{align}
The optimisation variables for the multi-pulse orbital manoeuver problem are the pulse moments for each pulse. Given the intricate nature of the constraints, the particle swarm optimisation algorithm can effectively solve the global optimal solution.
-
(3) Fine-grained OM
At the fine-grained level, using a larger number of particles, a larger upper limit of iteration count and a smaller iteration termination error for global optimisation results in the best fuel optimisation effect. However, the corresponding computation time is the longest.
3.3 Multi-granularity onboard decision module
In this section, manoeuvering game strategies were designed for the chasing satellite using a multi-granularity observation model. Simultaneously, corresponding manoeuvering game strategies were also designed for the target satellite that did not adopt a multi-granularity observation model. The orbital manoeuver strategies for the chaser and target are illustrated in Fig. 5.
The orbital manoeuver strategies for the chaser and target.

The multi-granularity game process for the chasing satellite is outlined as follows:
-
(1) Selects an appropriate orbit determination granularity for determining the orbit of the target. Refers to the orbit determination model in Section 3.1 and proceeds to step (2).
-
(2) The orbit determination results from (1) are used to calculate the minimum distance between the target and the asset
$\boldsymbol{d}_{minTargetToAsset}$
, as well as the time to reach the minimum distance
$\boldsymbol{t}_{minDisCha}$
. Proceed to step (3). -
(3) Check whether the minimum distance between the target and the asset is less than the threat distance of the asset
$\boldsymbol{d}_{TreatAsset}$
. If true, proceed to step (4). -
(4) If the minimum distance between the target and the asset is less than the threat distance of the asset, the chaser selects an appropriate orbit manoeuver granularity to calculate the orbit manoeuver impulse for approaching the target. It also stores the orbit determination parameters, time of reaching the minimum distance, manoeuver time and manoeuver components. Proceed to step (5).
If the minimum distance between the target and the asset is greater than the threat distance of the asset, return to step (1) to re-determine the orbit for the target.
-
(5) Check whether the manuoeuver time has been reached based on the stored manoeuver time. If the recorded time has been reached, execute the corresponding impulse manoeuver. If the manoeuver time has not been reached, proceed to step (6).
-
(6) Continues to select an appropriate granularity to determine the orbit of the target. Both the current orbit determination result and the stored previous orbit determination result are propagated to the stored time of reaching the minimum distance. Compares the propagated results of the two orbit determinations, denoted as
$\boldsymbol{d}_{LastTarToAssTerminal}$
and
$\boldsymbol{d}_{TarToAssTerminal}$
.If the difference is less than the set manoeuver detection threshold, it is considered that the target has not made an avoidance manoeuver. Return to step (6) to re-determine the orbit of the target. If the difference is greater than the set manoeuver detection threshold, it is considered that the target has made an avoidance manoeuver. Proceed to step (7).
-
(7) Further checks whether the propagated result of the current orbit determination is less than the threat distance of the asset. If the result is less than the threat distance, it is considered that the target has manoeuvered and has not changed its threat intent. Clears the stored minimum distance, time of reaching the minimum distance, manoeuver time, and manoeuver components. Return to step (1) to re-determine the orbit for the target and recalculate the minimum distance and time of reaching the minimum distance.
If the result is greater than the threat distance of the asset, it is considered that the target has manoeuvered, but the end position does not pose a threat to the asset. There are two possibilities: either the target has abandoned the mission of threatening the asset, or the target executes the initial pulses of a multi-pulse orbit manoeuver and is on a transitional orbit where the threat cannot be determined. In either case, the target intended to threaten the asset. Therefore, the chasing satellite adopts a strategy of approaching the asset for both possibilities. Simultaneously, it selects an appropriate orbit manoeuver granularity, solves and stores the manoeuver time and impulse components. Proceed to step (5).




The orbital game process for the target is as follows:
The target does not have multi-granularity computing capability. As referenced in Section 3.1, the orbit determination model fixedly selects one of the granularities, and the orbit manoeuver model, as referenced in Section 3.2 Multi-granularity onboard impulse orbit manoeuver model, fixedly selects one.
-
(1) Selects an appropriate orbit determination granularity for determining the orbit of the target. Refers to the orbit determination model in Section 3.1 and proceeds to step (2).
-
(2) The target determines its orbit as the chaser and proceeds to step (3).
-
(3) Based on the orbit determination results from (2), solve for the minimum distance between the chaser and the target
$\boldsymbol{d}_{minChaserToTarget}$
, as well as the time to reach the minimum distance, and proceed to step (4). -
(4) If the minimum distance between the chaser and the target is less than the threat distance of the target, proceed to step (5).
-
(5) If the minimum distance between the chaser and the target is less than the threat distance of the target, the target uses a fixed granularity for orbit determination to calculate the orbital manoeuver pulse to evade the chaser. Additionally, store the orbit determination parameters, time of reaching the minimum distance, manoeuver time, and manoeuver components. Proceed to step (6). If the minimum distance exceeds the threat distance, go back to step (1) and re-determine the orbit for the chaser.
In this process, the target’s evasion manoeuver is depicted in Fig. 6. The chaser floats past the target at the minimum distance, dividing the circle with the target as the centre and the target threat distance as the radius into two halves: one containing the minimum distance and the other without. The target moves towards the half-circle without the minimum distance by a distance equal to the target threat distance. The target must ensure it stays within the threat distance of the asset satellite. In this plan, the target performs a small-distance pulse manoeuver.
-
(6) Check whether the manoeuver time has been reached based on the stored manoeuver time. If the recorded time has been reached, execute the corresponding impulse manoeuver. If the manoeuver time has not been reached, proceed to step (2).

The target’s evasion manoeuver.
The orbit determination algorithm and the orbit manoeuver algorithm adopt an iterative optimisation method. The initial iteration value and direction are stochastic. Therefore, when the algorithm jumps out of the iteration, the number of cycles is not necessarily the same, resulting in uncertainty in the decision-making time cost of the multi-granularity observation model. The output of the orbit determination algorithm is the relative position vector and the relative velocity vector at the end of the orbit determination. An input of the orbit manoeuver algorithm is to allow the manoeuver time of the first pulse. If the actual decision end time exceeds the calculated first pulse manoeuver time due to uncertainty, the first pulse cannot be applied as planned and needs to be recalculated, even leading to mission failure.
Chaser employing the Absolute Robust Criterion follows the decision-making steps outlined below:
-
(1) Determine the set of potential scenarios for statistical uncertainty variables.
-
(2) Identify the set of viable options.
-
(3) Compute the benefits or costs for each feasible option under each potential scenario.
-
(4) Determine the minimum benefit or maximum cost for each option along with its corresponding worst-case scenario. In this context, the benefits or costs associated with each option represent the decision time cost, so calculate the maximum cost for each option.
-
(5) Compare the costs under the worst-case scenarios for each option and identify the option with the minimum cost.
In the context of the uncertainty problem associated with the decision time cost for the same decision granularity scheme in this section, the Absolute Robust Criterion method is applied. This involves statistically analysing the actual decision time costs for each scheme under different conditions. The maximum decision time cost across all conditions is then used as the basis for both scheme selection and execution.
In the context of the space dynamic target tracking game considered in this paper, there is inherent uncertainty in the parameters used for each orbit determination, leading to uncertainties in the observed orbit determination errors. As the distance between the chaser and the target diminishes, the spatial scale corresponding to the one-pixel unit decreases gradually. The positional errors caused by pixel units will reduce from the meter level to the centimeter level. To address such dynamic uncertainties, the paper introduces the concept of sequential three-way decision-making.
This section establishes a sequential three-way decision granularity selection method framework for the space dynamic target pursuit-evasion game, as illustrated in Fig. 7.
The sequential three-way decision granularity selection method framework.

The framework relies on the multi-level granularity structure defined earlier, which is divided into coarse-grained, medium-grained and fine-grained layers. Each layer utilises three-way decisions to partition the gaming scenarios into three categories. The decision to move to the next granularity layer is based on the requirements of the gaming scenario. Each layer is divided into three regions: positive, negative and boundary. The positive and negative regions adopt acceptance and rejection strategy schemes, respectively. The boundary region employs a delay decision strategy to gather more information to further support decision-making.
Let
 $g(S)$
be the relative orbit determination algorithm for each granularity layer, encompassing two outputs, denoted as
 ${g_1}(S),{g_2}(S)$
.
 $h(S)$
represents the pulse orbital manoeuver algorithm for each granularity layer.
 \begin{align}\begin{array}{l}{g_1}(S) = {\boldsymbol{d}_{ChaserToTarget}}\\[5pt] {g_2}(S) = {\boldsymbol{d}_{minTargetToAsset}}\\[5pt] h(S) = \boldsymbol{J}\end{array}\end{align}
-
(1) Firstly, for each granularity selection problem, enter the coarse-grained layer initially:
In the coarse-grained layer, divide the solution space
${\textbf{U}_{Coarse}}$
into three regions
${\textbf{R}_{Coarse, POS}}, {\textbf{R}_{Coarse, BND}}, {\textbf{R}_{Coarse, NEG}}$
using the boundary region threshold
${\boldsymbol\alpha _{Coarse}}$
, positive and negative region thresholds
${\boldsymbol\beta _{Coarse}}$
, and evaluation function
${g_{Coarse}}(S),{h_{Coarse}}(S)$
:For the OD process, coarse-grained models are used for calculations. Given a coarse-grained distance threshold to divide the positive and negative regions and the boundary region, when the distance between the chaser and target is less than the coarse-grained distance threshold
${\boldsymbol\alpha _{CoarseOD}}$
, it is classified into the coarse-grained layer’s boundary region, and the decision is delayed. When
${\boldsymbol{d}_{ChaserToTarget}}$
is greater than
${\boldsymbol\alpha _{CoarseOD}}$
, it is classified into the positive or negative region based on the calculation results. If the minimum distance
${\boldsymbol{d}_{minTargetToProperty}}$
obtained from the orbit determination is less than the threat distance to the asset
${\boldsymbol{d}_{TreatProperty}}$
, it is classified into the positive region. If
${\boldsymbol{d}_{minTargetToProperty}}$
is greater than
${\boldsymbol{d}_{TreatProperty}}$
it is classified into the negative region.(38)
\begin{align}\begin{array}{l}\left\{ \begin{array}{l}{\textbf{R}_{Coarse OD, POS}} = \{ S \in {\textbf{U}_{CoarseOD}}|{g_1}(S) \leq {\boldsymbol\alpha _{CoarseOD}}\;,\;{g_2}(S) \le {\boldsymbol\beta _{CoarseOD}}\} \\[5pt] {\textbf{R}_{Coarse OD, BND}} = \{ S \in {\textbf{U}_{CoarseOD}}|{g_1}(S) \gt {\boldsymbol\alpha _{CoarseOD}}\} \\[5pt] {\textbf{R}_{Coarse OD, NEG}} = \{ S \in {\textbf{U}_{CoarseOD}}|{g_1}(S) \leq {\boldsymbol\alpha _{CoarseOD}}\;,\;{g_2}(S) \gt {\boldsymbol\beta _{CoarseOD}}\} \end{array} \right.\\[5pt] \left\{ \begin{array}{l}{\textbf{R}_{Coarse OM, POS}}\,\, = \{ S \in {\textbf{U}_{CoarseOM}}|{g_1}(S) \leq {\boldsymbol\alpha _{CoarseOM}}\;,\;h(S) \le {\boldsymbol\beta _{CoarseOM}}\} \\[5pt] {\textbf{R}_{Coarse OM, BND}} = \{ S \in {\textbf{U}_{CoarseOM}}|{g_1}(S) \gt {\boldsymbol\alpha _{CoarseOM}}\} \\[5pt] {\textbf{R}_{Coarse OM, NEG}} = \{ S \in {\textbf{U}_{CoarseOM}}|{g_1}(S) \leq {\boldsymbol\alpha _{CoarseOM}}\;,\;h(S) \gt {\boldsymbol\beta _{CoarseOM}}\} \end{array} \right.\end{array}\end{align}
For the OM process, if
${\boldsymbol{d}_{ChaserToTarget}}$
is less than
${\boldsymbol\alpha _{CoarseOM}}$
, it is classified into the boundary region of the coarse-grained layer, and the decision is delayed. For fuel solving in orbit manoeuver, if the fuel consumption J is less than the remaining fuel upper limit for the chaser, it is classified into the positive region. If J is greater than the remaining fuel upper limit, it is classified into the negative region.According to the three-decision rule, the following three decision rules are obtained:
If classified into the positive region, take action to accept the calculation results of this granularity layer.
If classified into the boundary region, take action to acquire more observation information and enter the next granularity layer for calculation.
If classified into the negative region, take action to reject the calculation results of this granularity layer, obtain observation information again, and enter the current granularity layer for calculation.
-
(2) Enter the medium-grained layer for the problem classified into the boundary region of the coarse-grained layer in the previous layer:
Similar to the logic of the coarse-grained layer, For the OD process,
(39)
\begin{align}\left\{ \begin{array}{l}{\textbf{R}_{Medium OD, POS}} = \{ S \in {\textbf{U}_{MediumOD}}|{g_1}(S) \leq {\boldsymbol\alpha _{MediumOD}}\;,\;{g_2}(S) \le {\boldsymbol\beta _{MediumOD}}\} \\[5pt] {\textbf{R}_{Medium OD, BND}} = \{ S \in {\textbf{U}_{MediumOD}}|{g_1}(S) \gt {\boldsymbol\alpha _{MediumOD}}\} \\[5pt] {\textbf{R}_{Medium OD, NEG}} = \{ S \in {\textbf{U}_{MediumOD}}|{g_1}(S) \leq {\boldsymbol\alpha _{MediumOD}}\;,\;{g_2}(S) \gt {\boldsymbol\beta _{MediumOD}}\} \end{array} \right.\end{align}
For the OM process,
(40)
\begin{align}\left\{ \begin{array}{l}{\textbf{R}_{Medium OM, POS}}\,\, = \{ S \in {\textbf{U}_{MediumOM}}|{g_1}(S) \leq {\boldsymbol\alpha _{MediumOM}}\;,\;h(S) \le {\boldsymbol\beta _{MediumOM}}\} \\[5pt] {\textbf{R}_{Medium OM, BND}} = \{ S \in {\textbf{U}_{MediumOM}}|{g_1}(S) \gt {\boldsymbol\alpha _{MediumOM}}\} \\[5pt] {\textbf{R}_{Medium OM, NEG}} = \{ S \in {\textbf{U}_{MediumOM}}|{g_1}(S) \leq {\boldsymbol\alpha _{MediumOM}}\;,\;h(S) \gt {\boldsymbol\beta _{MediumOM}}\} \end{array} \right.\end{align}
-
(3) Enter the fine-grained layer for the problem classified into the boundary region of the medium-grained layer in the previous layer:
The fine-grained layer is the bottom layer of the sequential three-decision method and does not further partition the boundary region.
For the OD process,
(41)
\begin{align}\left\{ \begin{array}{l}{\textbf{R}_{Fine OD, POS}}\,\, = \{ S \in {\textbf{U}_{FineOD}}|\;{g_2}(S) \le {\boldsymbol\beta _{FineOD}}\} \\[5pt] {\textbf{R}_{Fine OD, NEG}} = \{ S \in {\textbf{U}_{FineOD}}|\;{g_2}(S) \gt {\boldsymbol\beta _{FineOD}}\} \end{array} \right.\end{align}
For the OM process,
(42)
\begin{align}\left\{ \begin{array}{l}{\textbf{R}_{Fine OM, POS}}\,\, = \{ S \in {\textbf{U}_{FineOM}}|\;h(S) \le {\boldsymbol\beta _{FineOM}}\} \\[5pt] {\textbf{R}_{Fine OM, NEG}} = \{ S \in {\textbf{U}_{FineOM}}|h(S) \gt {\boldsymbol\beta _{FineOM}}\} \end{array} \right.\end{align}
-
(4) If there is only one round of decision-making, the process of gradually refining the solution from the coarse-grained layer to the fine-grained layer is unquestionable. This stepwise abstraction of the problem aligns with the natural thought process of human problem-solving. However, the game problem considered in this section involves multiple rounds of interaction between the two parties. It requires making decisions on granularity selection multiple times. If, during each decision-making iteration, the process iterates from coarse-grained to fine-grained, the computational burden associated with the sequential three-way decision-making, particularly as the number of decision rounds and the granularity layer divisions increase, becomes significantly pronounced.







Therefore, in the multi-round iterative decision-making process considered in this section, a decision-making approach that inherits prior knowledge is adopted. Once a granularity layer has been evaluated in a previous iteration, it is not reassessed from the coarsest-grained layer in the subsequent iteration. In the same gaming scenario, the granularity layer accepted in the previous round serves as the starting point for the next round. For instance, if the medium-grained layer was accepted in the previous round, the next round can directly start the division from the medium-grained, eliminating the need to solve and assess from the coarse-grained again.
4.0 Results and discussions
This chapter conducts single-time simulations and Monte Carlo batch simulations to compare the multi-granularity decision-making method proposed in this paper with single-granularity and random-granularity methods. Additionally, the selection of parameters used in the proposed method is discussed in the latter part of this chapter.
4.1 Orbit game single simulation comparison
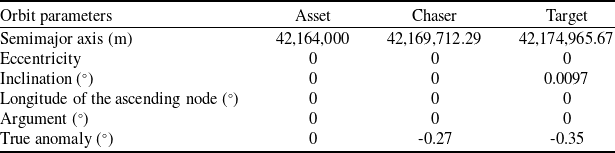
The initial orbit parameters for the asset, chaser and target are given in Table 1. Additionally, the target is configured to plan a close-proximity orbit manoeuver towards the asset satellite at 0s.
Single orbit game simulation satellite orbit parameters
The game results under different methods are shown in Table 2.
The game results under different methods

Table 2 and Fig. 8 compares the results of the multi-granularity decision-making method proposed in this paper with the single-granularity and random-granularity orbital pursuit-evasion results. The distance variation curves between the chaser, target and the asset are depicted. The solid red line represents the temporal evolution of the relative distance between the chaser and the target, while the dashed green line illustrates the relative distance variation between the target and the asset. The solid red line in the figure represents the temporal evolution of the relative distance between the chaser and the target, while the dashed green line illustrates the relative distance variation between the target and the asset.
Relative distance variation curves between chaser, target and asset under different methods. (a) Multi-granularity decision-making method. (b) Coarse-grained method. (c) Medium-grained method. (d) Fine-grained method. (e) Random-granularity method.
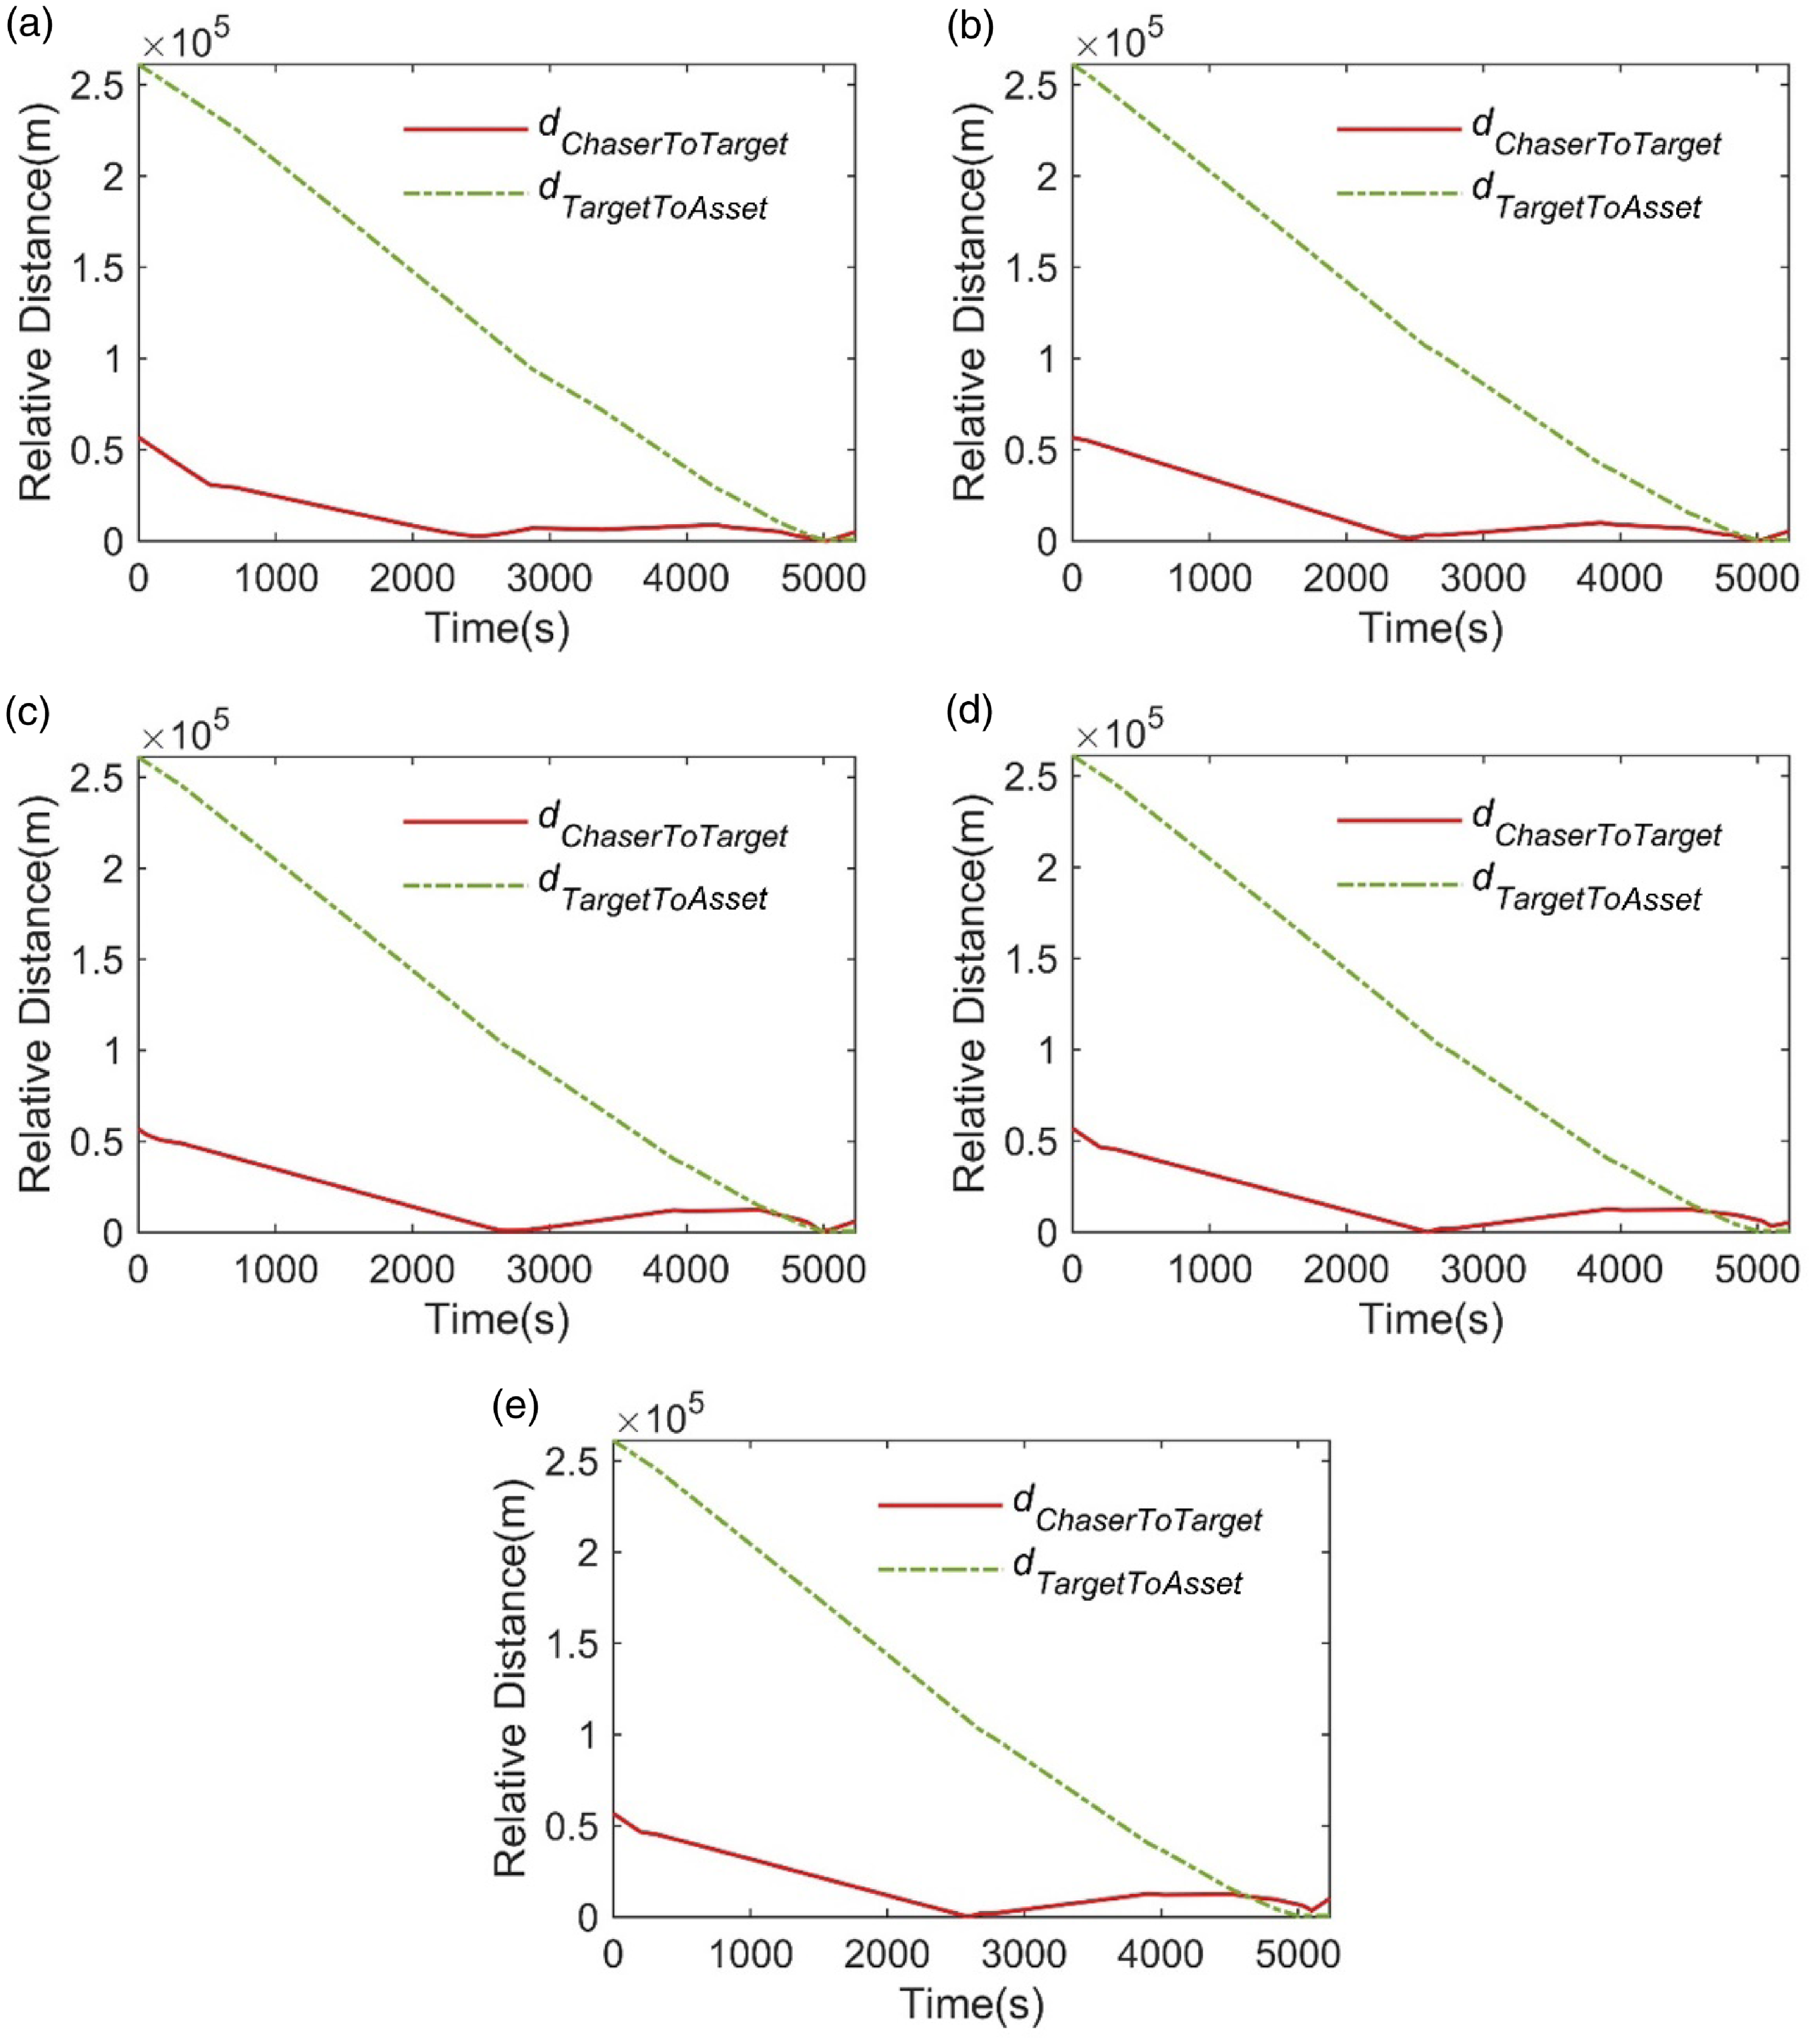
Figure 8(a) shows that, under the multi-granularity decision-making method, the chaser executes two significant thrust manoeuvers around 400s and 2500s. These manoeuvers effectively reduce the relative distance between the chaser and the target. From 2500s to 5000s, it is evident that the target engages in continuous evasion manoeuvers after the chaser’s initial approach. However, the chaser responds promptly after the target widens the gap. It identifies the target’s escape attempts and conducts multiple rounds of OD and OM, ultimately converging to the minimum distance at the terminal position. As a result, the chaser achieves victory in the game.
The comparison between Fig. 8(a-d) shows that as the granularity of the single-granularity method refines, the terminal relative distance between the chaser and the target grows larger over the course of the game. Additionally, in Fig. 8(d) and (e), the green dashed line is to the left of the red solid line during the terminal phase. This indicates that the target approaches the asset before the chaser approaches the target, achieving the desired game state earlier than the chaser by the end of the game.
The three-dimensional orbit plot of the relative position between the chaser and target under the multi-granularity decision method proposed in this paper is shown in Fig. 9. The asterisk (*) represents the target position. Despite the continuous evasion of the target, the chaser can still approach the target for observation as expected by the decision, demonstrating the feasibility of the multi-granularity decision method proposed in this paper.
The relative position change curve of chaser and target under the multi-granularity method.

This paper’s multi-granularity decision-making approach outperforms the other four methods in both minimum distance and total velocity increment. Regarding minimum distance, the multi-granularity method is 92% better than the coarse-grained method, 94% better than the medium-grained method, 98% better than the fine-grained method, and 98% better than the random-grained method. Regarding fuel consumption, the multi-granularity method is 15% better than the coarse-grained method, 36% better than the medium-grained method, 14% better than the fine-grained method, and 44% better than the random-grained method.
4.2 Monte Carlo experiments
This section presents a Monte Carlo analysis comparing the multi-granularity decision-making method with scenarios involving coarse-grained, medium-grained, fine-grained, and randomly selected granularity models. The analysis aims to evaluate the gaming capabilities of each method under different random conditions and their adaptability to various scenarios. A total of 400 scenarios were randomly generated using the Monte Carlo method. Simulations were conducted 2,000 times, considering the asset located on a circular orbit with a semi-major axis of 42,164km and an orbital inclination of 0°.
The initial relative position states between the target and asset in the inertial coordinate system are shown in Fig. 10(a). The value range of the x-direction component is 6km, the value range of the y-direction is 120km, and the value range of the z-direction is 400m. A total of 400 points were randomly generated to represent the initial state parameters of the target. Due to significant fuel consumption associated with manoeuvers that substantially change the orbit’s inclination, this section does not consider conditions where the z-direction has a considerable impact on the orbit inclination in the sampled points.
The initial relative position states. (a) Between the target and asset (b) Between the chaser and asset.

Additionally, the initial relative position states between the chaser and asset in the inertial coordinate system are shown in Fig. 10(b). The value range of the x-direction component is 4km, the value range of the y-direction is 40km, and the value range of the z-direction is 40m. A total of 400 points were randomly generated to represent the initial state parameters of the chaser.
The batch processing results of the minimum distance between the chaser and target under different granularity selection methods are shown in Fig. 11.
The batch processing results of the minimum distance between the chaser and target.
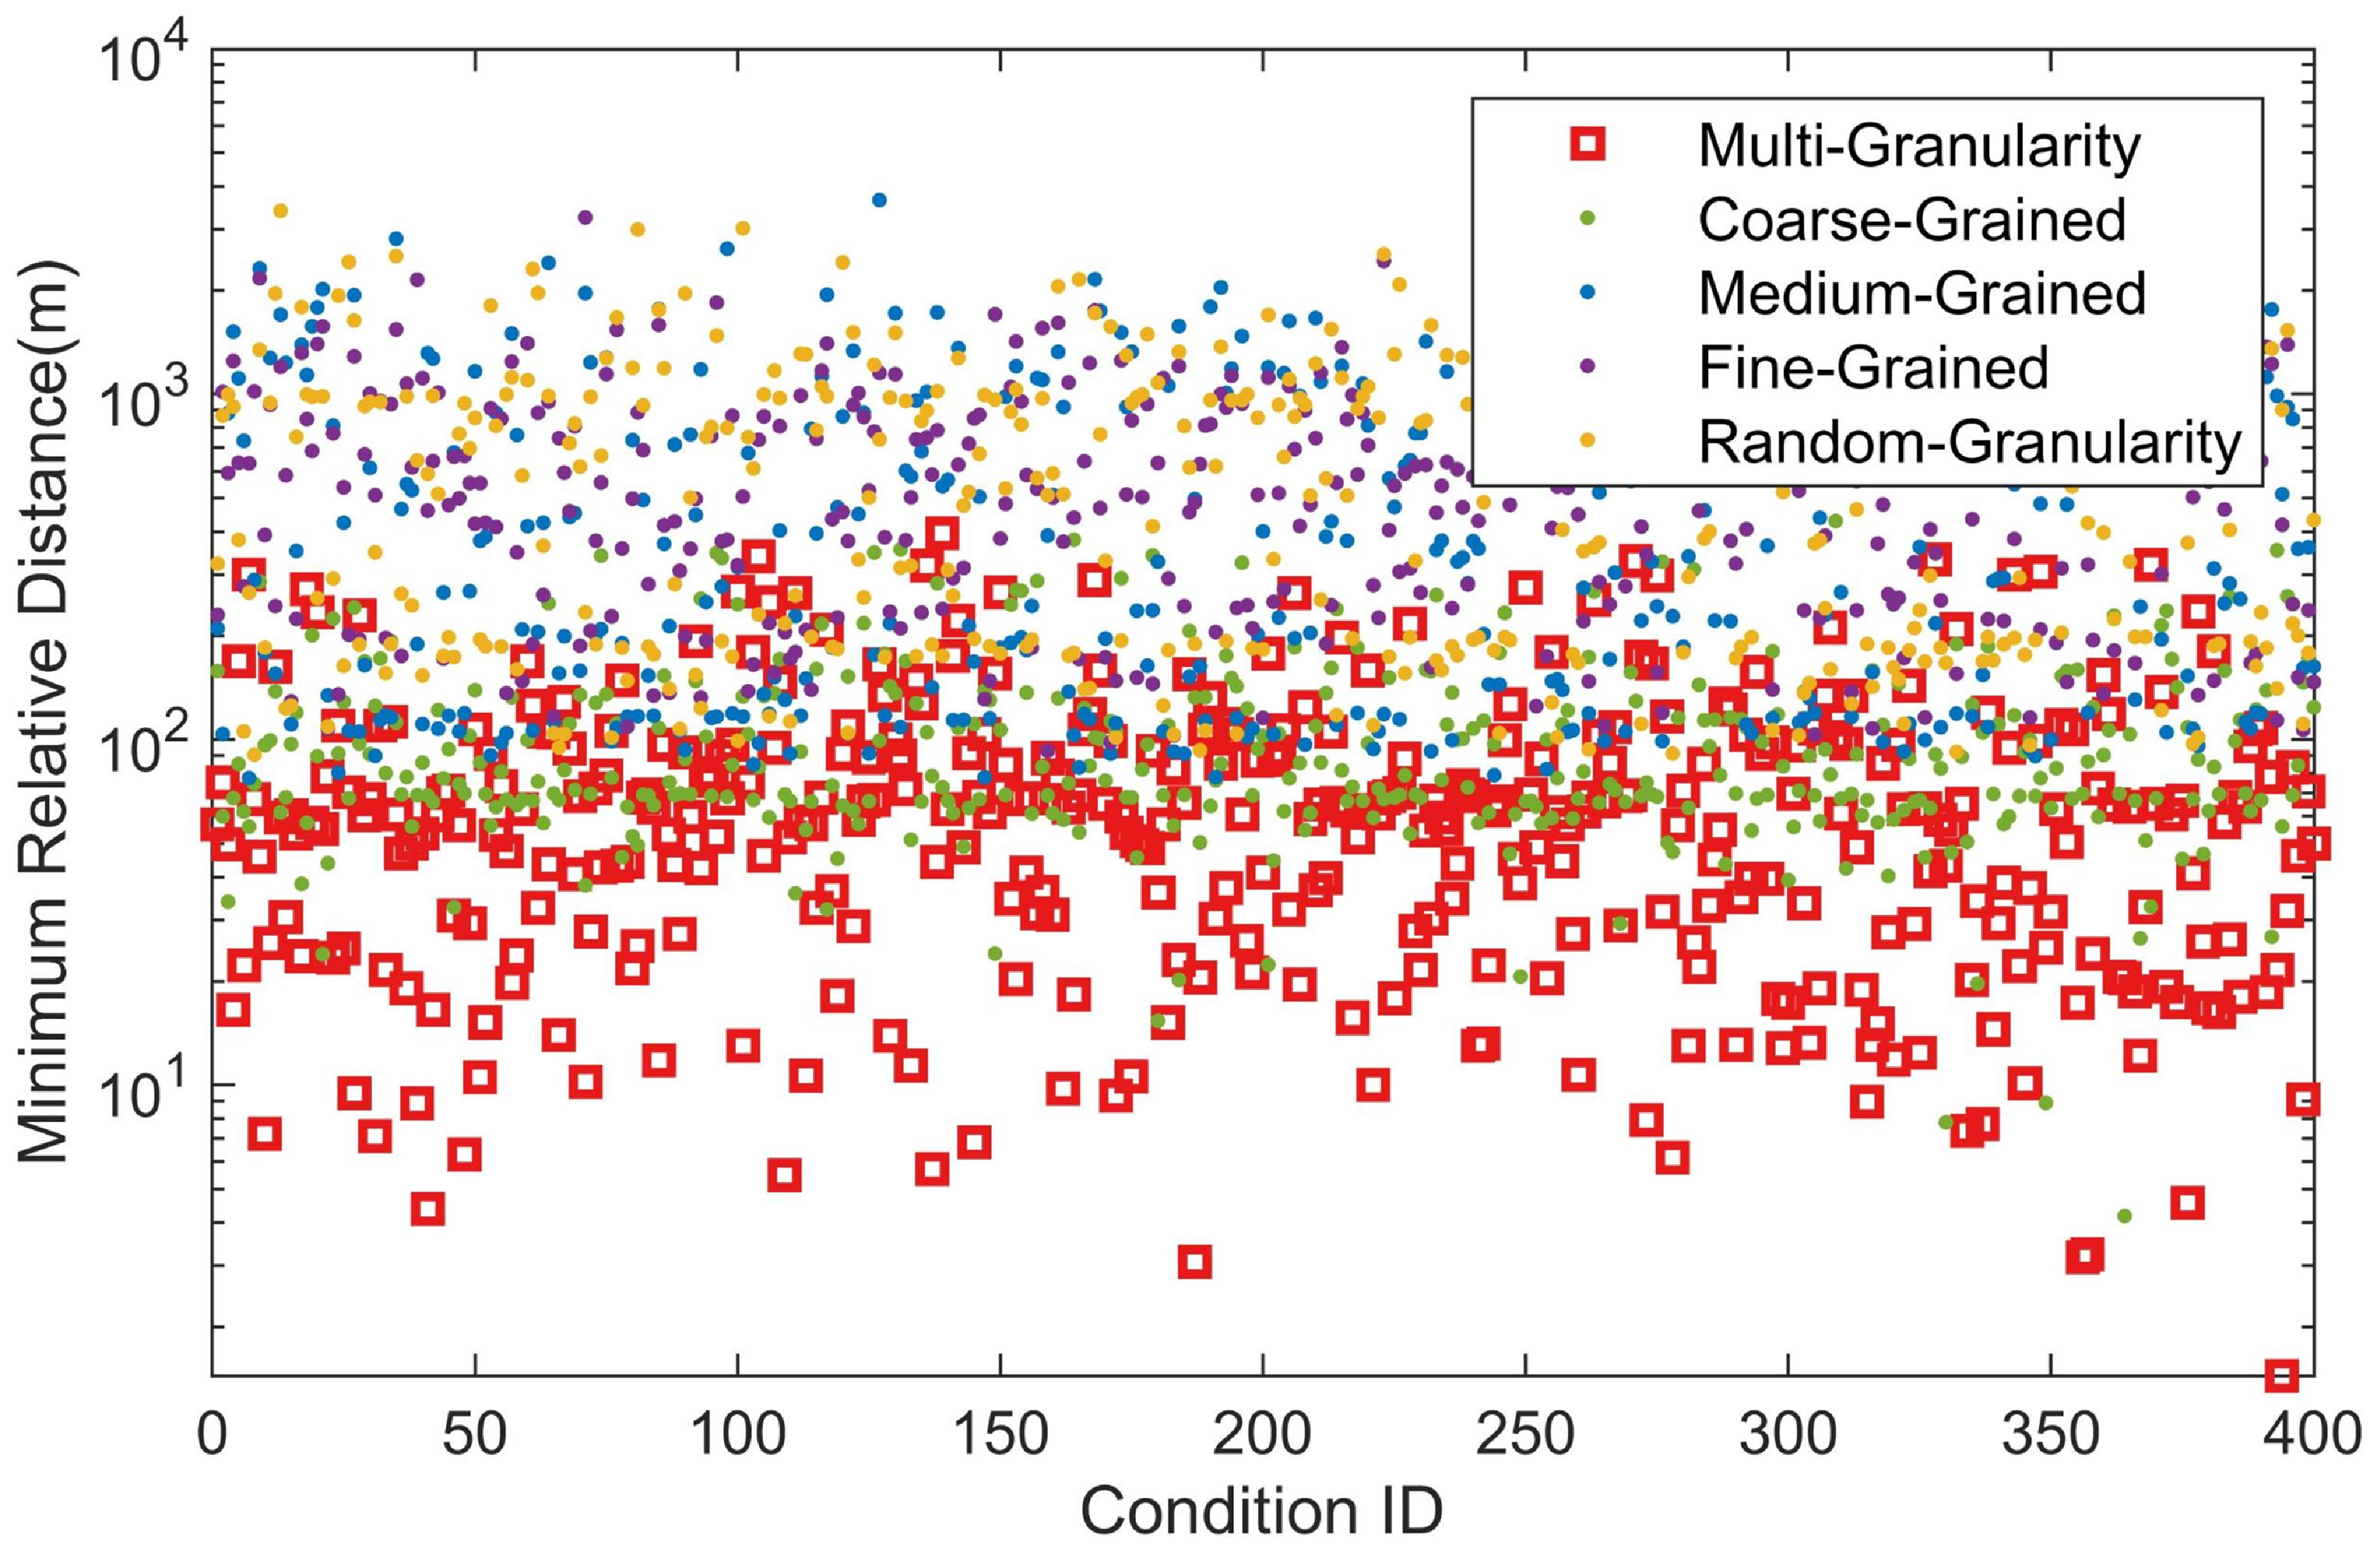
The red squares represent the minimum observed relative distance between the chaser and target using the multi-granularity decision-making method proposed in this paper. The red squares of the multi-granularity selection method are at the bottom, indicating that the minimum relative distance is mostly within 100m. The next is using coarse-grained observation model methods, which are mostly in the range of 10–120m. However, most of the methods using medium-grained observation model, methods using fine-grained observation model, and random selection of granularity model methods mostly exceed 100m, and even in some scenarios, it exceeds 1,000m, indicating that in these scenarios, the chaser failed to complete the game task of approaching the target for observation.
The main reason for the failure of the task in the above scenarios is the different computational time costs of the relative orbit determination algorithm models at different granularities. Due to the influence of optical camera resolution and laser ranging accuracy, the error between the measured relative distance parameters used for relative orbit determination and the true relative distance decreases as the distance between the chaser and the target decreases. The accuracy of the relative orbit determination algorithm gradually increases with the increase of granularity. In the final stage of the game, the accuracy of the measurement parameters improves, and the granularity of the algorithm has little impact on the orbit determination results. However, the increase in granularity will significantly increase the computational time cost of orbit determination. It is found that at least one orbit determination is required for the target to make an evasive action. Re-determining the orbit for the target requires another orbit determination. The fine-grained orbit determination algorithm wastes much computation time in the late stage. If a fine-grained orbit determination algorithm is selected at this time, it is very likely that the target has completed two orbit manoeuvers while the chaser is still in the calculation process, ultimately leading to the failure of the game for methods using the medium-grained model, methods using the fine-grained model, and random selection of granularity model methods.
The coarse-grained and the multi-granularity methods have similar results in the minimum distance at the end, but the latter is superior. This is mainly because in the final round of calculation in the game if the second pulse of the chaser’s three-pulse orbit manoeuver algorithm converges to the vicinity of the third pulse, the target cannot timely avoid after the chaser applies the second pulse. In this round of calculation, if the chaser can choose the medium-grained orbit determination algorithm, the accuracy of the relative distance at the end will be better than that of the coarse-grained. The sequential three-branch decision-making granularity selection method based on the measured distance, can select the granularity of the relative orbit determination algorithm, ensuring the accuracy of orbit determination in the early stage of the game and meeting the timeliness requirements in the later stage. The granularity selection method proposed in this paper can meet the accuracy and timeliness requirements of the entire flight process.
Under different granularity selection methods, the batch results for the required velocity increments for chaser orbit manoeuvers are shown in Fig. 12. The red squares are generally located at the bottom of all line types, indicating that the multi-granularity decision-making method proposed in this paper can still ensure a good fuel optimisation effect under various working conditions. The velocity increment values generated by orbit manoeuvers for each condition are mostly maintained in the range of 50–80m/s. The methods using coarse-grained and those using medium-grained follow, maintaining values in the range of 70–110m/s. However, the adaptability of the method using medium-grained is relatively worse for batch conditions, as reflected in the figure by instances where the method using medium-grained has values exceeding 150m/s in certain conditions. The methods using fine-grained and randomly selecting granularity for each decision perform the worst in terms of fuel optimisation, with velocity increments exceeding 150m/s in most conditions, and even cases where velocity increments exceed 200m/s.
The batch results for the required velocity increments for chaser orbit manoeuvers.

In Fig. 12, using the fine-grained model method in the late stage of flight results in a significant amount of fuel consumption, leading to an increase in velocity increment for the conditions. If the random granularity model method randomly selects the fine-grained model in the late stage of flight, it will also lead to an increase in velocity increment for the conditions. The coarse-grained model has poor optimisation performance, and using the coarse-grained model method accumulates a significant amount of fuel consumption in the early stage of flight. The multi-granularity selection method of the sequential three-branch decision-making proposed in this paper aligns with the practical rules mentioned above. It optimises the orbit manoeuver using the fine-grained model in scenarios where longer flight time is allowed and not urgent, and uses the coarse-grained model with the least computation time cost to compute the orbit manoeuver parameters in scenarios where shorter flight time is allowed and urgent. This granularity selection method in this paper can meet the fuel optimisation and effectiveness requirements for various levels of threat urgency.
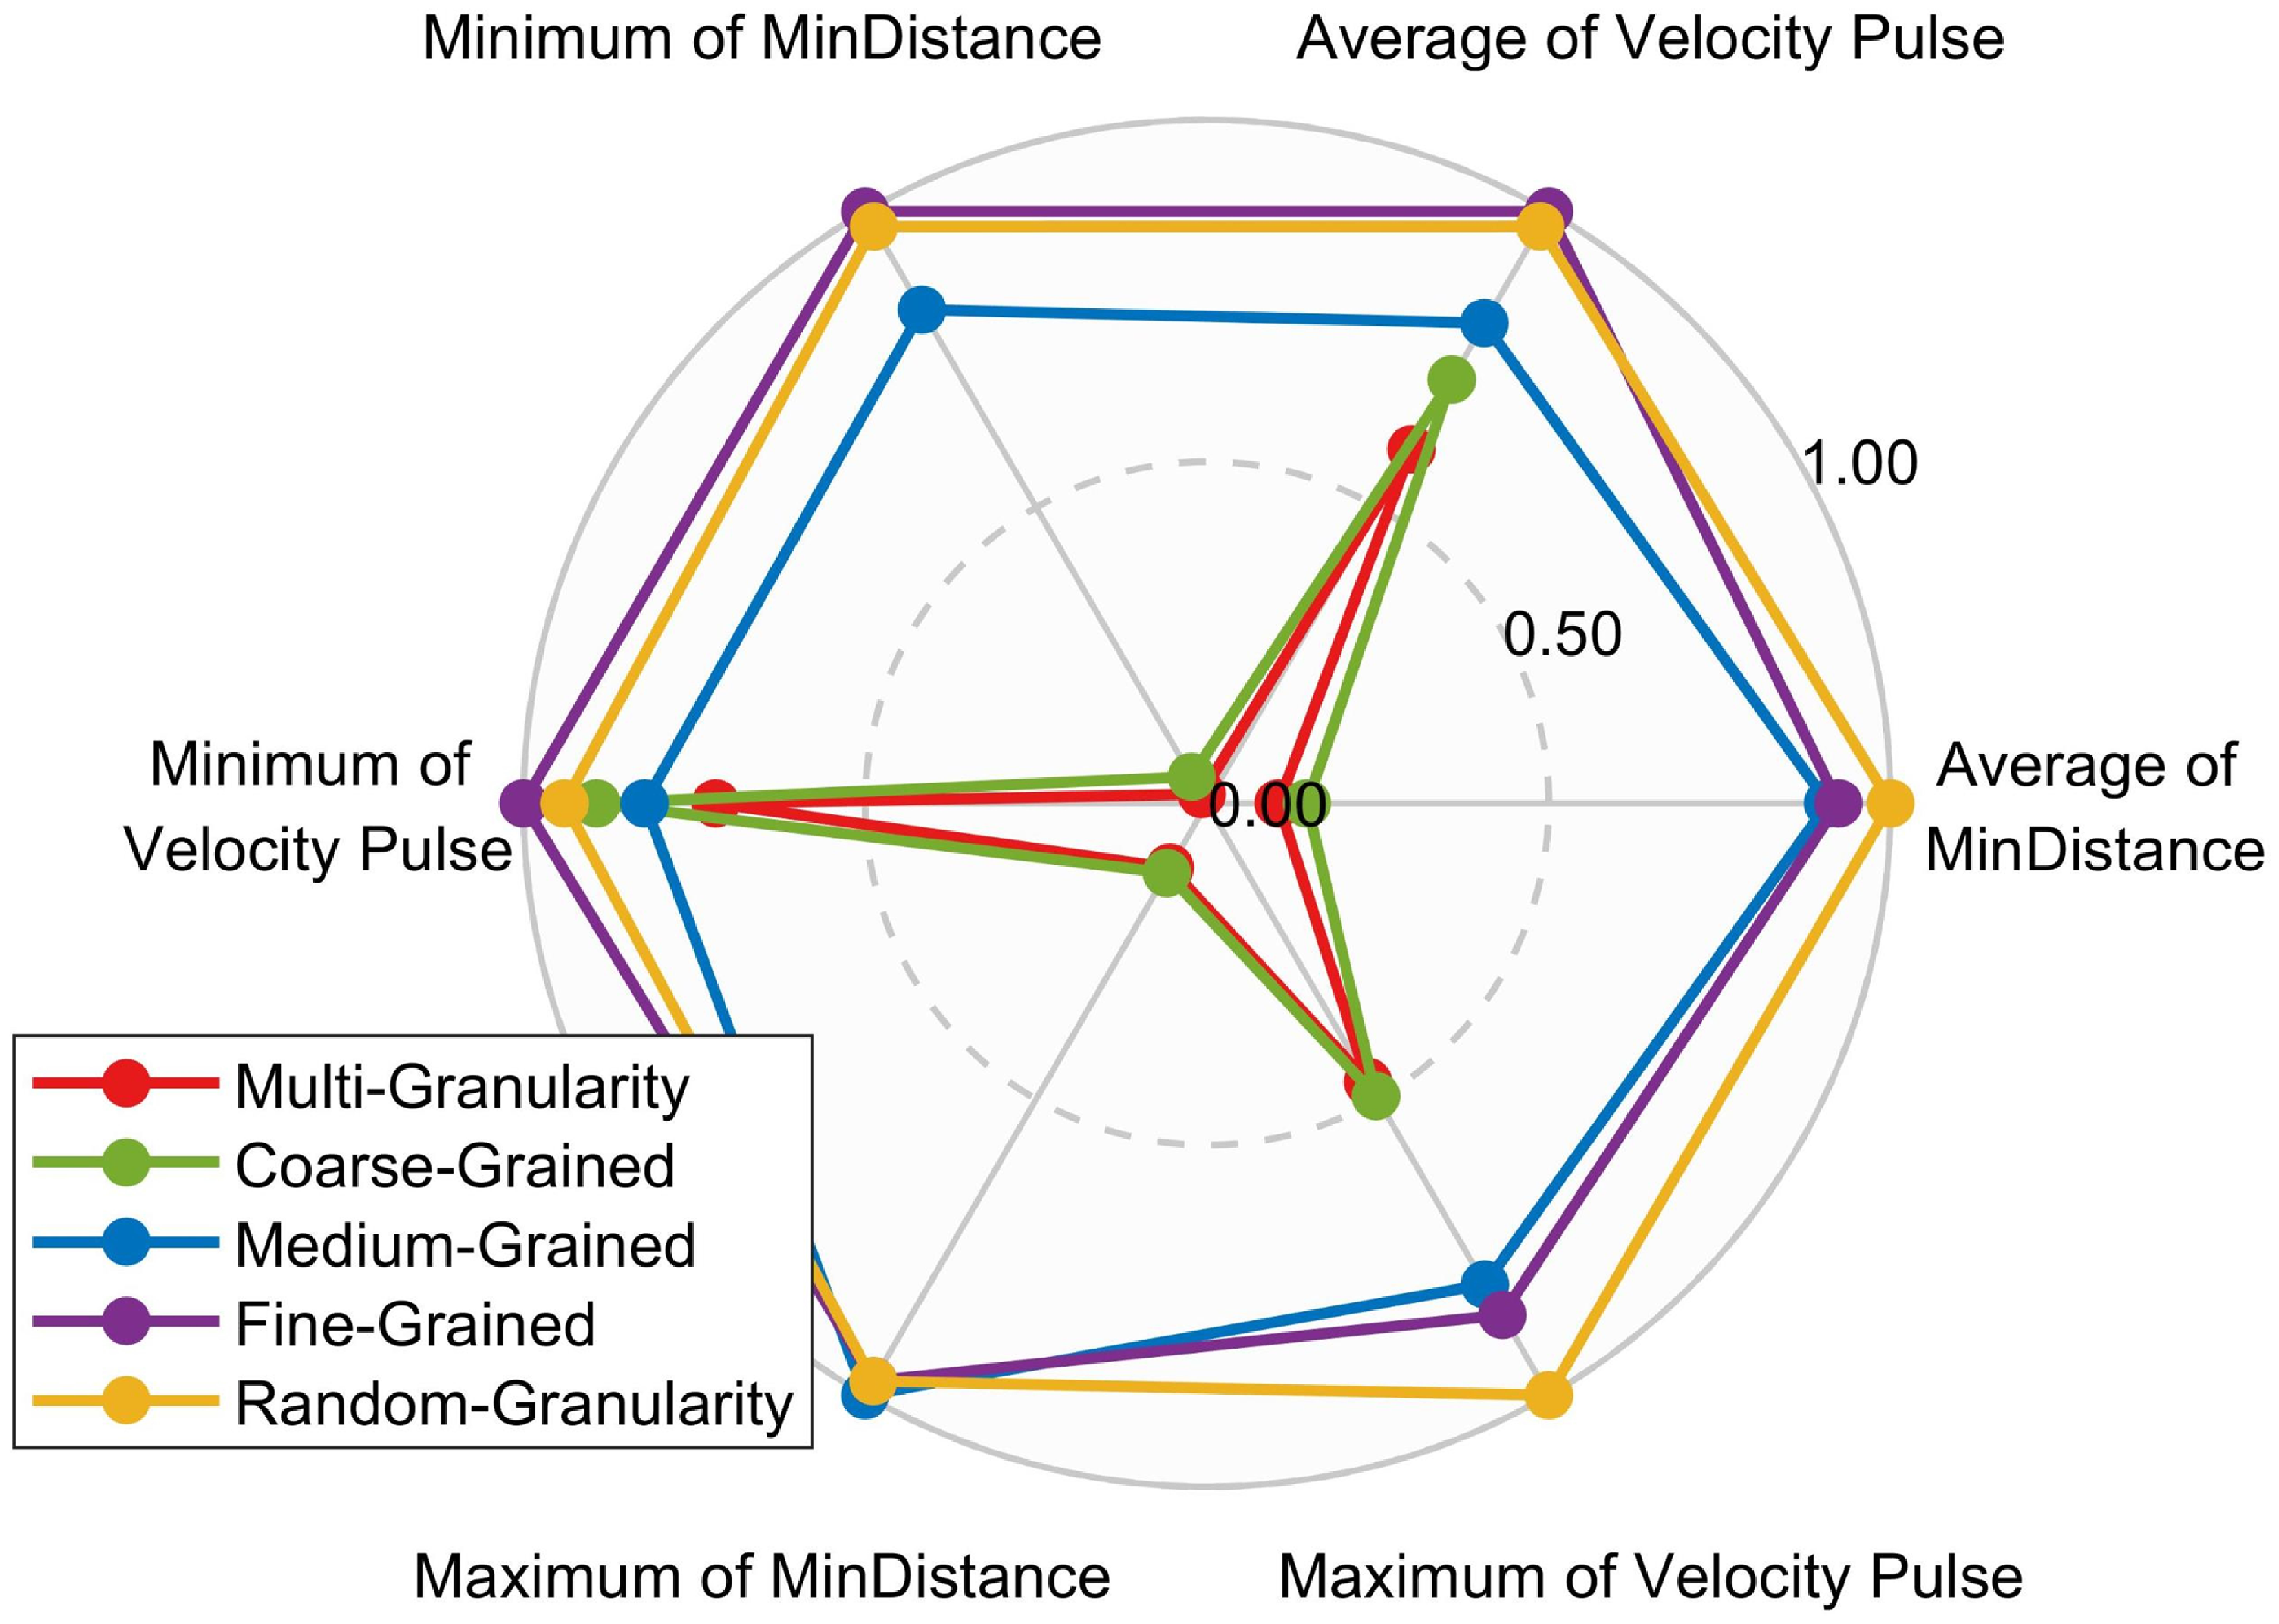
Batch statistics comparing each granularity selection method across 400 scenarios for average end closest distance, average velocity increment, minimum end closest distance, minimum velocity increment, maximum end closest distance and maximum velocity increment are presented in Table 3.
Batch statistics comparing each granularity selection method
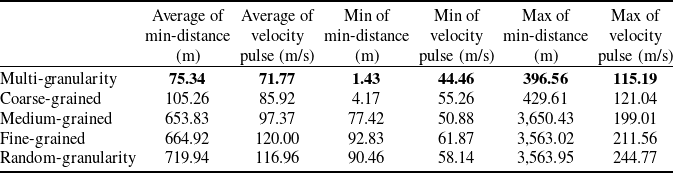
According to Table 3, the proposed multi-granularity decision-making method in this paper outperforms the average end closest distance compared to using only coarse-grained by 28.4%, compared to using only medium-grained by 88.5%, compared to using only fine-grained by 88.7%, and compared to random granularity selection by 89.5%. The average velocity increment is better than using only coarse-grained by 16.5%, compared to using only medium-grained by 26.3%, compared to using only fine-grained by 40.2%, and compared to random granularity selection by 45.19%.
The results obtained from applying the five methods to the 400 scenarios were processed, and normalisation was performed for each method in terms of the average end closest distance, average velocity increment, minimum end closest distance, minimum velocity increment, maximum end closest distance and maximum velocity increment. These six statistical values were plotted on the same radar chart, as shown in Fig. 13. According to the radar chart, the proposed multi-granularity decision-making method in this paper outperforms the other four granularity selection methods in terms of average end closest distance and velocity increment, whether in terms of average, minimum or maximum values. This demonstrates the adaptability of the proposed method to the randomly generated scenarios in the Monte Carlo simulations, surpassing the other four granularity selection methods.
4.3 Absolute robustness criterion analysis
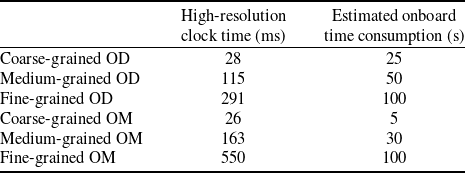
In this paper, the computation time is measured using the C++ high-resolution clock to track the maximum time consumed by the calculations at three granularities. The simulations are performed using an Intel Core i5–10,500 processor with a Dhrystone Benchmarks integer instruction rate of approximately 36,802 MIPS [19]. As a reference, the ARM architecture with Cortex-M4 as the onboard core has an integer instruction rate of about 225 MIPS [20]. Based on these parameters, the computational power assumption in this paper is that the on-board computation time is approximately 160 times that of the Core i5 processor used in this study. This assumption is utilised for subsequent calculations of computational time costs.
The orbit determination was simulated with three granularities, using 20, 30 and 50 images, and the simulation was repeated 200 times with different initial inputs. The statistical values for the time limits of orbit determination and orbit manoeuver are shown in Table 4.
The statistical values for the time limits of OD and OM
The batch results for the required velocity increments for chaser orbit manoeuvers.
The definition includes a sampling interval of 1 second for each photo taken by the camera. To ensure comprehensive statistics, the time consumption values for each granularity were appropriately expanded.
4.4 Sensitivity analysis
For the proposed sequential three-way decision method in this paper, a sensitivity analysis was conducted on the values of parameters
 ${\boldsymbol\alpha _{CoarseOD}}$
 ${\boldsymbol\alpha _{MediumOD}}$
 ${\boldsymbol\alpha _{CoarseOM}}$
and
 ${\boldsymbol\alpha _{MediumOM}}$
. The results of single simulation parameters and indicators are shown in Fig. 14. For the two indicators of minimum end distance and velocity impulse consumption, the top n indicators were individually selected, and the corresponding parameters for the most optimal values were obtained, resulting in two optimal parameter sets. When n cannot be reduced further, and there is an intersection between the optimal parameter sets for the two indicators, the intersecting elements represent the comprehensive optimal parameters for both indicators.
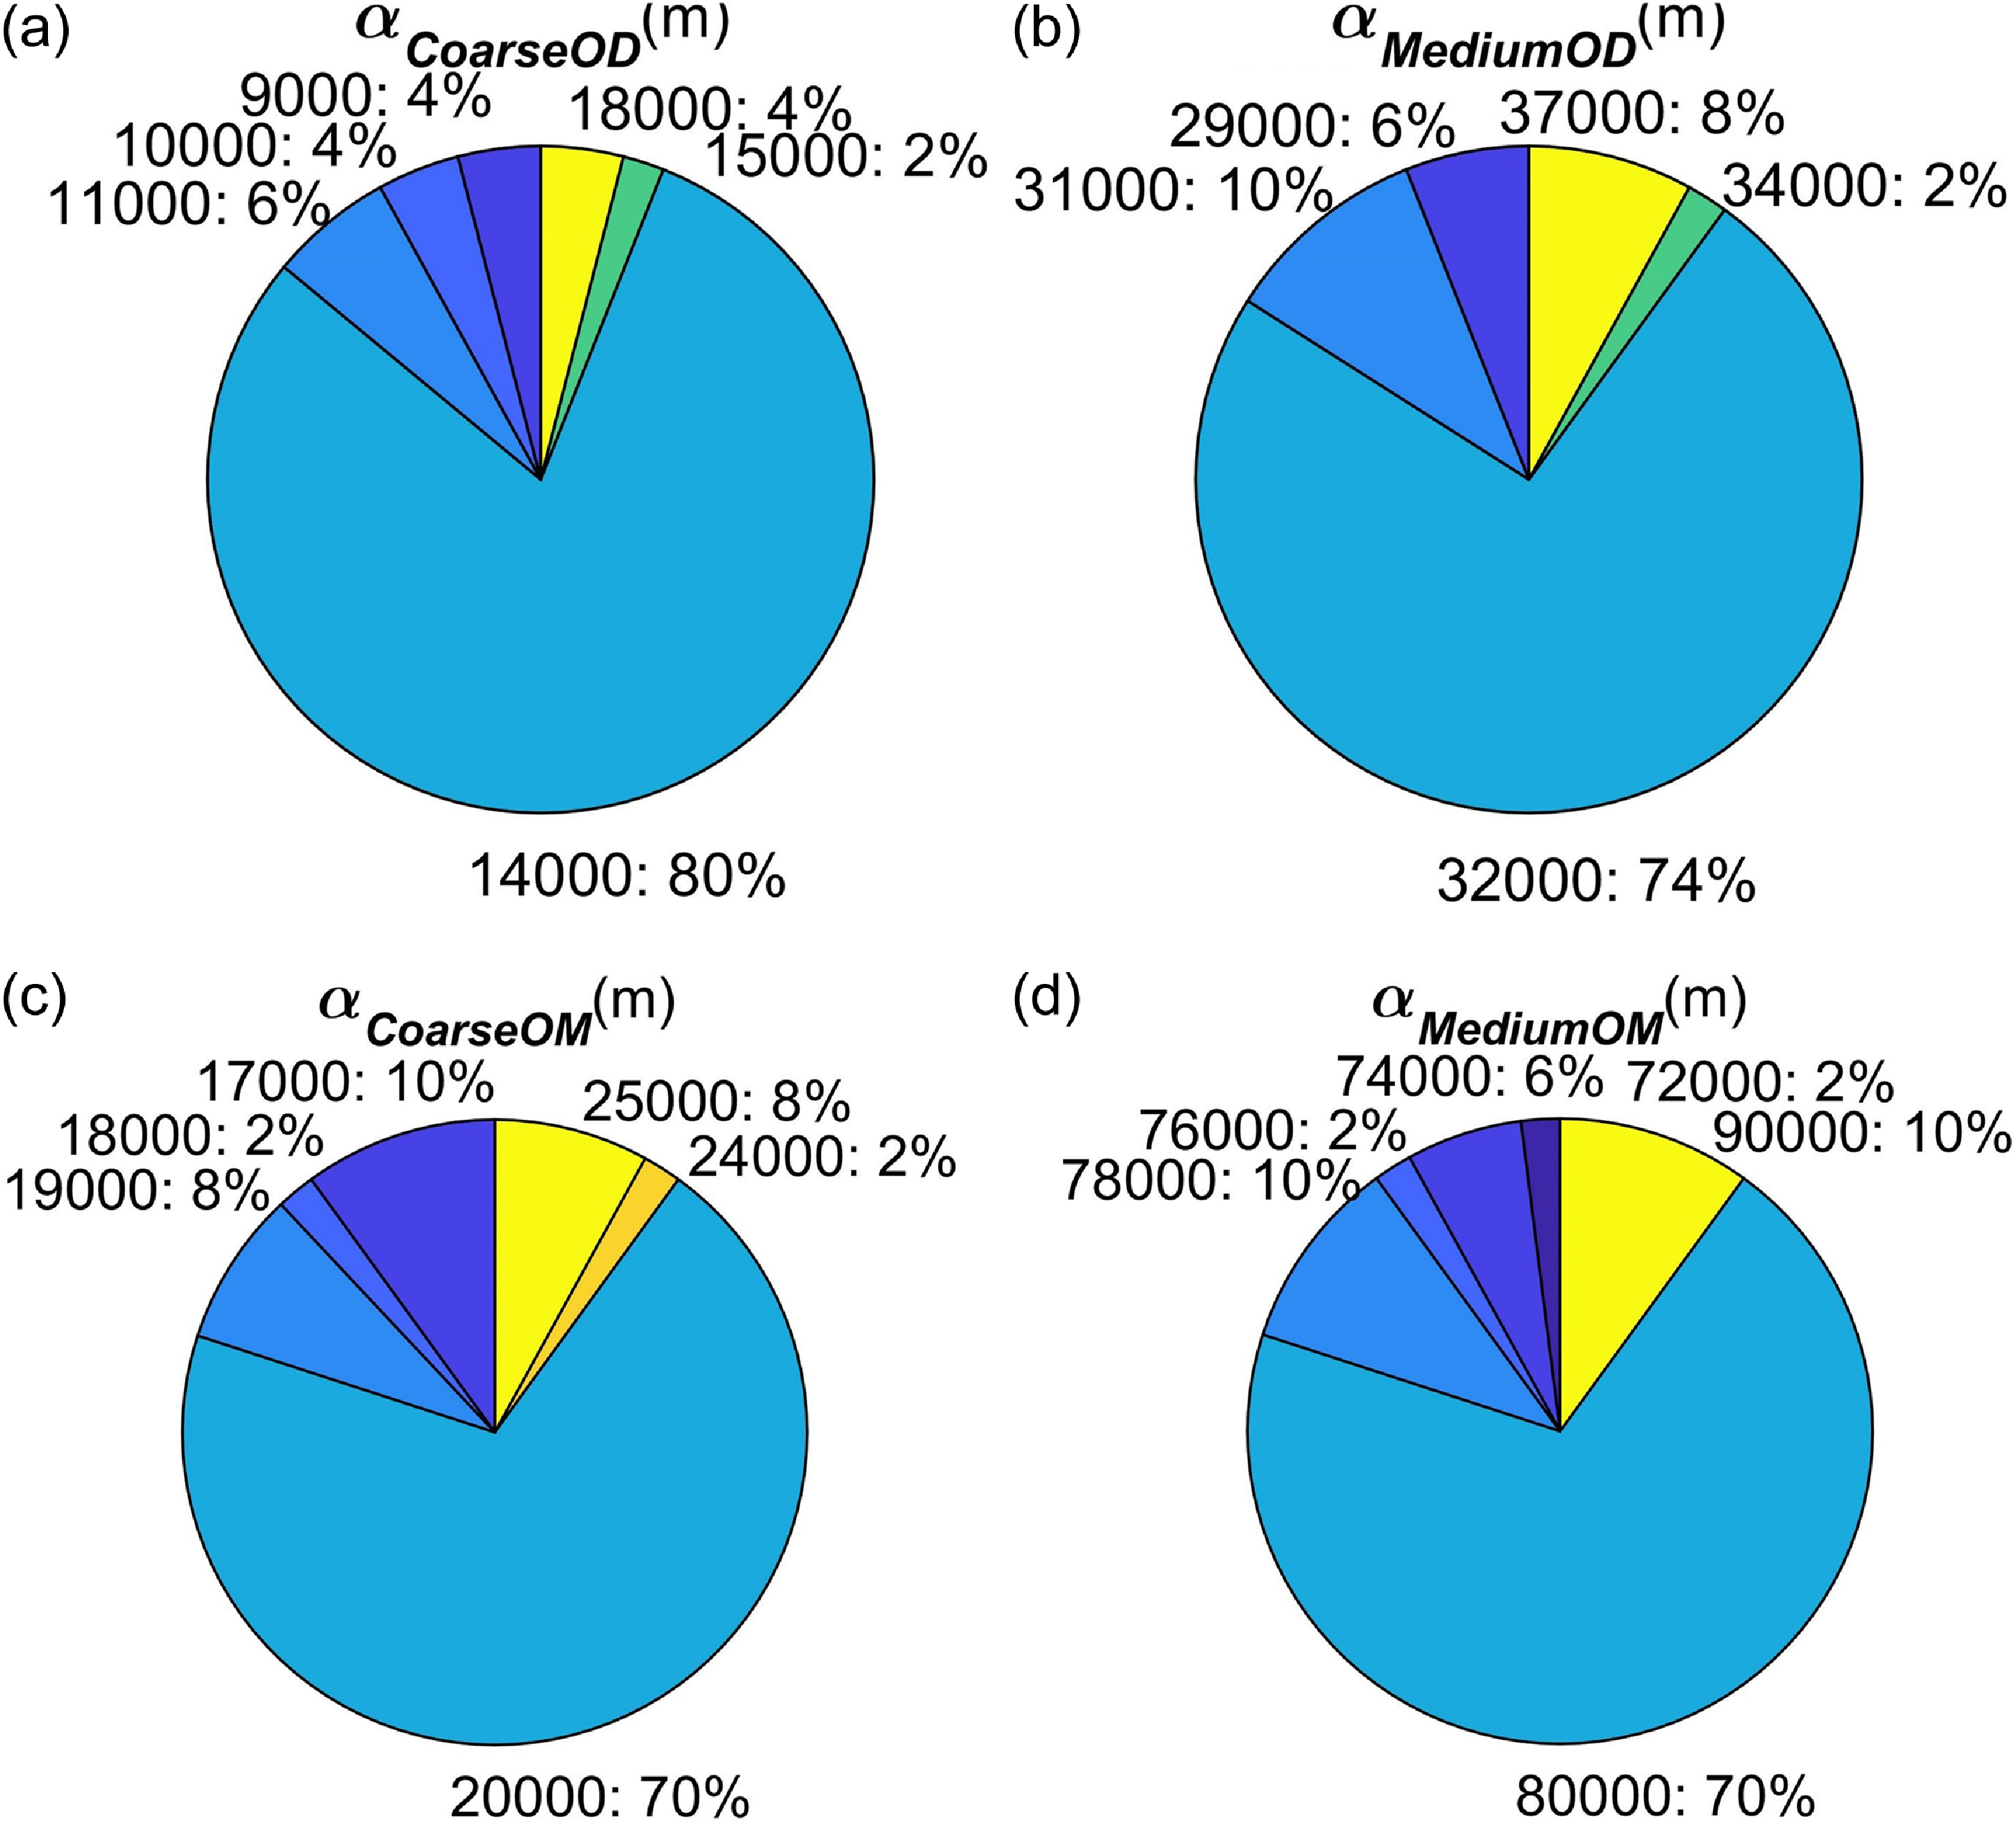
Randomly selecting 50 scenarios within a relative distance range of 50–200km, simulations were conducted with 11 different parameter values for each scenario to obtain the optimal parameters. The probability of occurrence for the optimal parameters across all scenarios was then calculated and is shown in Fig. 15. A higher probability indicates better adaptability of the indicator to different scenarios.
Threshold parameters
 ${\alpha _{CoarseOD}}$
= 14km,
 ${\alpha _{MediumOD}}$
= 32km,
 ${\alpha _{CoarseOM}}$
= 20km, and
 ${\alpha _{MediumOM}}$
= 80km required for this method were obtained through sensitivity analysis. These parameter values were consistently used in simulation validations.
In conclusion, the multi-granularity decision-making method designed in this paper, including the on-board game planning framework and the granularity selection method in the sequential three-way decision-making, not only achieves close-distance observations at the end but also ensures optimal fuel consumption. This approach satisfies the requirements for orbit determination and orbit manoeuver decisions in multi-round orbital game scenarios aimed at protecting the safety of the asset.
Single condition simulation boundary division threshold sensitivity analysis bar chart. (a)
 ${\alpha _{CoarseOD}}$
(b)
 ${\alpha _{MediumOD}}$
(c)
 ${\alpha _{CoarseOM}}$
(d)
 ${\alpha _{MediumOM}}$

The probability pie chart of the optimal boundary division threshold in multi-condition simulation. (a)
 ${\alpha _{CoarseOD}}$
(b)
 ${\alpha _{MediumOD}}$
(c)
 ${\alpha _{CoarseOM}}$
(d)
 ${\alpha _{MediumOM}}$
5.0 Conclusion
This paper proposed a multi-granularity decision-making method for optical space surveillance that reasonably balanced computation cost and precision. Unlike traditional single-granularity decision-making methods, the proposed approach could dynamically choose the most appropriate granularity for decision-making based on the urgency of the situation. The multi-granularity decision-making method proposed in this paper demonstrates an average terminal closest distance improvement of 28.4% over the comprehensive decision-making method (coarse-grained) and 88.7% over the rapid heuristic method (fine-grained). Additionally, the average velocity increment shows an improvement of 16.5% compared to the comprehensive decision-making method (coarse-grained) and 40.2% compared to the rapid heuristic method (fine-grained). This study provides an effective onboard decision-making method for subsequent inter-satellite safety monitoring.
Acknowledgements
This work was partially supported by the Key Laboratory of Spacecraft Design Optimization and Dynamic Simulation Technologies, Ministry of Education.
Competing interests
The authors declare that they have no known competing financial interests or personal relationships that could have appeared to influence the work reported in this paper.
Data Availability Statement
The data that support the findings of this study are available from the corresponding author, Y.F. Dong, upon reasonable request.



