Implications
Acetate is the main short-chain fatty acid produced by microbial fermentation in rumen and hindgut, taken up into the blood. Circulating acetate can be taken up by the mammary gland and incorporated into milk fatty acids (FA). Genes required for de novo FA formation are acetyl-CoA carboxylase (ACACA), fatty acid synthase and stearoyl-CoA desaturase (SCD1). We showed that acetate stimulated the mRNA expression of SCD1 and ACACA, without affecting that of transcription factors: sterol regulatory element binding transcription factor 1, peroxisome proliferator-activated receptor alpha and peroxisome proliferator-activated receptor delta in cultured MAC-T cells, suggesting a stimulatory role for acetate in mammary FA formation.
Introduction
Stearoyl-CoA desaturase (SCD) plays a pivotal role in bovine mammary lipid metabolism as it introduces a cis-double bond at the Δ9 position in a wide range of fatty acids (FA). It has a substrate preference for C18:0 and, to a lesser extent, C16:0, which are converted to C18:1 cis-9 and C16:1 cis-9, respectively (Ntambi and Miyazaki, Reference Ntambi and Miyazaki2004). As C18:1 cis-9 has a considerable lower melting point than C18:0, SCD plays a critical role in maintaining fluidity of cell membranes as well as milk fat. Fluidity of FA is determined primarily by FA chain length and by the amount and orientation of double bonds, and therefore the profile of FA available for use in the synthesis of milk fat triglycerides may affect fluidity. Fluidity can also be reduced by a decrease in short- and medium-chain FA because of the inhibition of mammary de novo FA synthesis (Harvatine et al., Reference Harvatine, Boisclair and Bauman2009). In addition, SCD is responsible for the conversion of C18:1 trans-11 into C18:2 cis-9, trans-11, which has been associated with several health benefits, including anticarcinogenic and antiatherogenic effects (Bhattacharya et al., Reference Bhattacharya, Banu, Rahman, Causey and Fernandes2006; Reynolds and Roche, Reference Reynolds and Roche2010).
It is well known that in rodents, polyunsaturated fatty acids (PUFA) inhibit SCD expression in both liver and adipose tissue, whereas saturated FA and monounsaturated FA have little effect (Ntambi, Reference Ntambi1999). In addition, it was shown that feeding mice a diet high in C18:1 cis-9 or C18:2 cis-9,12 inhibits both mRNA expression and activity of SCD in the mammary gland (Singh et al., Reference Singh, Hartley, McFadden and Mackenzie2004). However, in ruminants only a few studies investigated the effect of FA on mammary SCD expression. Kadegowda et al. (Reference Kadegowda, Bionaz, Piperova, Erdman and Loor2009) reported that addition of C16:0, but not C18:0, increased mRNA expression of SCD1 in a bovine mammary cell line (MAC-T), whereas C18:1 cis-9, C18:1 trans-10, C18:2 trans-10, cis-12 and C20:5 all decreased expression of SCD1. In addition, it was shown in the same cell line that promoter activity of bovine SCD1 could be inhibited by C18:1 cis-9, whereas C18:0, C18:1 trans-11, C18:2 cis-9,12 and C18:3 cis-9,12,15 had no effect (Keating et al., Reference Keating, Kennelly and Zhao2006).
Contrary to long-chain fatty acids (LCFA), no information is available on the effect of short-chain fatty acids (SCFA) on mammary SCD expression. Acetic acid (Ac) and β-hydroxybutyric acid (BHBA), which originate from ruminal fermentation, are the main precursors for de novo synthesis of FA in the bovine mammary gland (Chilliard et al., Reference Chilliard, Ferlay, Mansbridge and Doreau2000; Bernard et al., Reference Bernard, Leroux and Chilliard2008). We hypothesize that both Ac and BHBA modulate the mRNA expression of lipogenic gene SCD1 as well as acetyl-CoA carboxylase (ACACA) and fatty acid synthase (FASN), all known to be required for milk fat biosynthesis (Chilliard et al., Reference Chilliard, Ferlay, Mansbridge and Doreau2000), in the bovine mammary epithelial gland.
We have used MAC-T bovine mammary epithelial cells as a model for the bovine mammary gland to study the influence of SCFA, Ac and BHBA on the mRNA expression of the two SCD isoforms SCD1 and SCD5, known to be expressed in the bovine mammary gland (Jacobs et al., Reference Jacobs, van Baal, Smits, Taweel, Hendriks, van Vuuren and Dijkstra2011), together with that of lipogenic genes ACACA and FASN. The expression levels of sterol regulatory element binding protein 1 (SREBF1), insulin-induced gene 1 protein (INSIG1) and peroxisome proliferator-activated receptors (PPARs) were also measured. In the same cells, we compared the transcriptional effects of Ac and BHBA to that of various LCFA. Moreover, we have measured the FA composition in the MAC-T cells after the different treatments.
Material and methods
Reagents
Sodium Ac (S5636), sodium DL-BHBA (H6501), bovine serum albumin (BSA, fatty acid free; A8806), bovine insulin (I0516), bovine apo-transferrin (T1428), hydrocortisone (H0888), progesterone (P8783) and phosphate buffered saline (PBS; pH = 7.4; P3813) were purchased from Sigma-Aldrich (St. Louis, MO, USA). The LCFA palmitic acid (C16:0, N-16A), stearic acid (C18:0, N-18A), oleic acid (C18:1 cis-9, U-46A), trans-vaccenic acid (C18:1 trans-11, U-49A), linoleic acid (C18:2 cis-9,12, U-59A) and linolenic acid (C18:3 cis-9,12,15, U-62A) were obtained from Nu-Chek Prep Inc. (Elysian, MN, USA). Dulbecco's modified eagle's medium F-12 (DMEM/F-12), foetal bovine serum (FBS, 10091–148), penicillin/streptomycin (15070–063), TRIzol® reagent (15596–026) and Superscript® III (18080–044) were purchased from Invitrogen (Carlsbad, CA, USA). Bovine prolactin (AFP710E) was obtained from the National Hormone & Peptide Program (NHPP), NIDDK, and Dr A. F. Parlow (Harbor-UCLA Medical Center, Torrance, CA, USA).
Cell culture and treatments
This study was performed using an established clonal cell line produced from primary bovine mammary alveolar cells (MAC-T) by stable transfection with SV-40 large T-antigen (Huynh et al., Reference Huynh, Robitaille and Turner1991). These cells have been cultured and assayed for various purposes in many laboratories (e.g. Sørensen et al., Reference Sørensen, Chris Kazala, Murdoch, Keating, Cruz-Hernandez, Wegner, Kennelly, Okine and Weselake2008; Ma and Corl, Reference Ma and Corl2012). Cells were cultured in DMEM/F-12 supplemented with 10% (v/v) FBS and 1% penicillin/streptomycin (5000 units of penicillin and 5000 μg of streptomycin per ml) at 37°C in a humidified atmosphere of 5% CO2. The MAC-T cells were seeded in vented 75 cm2 flasks (Corning Inc., Corning, NY, USA) and grown to ∼90% confluency in DMEM/F-12 supplemented with 10% FBS and 1% penicillin/streptomycin for 24 h. Subsequently, the cell monolayer was rinsed twice with 10 ml PBS and incubated in a lactogenic media (adapted from Kadegowda et al., Reference Kadegowda, Bionaz, Piperova, Erdman and Loor2009) comprised DMEM/F-12 supplemented with 1% penicillin/streptomycin, 1 g/l BSA, 5 mg/l bovine insulin, 5 mg/l bovine apo-transferrin, 2.5 mg/l bovine prolactin, 1 mg/l hydrocortisone and 1 mg/l progesterone. This lactogenic media was refreshed after 24 h and cells were cultured for 48 h at 37°C in the lactogenic media before treatment with FA. Before addition to the MAC-T cells, and as the major proportion of LCFA in blood serum of dairy cattle is tightly bound to albumin, the LCFA were complexed with BSA as sodium salts as described by Sørensen et al. (Reference Sørensen, Chris Kazala, Murdoch, Keating, Cruz-Hernandez, Wegner, Kennelly, Okine and Weselake2008) with some modifications. First, 0.1 mM LCFA was dissolved in 1 ml hexane : isopropanol (3 : 2) followed by addition of 10 ml 0.1 M sodium hydroxide. This solution was then mixed and the hexane : isopropanol layer was evaporated using nitrogen gas. Subsequently, 1 ml of this solution was slowly added to 2 ml of 5% (w/v) BSA, and the resulting LCFA–BSA solution was stored overnight at 4°C, followed by storage at −20°C until use.
All treatments were performed in the presence of lactogenic media at 37°C. For SCFA application, we used a concentration of 5 mM, which is the submaximal dosage of Ac to FA synthesis in cultured bovine mammary tissue (Forsberg et al., 1984). Thus, cells were treated with 5 mM Ac, 5 mM BHBA or a mixture of Ac and BHBA (5 mM each). In parallel, MAC-T cells were incubated with 100 μM LCFA–BSA, as this concentration elicited in these cells maximal effects on the transcript levels of SCD1, FASN and ACACA within 48 h of incubation (Kadegowda et al., Reference Kadegowda, Bionaz, Piperova, Erdman and Loor2009). In order to keep the amount of BSA similar among all treatment groups, BSA was applied to the control, Ac and BHBA treatments as well. Treatments were performed in triplicate and cells were harvested after 12 h of incubation for subsequent analysis of gene expression and FA composition, as the effect of Ac on SCD1 mRNA expression at 12 h was not different from that at 24 h (see ‘Results’ section).
Tissue sampling
For comparison of the expression pattern in native tissue v. that in MAC-T cells, liver, mammary gland and adipose tissue, biopsies were taken from three lactating Holstein–Friesian cows as described previously (Jacobs et al., Reference Jacobs, van Baal, Smits, Taweel, Hendriks, van Vuuren and Dijkstra2011; Goselink et al., Reference Goselink, van Baal, Widjaja, Dekker, Zom, de Veth and van Vuuren2013). Collected tissues were stored at −80°C until RNA extraction.
RNA extraction and real-time PCR
Total RNA was isolated using ice-cold TRIzol® reagent, according to the manufacturer's instructions. Subsequently, total RNA (1 μg) was reverse-transcribed with Superscript® III after random priming, as described previously (Jacobs et al., Reference Jacobs, van Baal, Smits, Taweel, Hendriks, van Vuuren and Dijkstra2011). To determine if both isoforms of SCD, that is, SCD1 and SCD5, are expressed in native and immortalized bovine mammary epithelial (MAC-T) cells, reverse transcriptase PCR was performed as follows: denaturation at 94°C for 2 min followed by amplification of 40 cycles of 30 s at 94°C, 45 s at 30°C and 2 min at 72°C, followed by 8 min at 72°C. Primers used for SCD1 were: CTACACAACCACCACCACCA (forward), CAGGGCACCCATCAGATAGT (reverse); and for SCD5: CTTCCTCCTGACTGCTCTGG (forward) and GTGGGGACTACGAAGCACAT (reverse). Expected amplicon sizes for SCD1 and SCD5 were 301 and 372 bp, respectively. Products were electrophoresed on 0.8% agarose gel with ethidium bromide staining and were visualized under UV transillumination.
For quantification of mRNA, SYBR® Green real-time PCR was performed with an ABI 7500 Real-Time PCR System (Applied Biosystems, Foster City, CA, USA) utilizing the SYBR® Green PCR Master Mix (Applied Biosystems). Quantitative real-time PCR (qPCR) conditions were as follows: denaturation at 95°C for 10 min followed by amplification of 40 cycles of 15 s at 95°C and 1 min at 60°C. The primers used were designed with the software program Primer Express 3.0 (Applied Biosystems) and recommended primer sets that span an intron were selected when possible. The primers selected for qPCR are presented in Supplementary Table S1. The primers to quantify bovine SCD1, ACTB, 18S RNA, peroxisome proliferator-activated receptor alpha (PPARA) and peroxisome proliferator-activated receptor delta (PPARD) expression have been used previously (Jacobs et al., Reference Jacobs, van Baal, Smits, Taweel, Hendriks, van Vuuren and Dijkstra2011; Goselink et al., Reference Goselink, van Baal, Widjaja, Dekker, Zom, de Veth and van Vuuren2013; Jacobs et al., Reference Jacobs, Dijkstra, Hendriks, van Baal and van Vuuren2013). PCR efficiencies for the genes were established to be at least 91%. Melting curve analysis and fractionation of the qPCR products on an ethidum bromide-stained agarose gel was carried out to determine primer specificity. Relative mRNA expression for each gene of interest (I) was calculated using the formula: (1 + E[I])−Ct[I]/(1 + E[GMH])−Ct[GMH], where E is the amplification efficiency and GMH the geometric mean of the three housekeeping genes (ACTB, 18S and MRPL39). Samples without treatment of reverse transcriptase were prepared and analysed by qPCR, and these always turned out to be negative. Each sample was run in duplicate.
Lipid extraction and FA analysis
The MAC-T cells (one flask per condition) were collected, pelleted by centrifugation (1000 × g for 10 min at 4°C), and washed twice with PBS. Total lipids were extracted using methanol and chloroform according to Bligh and Dyer (Reference Bligh and Dyer1959). Extracted lipids were transesterified using potassium hydroxide in methanol (0.5 M) followed by boron trifluoride in methanol (10% w/w) at 100°C for 10 min each. Fatty acid methyl esters (FAME) were dissolved in n-hexanes and quantified using a GC-2010 Plus gas chromatograph (Shimadzu, Kyoto, Japan) using a CP-Sil 88 WCOT fused silica column (100 m × 0.25 mm i.d. × 0.2 μm film thickness; Varian Inc., Lake Forest, CA, USA) according to our previous published methods (Caldari-Torres et al., Reference Caldari-Torres, Lock, Staples and Badinga2011). The FAME were identified by comparison of retention times with known FAME standards (Caldari-Torres et al., Reference Caldari-Torres, Lock, Staples and Badinga2011).
Statistical analysis
Results presented are expressed as mean ± s.e. Statistical analyses were carried out by ANOVA using the PROC MIXED procedure of SAS (version 9.2, SAS Institute Inc., Cary, NC, USA). The model included treatment as fixed effect. To test for effects on mRNA abundance, Dunnett's tests were used to compare treatment means to the mean of the control (vehicle) group. Differences were considered significant at P < 0.05, and as a trend at 0.05 < P < 0.10. The regression procedure (PROC REG) of SAS was used to analyse correlations between relative mRNA abundance of the different genes as well as relationships between mRNA abundance of SCD1 and the desaturase indices. Relationships between SCD1 mRNA abundance and the desaturase indices were calculated without the treatments that involved substrates and products of that particular desaturase index. The Δ9 desaturase indices were calculated as the ratio between the FA product and the sum of the FA product and substrate of SCD, according to Kelsey et al. (Reference Kelsey, Corl, Collier and Bauman2003).
Results
Expression of lipogenic genes
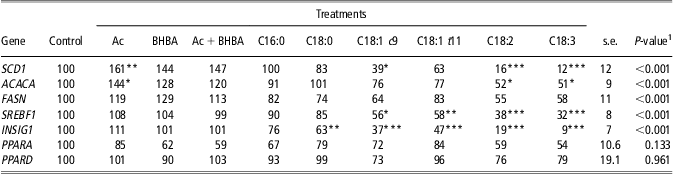
A preliminary time-response study showed that the maximal effect of Ac on SCD1 mRNA abundance in cultured MAC-T bovine mammary epithelial cells was reached by 12 h of incubation (Figure 1). This incubation time corresponds well with the maximal effect of certain LCFA on SCD1 expression in these cells (Kadegowda et al., Reference Kadegowda, Bionaz, Piperova, Erdman and Loor2009). For this reason, MAC-T cells were treated for 12 h with Ac after which the mRNA expression of the lipogenic enzymes SCD1, ACACA and FASN was determined by qPCR. In addition, cells were treated with BHBA or various LCFA for the same period of time to compare their effects with that of Ac. As shown in Table 1, the transcript level of SCD1 was increased by Ac (+61%) and reduced by C18:1 cis-9 (−61%), C18:2 cis-9,12 (−84%) and C18:3 cis-9,12,15 (−88%) compared with control cells. Contrary to SCD1, MAC-T cells did not express SCD5 as evidenced by reverse transcription PCR (Figure 2). Expression of ACACA was also increased by Ac (+44%) and reduced by C18:2 cis-9,12 (−48%) and C18:3 cis-9,12,15 (−49%) compared with control cells (Table 1). Treatments did not significantly affect FASN expression but a tendency of a lower FASN expression was found for C18:2 cis-9,12 (P = 0.07) and C18:3 cis-9,12,15 (P = 0.09) compared with control (Table 1).
Relative mRNA abundance of SCD1 in MAC-T cells treated with 5 mM acetate after increasing incubation time. Vertical lines represent s.e.; *P < 0.05. SCD = stearoyl-CoA desaturase.

Effect of FA treatments on the transcript levels of lipid-related genes in MAC-T cells

Ac = acetic acid; BHBA = β-hydroxybutyrate; SCD1 = Stearoyl-coenzyme A desaturase 1; ACACA = acetyl coenzyme A carboxylase; FASN = fatty acid synthase; the transcription factors: SREBF1 = sterol regulatory element binding protein 1; INSIG1 = insulin-induced gene 1; PPARA = peroxisome proliferator-activated receptor alpha; PPARD = peroxisome proliferator-activated receptor delta.
Relative mRNA abundance of indicated genes in MAC-T cells were measured after treatment (12 h) in the absence (vehicle control) or presence of: 5 mM Ac, 5 mM BHBA, combination of Ac and BHBA (Ac + BHBA), or 100 μMof the following long-chain fatty acids: palmitic acid (C16:0), stearic acid (C18:0), oleic acid (C18:1 c9), trans-vaccenic acid (C18:1 t11), linoleic acid (C18:2) or linolenic acid (C18:3). Values are expressed are relative to the control (100%).
1Effect of treatment.
*P < 0.05, **P < 0.01, ***P < 0.001 v. control.
Detection of SCD1 and SCD5 expression in native and immortalized (MAC-T) bovine mammary epithelial cells by reverse transcriptase PCR analysis. Native mammary tissue was collected via biopsy. Total RNA was converted to cDNA in the presence of reverse transcriptase (+RT) or absence of reverse transcriptase (−RT; negative control) and PCR was performed using specific primers designed to synthesize fragments of the indicated bovine SCD isoforms. The blot is representative for three independent experiments. SCD = stearoyl-CoA desaturase.

Expression of transcription factors
The mRNA level of SREBF1 was reduced by C18:1 cis-9 (−4%), C18:1 trans-11 (−42%), C18:2 cis-9,12 (−62%) and C18:3 cis-9,12,15 (−68%) compared with control (Table 1). Expression of INSIG1 was downregulated by C18:0 (−37%), C18:1 cis-9 (−63%), C18:1 trans-11 (−53%), C18:2 cis-9,12 (−81%) and C18:3 cis-9,12,15 (−91%) compared with control. None of the treatments altered the transcript level of PPARA and PPARD (Table 1).
Through alternative spicing, PPARG is expressed in at least two variants in cattle: PPARγ2, which is expressed predominantly in adipose tissue, and PPARγ1, which has an ubiquitous expression pattern (Sharma et al., Reference Sharma, Monga, Singh, Datta and Singh2012). We performed reverse transcription PCR analysis to determine PPARG expression in MAC-T cells compared with native bovine mammary gland, liver and adipose tissue. Strikingly, PPARG expression was observed in native bovine liver, mammary gland and adipose tissue, but not in the MAC-T cells (Supplementary Figure S1). Further identification of the expression pattern, using isoform specific primers (Supplementary Table S2), unfolded that PPARγ2 is expressed in native adipose tissue only.
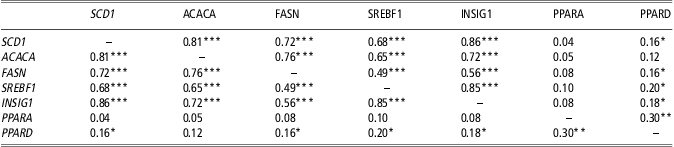
The r 2 values of correlations between the relative mRNA abundance of the lipogenic genes SCD1, ACACA and FASN and the transcription factors SREBF1, INSIG1, PPARA and PPARD are shown in Table 2. We observed a strong relationship between the relative expression of the lipogenic genes SCD1, FASN, ACACA, SREBF1 and INSIG1 (range r 2: 0.72 to 0.81; P < 0.001). The expression of PPARD, but not of PPARA, correlated (P < 0.05) with the expression of SCD1, FASN, SREBF1 and INSIG1.
Correlation (r 2 values) between the relative mRNA abundance of the lipogenic genes in MAC-T cells
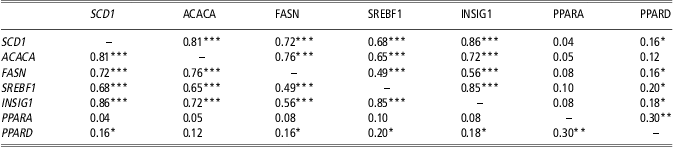
SCD1 = Stearoyl-coenzyme A desaturase 1; ACACA = acetyl coenzyme A carboxylase; FASN = fatty acid synthase; the transcription factors: SREBF1 = sterol regulatory element binding protein 1; INSIG1 = insulin-induced gene 1; PPARA = peroxisome proliferator-activated receptor alpha; PPARD = peroxisome proliferator-activated receptor delta.
*P < 0.05, **P < 0.01, ***P < 0.001.
FA composition
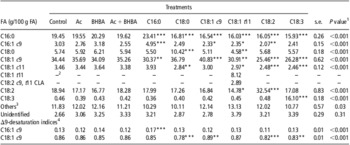
Table 3 shows the FA composition of total lipids extracted from the MAC-T cells. As expected, application of the various LCFA resulted in an increased proportion of the corresponding FA in the cells. C18:1 trans-11 as well as C18:2 cis-9, trans-11 conjugated linoleic acid (CLA) were only detected in cells treated with C18:1 trans-11. The C16 and C18 desaturase indices were significantly affected by the different treatments. As predicted, the C18 index was significantly higher upon addition of C18:1 cis-9, which is the desaturase product itself. There was a significant relationship between the C18 desaturase index and relative SCD1 mRNA abundance (r 2 = 0.42; P < 0.001). However, there was no significant relationship between the C16 desaturase index and relative SCD1 mRNA abundance (r 2 = 0.05; P = 0.28).
FA composition of total lipids extracted from MAC-T cells

FA = fatty acid; Ac = acetic acid; BHBA = β-hydroxybutyrate; CLA = conjugated linoleic acid.
Lipids were extracted and analysed after treatment (12 h) with either: 5 mM Ac, 5 mM BHBA, combination of Ac and BHBA (Ac + BHBA), or 100 μM of the following long-chain fatty acids: palmitic acid (C16:0), stearic acid (C18:0), oleic acid (C18:1 c9), trans-vaccenic acid (C18:1 t11), linoleic acid (C18:2) or linolenic acid (C18:3).
1Effect of treatment.
2Not detected.
3Sum of minor FAs: ∑ (C14:0, C14:1 c9, C15:0, C16:1 t9, C16:1 c7/c8, C16:1 c11, C17:0, C17:1 c9, C17:1 c10, C18:1 t6-8, C18:1 t9, C18:1 t10, C18:1 t12, C18:1 c12, C18:1 c13, C18:1 c14/t16, C20:0, C20:1 c8, C20:1 c9, C20:1 c11, C18:2 t10c12 CLA, C20:2 (n-6), C20:3 (n-6), C20:3 (n-3), C20:4 (n-6), C20:5 (n-3), C22:0, C24:0, C24:1 c15, C22:4 (n-6), C22:5 (n-3), C22:6 (n-3)).
4Δ9-desaturase indices are calculated as: Δ9-desaturase product divided by the sum of the Δ9-desaturase product and substrate.
*P < 0.05, **P < 0.01, ***P < 0.001 v. control (vehicle).
Discussion
The aim of this study was to examine the effects of the SCFA, Ac and BHBA as well as various LCFA on expression of several lipogenic genes and transcriptional regulators in bovine mammary epithelial cells. In addition, we analysed the accumulation and metabolism of the added SCFA and LCFA by measuring the FA composition of the cells after the treatments. The data on the FA composition of the cells demonstrate that the LCFA were taken up by the cells, rather than incomplete washing of the cells, as C18:2 cis-9, trans-11 CLA was only detected in cells treated with C18:1 trans-11. Apparent desaturation of C18:1 trans-11 to C18:2 cis-9, trans-11 CLA was 26.5% of total C18:1 trans-11 taken up by the cells. This is in close agreement with the 25.7% reported by Mosley et al. (Reference Mosley, Shafii, Moate and McGuire2006) in dairy cows using 13C-labelled FA.
Both native mammary gland tissues and MAC-T cells express SCD1. In contrast, SCD5 mRNA was only detectable in native mammary gland tissue. It is possible that SCD5 is not expressed in native bovine mammary alveolar cells. Alternatively, transformation or passaging in cultures of bovine mammary alveolar cells may lead to a loss of SCD5 expression. Our previous study indicated that the contribution of SCD5 expression to the production of milk Δ9-unsaturated FA in the mammary gland of dairy cows was very small compared with that of SCD1 (Jacobs et al., Reference Jacobs, van Baal, Smits, Taweel, Hendriks, van Vuuren and Dijkstra2011). More detailed protein localization and functional studies are needed to provide better insights into the physiological role of SCD5 in the bovine mammary gland.
Ac is the major end product of fermentation of substrates by microorganisms in the rumen. The relative production of Ac is most pronounced upon fermentation of fibre, but fermentation of starch and sugars in the rumen also provides considerable amounts of Ac (Bannink et al., Reference Bannink, Kogut, Dijkstra, France, Kebreab, Van Vuuren and Tamminga2006). As Ac can serve as a substrate for mammary lipogenesis in dairy cows (Harvatine et al., Reference Harvatine, Boisclair and Bauman2009), we hypothesized that SCFA affect the expression of mammary lipogenic genes. We found indeed upregulation of the mRNA abundance of both ACACA and SCD1 in MAC-T cells by Ac indicating that Ac increases de novo FA synthesis and desaturation of FA in bovine mammary epithelial cells. Indeed, Ac was readily incorporated into FA in cultured mammary gland tissues of lactating cows (Forsberg et al., 1984). Although Ac upregulated ACACA, an SCD1 mRNA expression, application of Ac did not result in an accumulation of C16:0 in total lipids in MAC-T cells. This is in line with the study of Yonezawa et al. (Reference Yonezawa, Yonekura, Sanosaka, Hagino, Katoh and Obara2004). They demonstrated that a longer period of 3 to 5 days of Ac exposure was required to detect a substantially increase in triacylglyceride accumulation in primary cultured bovine mammary epithelial cells. These data suggest that Ac stimulates mRNA expression of ACACA and SCD1 preceding to triacylglyceride accumulation in bovine mammary epithelial cells. Contrary to Ac, we found that BHBA or the combination of Ac and BHBA had no significant effect on the mRNA levels of the lipogenic genes measured, compared with the control treatment, although numerically these additions resulted in a similar stimulatory response. This suggests that Ac has a more pronounced effect on lipogenic gene expression in bovine mammary epithelial cells compared with BHBA.
Yonezawa et al. (Reference Yonezawa, Yonekura, Sanosaka, Hagino, Katoh and Obara2004) found that long-term exposure of Ac (i.e. after 7 days) decreased ACACA activity in primary cultured bovine mammary epithelial cells. It is possible that the higher expression of ACACA and SCD1 induced by Ac gradually increases cellular triacylglyceride and ATP content in the long term. The increased ATP content, in turn, may inhibit ACACA activity via reduction of the activity of 5′-AMP-activated protein kinase (AMPK) by altering the AMP/ATP ratio.
C16:0 has been shown to upregulate SCD1 mRNA expression in MAC-T cells (Kadegowda et al., Reference Kadegowda, Bionaz, Piperova, Erdman and Loor2009). However, we did not find a significant effect of C16:0 treatment on SCD1 transcript levels in MAC-T cells. This contradiction could be because of the fact that our MAC-T cells did not express PPARG, as Kadegowda et al. (Reference Kadegowda, Bionaz, Piperova, Erdman and Loor2009) suggested that the effect of C16:0 on SCD1 expression was partly mediated through PPARG. Also addition of C18:0 to the MAC-T cells did not affect SCD1 expression. This is in line with Kadegowda et al. (Reference Kadegowda, Bionaz, Piperova, Erdman and Loor2009) who also reported that C18:0 did not affect SCD1 expression in MAC-T cells. Moreover, Jayan and Herbein (Reference Jayan and Herbein2000) reported that SCD activity was not affected when C18:0 was added to MAC-T cells.
The main product of SCD1 is C18:1 cis-9 arising from desaturation of C18:0 (Ntambi, Reference Ntambi1999). Addition of this product to the MAC-T cells resulted in downregulation of SCD1. This suggests that C18:1 cis-9 inhibits SCD1 expression in a negative feedback loop. This is in agreement with Keating et al. (Reference Keating, Kennelly and Zhao2006), who showed that the SCD1 promoter activity was downregulated by C18:1 cis-9 in MAC-T cells. Similarly, it has been reported that C18:1 cis-9 inhibits both SCD1 expression (Kadegowda et al., Reference Kadegowda, Bionaz, Piperova, Erdman and Loor2009) and SCD1 activity (Jayan and Herbein, Reference Jayan and Herbein2000) in MAC-T cells. These results are consistent with the notion that SCD1 regulates both membrane- and milk fat fluidity by maintaining a rather constant C18:0/C18:1 cis-9 ratio (Ntambi, Reference Ntambi1999).
C18:1 trans-11 can be readily converted by SCD1 to C18:2 cis-9, trans-11 CLA (Ntambi and Miyazaki, Reference Ntambi and Miyazaki2004). When C18:1 trans-11 was added to the MAC-T cells, we found no significant effect on SCD1 expression. Keating et al. (Reference Keating, Kennelly and Zhao2006) also observed no alterations in the promoter activity of SCD1 in MAC-T cells treated with C18:1 trans-11. Interestingly, Jayan and Herbein (Reference Jayan and Herbein2000) provided evidence that addition of C18:1 trans-11 to MAC-T cells increased SCD1 activity. We observed that C18:1 trans-11 resulted in lower proportions of C18:1 cis-9 and higher C18:2 cis-9, trans-11 CLA in the MAC-T lipids. This supports the idea that C18:1 trans-11 competes with C18:0 for desaturation by SCD1. It could be favourable for cells to consume the invaded C18:1 trans-11 to generate C18:2 cis-9, trans-11 CLA, which has a less rigid structure and is more fluid in nature, to warrant fluidity of cell membranes.
It is well known that n-3 and n-6 PUFA decreases hepatic SCD1 expression in rodents (Ntambi, Reference Ntambi1999). In addition, C18:2 cis-9,12 decreases SCD1 expression in mammary gland of mice (Singh et al., Reference Singh, Hartley, McFadden and Mackenzie2004). In our study, both C18:2 cis-9,12 and C18:3 cis-9,12,15 treatments decreased SCD1 expression in bovine mammary epithelial cells, similar to rodents. Of interest, we found recently that supplementing the diet of dairy cows with soya bean oil (mainly C18:2 cis-9,12) decreased SCD1 mRNA expression in the mammary gland compared with rapeseed oil (mainly C18:1 cis-9) or linseed oil (mainly C18:3 cis-9,12,15; Jacobs et al., Reference Jacobs, van Baal, Smits, Taweel, Hendriks, van Vuuren and Dijkstra2011), which is consistent with this study.
As an indirect measurement of SCD activity, we calculated the Δ9-desaturase index from the FA composition in MAC-T cells as C16:1 cis-9/(C16:0 + C16:1 cis-9) or C18:1 cis-9/(C18:0 + C18:1 cis-9). Application of C16:0 increased both C16:0 content and C16 desaturase index, indicating that the supplied C16:0 was taken up and readily converted to C16:1 cis-9 by SCD1 in MAC-T cells. The C16 desaturase index was, however, not related to the relative mRNA abundance of SCD1 (r 2 = 0.05; P = 0.28). On the contrary, we observed a significant relationship between the C18 desaturase index and relative SCD1 mRNA abundance (r 2 = 0.42; P < 0.001). This indicates that the C18 desaturase index is a better indicator of SCD activity than the C16 desaturase index, when calculated from total lipids extracted from bovine mammary epithelial cells. Notably, we previously demonstrated modest relationships between mRNA levels of SCD1 in biopsies of the bovine mammary gland and the C16 or C18 desaturation index (r 2 of 0.35 and 0.39, respectively; Jacobs et al., Reference Jacobs, van Baal, Smits, Taweel, Hendriks, van Vuuren and Dijkstra2011), as calculated from total lipids extracted from the milk, whereas others reported that Δ9 desaturation indices were poor predictors of SCD activity (Bionaz and Loor, Reference Bionaz and Loor2008; Invernizzi et al., Reference Invernizzi, Thering, McGuire, Savoini and Loor2010). Interestingly, the relationship between SCD1 expression in bovine milk somatic cells and the C16 or C18 desaturation index was somewhat better than the relationship between SCD1 expression in biopsies of mammary gland and these indices (Jacobs et al., Reference Jacobs, Dijkstra, Hendriks, van Baal and van Vuuren2013). We concluded that SCD1 mRNA expression in milk somatic cells could provide a better reflection of SCD1 activity in the mammary gland compared with the expression measured in bovine mammary tissue obtained from biopsy.
Similar to SCD1, both C18:2 cis-9,12 and C18:3 cis-9,12,15 downregulated ACACA mRNA expression in MAC-T cells. FASN mRNA expression displayed a similar trend as ACACA but that of FASN was only numerically lower with addition of C18:2 cis-9,12 or C18:3 cis-9,12,15 compared with control. In rodents, it is known that PUFA supplementation inhibits expression of genes involved in de novo lipid synthesis, including ACACA and FASN (Jump and Clarke, Reference Jump and Clarke1999).
The expression patterns across all treatments for ACACA, FASN and SCD1 showed a quite similar trend. Furthermore, r 2 values of the correlations between relative expression of the different lipogenic genes were rather high (range r 2: 0.72 to 0.81; P < 0.001), which supports the idea that these lipogenic genes are regulated by common transcription factors. The SREBF family are encoded by SREBF1 and SREBF2 and consist of members of transcription factors that act as master regulators of lipid and cholesterol metabolism by controlling the expression of a range of enzymes required for endogenous cholesterol, FA, triacylglycerol and phospholipid synthesis (Ma and Corl, Reference Ma and Corl2012). In the presence of sterols, SREBF1 is effectively inhibited by INSIG1, preventing the transport of SREBF1 to the Golgi apparatus and blocking the proteolytic activation of SREBF1 (Dong et al., Reference Dong, Tang and Chen2012). The expression levels of these genes are functionally linked as both SREBF1 and INSIG1 genes contain sterol- and PPAR-responsive elements in their proximal promoter (Kast-Woelbern et al., Reference Kast-Woelbern, Dana, Cesario, Sun, de Grandpre, Brooks, Osburn, Reifel-Miller, Klausing and Leibowitz2004). Thus, the mRNA abundance of INSIG1 and SREBF1 can be considered as a reflection of the degree of transcriptionally active SREBF1. In our study, SREBF1 and INSIG1 mRNA were indeed expressed in parallel to those of the lipogenic genes (i.e. SCD1, ACACA and FASN) and the r 2 values of the correlations between both SREBF1 and INSIG1 and the lipogenic genes were moderate to high (range r 2: 0.49 to 0.86; P < 0.001). A similar relationship between SREBF1 and INSIG1 mRNA expression was observed in vivo in the bovine mammary gland after dietary intake of C18:2 trans-10, cis-12 CLA (Harvatine and Bauman, Reference Harvatine and Bauman2006), providing strong support for SREBF1 as a central signalling pathway regulating FA synthesis in the bovine mammary gland (Ma and Corl, Reference Ma and Corl2012). Our findings are also most consistent with a model in which PUFA suppress the expression of lipogenic genes by decreasing the nuclear content of transcription factor SREBF1 through inhibition of the proteolytic processing of SREBF1 in the Golgi apparatus (Xu et al., Reference Xu, Teran-Garcia, Park, Nakamura and Clarke2001; Takeuchi et al., Reference Takeuchi, Yahagi, Izumida, Nishi, Kubota, Teraoka, Yamamoto, Matsuzaka, Nakagawa, Sekiya, Iizuka, Ohashi, Osuga, Gotoda, Ishibashi, Itaka, Kataoka, Nagai, Yamada, Kadowaki and Shimano2010). Alternatively, PUFA may also modulate the interaction of lipogenic transcription factors with the promoter of lipogenic genes directly, as reported for the hepatic FASN gene (Teran-Garcia et al., Reference Teran-Garcia, Adamson, Yu, Rufo, Suchankova, Dreesen, Tekle, Clarke and Gettys2007). Since C18:2 cis-9,12 or C18:3 cis-9,12,15 could not affect promoter activity of SCD1 in MAC-T cells (Keating et al., Reference Keating, Kennelly and Zhao2006), we postulate that these PUFA imping upon SREBF1 activity rather than acting directly at the level of the SCD1 promoter to reduce SCD1 mRNA abundance in bovine mammary gland cells (Table 1).
The members of the PPAR family, designated as PPARA, PPARG and PPARD, are well-known transcription factors that act as lipid sensors to target genes involved in lipid homeostasis, including SREBF1, FASN, SCD1 and ACACA (Feige et al., Reference Feige, Gelman, Michalik, Desvergne and Wahli2006; Kang et al., Reference Kang, Hatano and Lee2007; Rakhshandehroo et al., Reference Rakhshandehroo, Knoch, Müller and Kersten2010). In our study, PPARA and PPARD transcript levels were not affected by the treatments, which may suggest that the PPARA and PPARD regulatory pathway are not involved in the inhibitory action of PUFA on ACACA and SCD1 expression. In contrast to the native mammary gland, PPARG was not expressed in our MAC-T cells. As others did report evidence for PPARG expression by PCR and effects of PPARG agonist rosiglitazone on gene expression in MAC-T cells (e.g. Kadegowda et al., Reference Kadegowda, Bionaz, Piperova, Erdman and Loor2009), it is conceivable that in our MAC-T cells the isoform is downregulated upon culturing. Our cell model suggests that PPARG expression is not a prerequisite for the inhibitory effect of PUFA on the mRNA expression of ACACA and SCD1 in bovine mammary epithelial cells.
In conclusion, we demonstrated a significant stimulatory effect of Ac but not BHBA on the mRNA expression of ACACA and SCD1 in cultured bovine mammary epithelial cells, suggesting that Ac increases de novo synthesis and desaturation of FA in the bovine mammary gland. The opposite effect of the PUFAs C18:2 cis-9,12 and C18:3 cis-9,12,15 on these two genes and the failure of Ac to mimic the PUFA-inhibited SREBF1 and INSIG1 expression, suggests that Ac can stimulate lipogenesis in the bovine mammary gland via a transcriptional regulatory mechanism different from PUFA.
Acknowledgements
Financial support of the Food and Nutrition Delta program of Senter Novem (The Hague, The Netherlands), Royal FrieslandCampina (Amersfoort, The Netherlands), Agrifirm Group, Apeldoorn, The Netherlands), Agrifirm Innovation Center (Apeldoorn, The Netherlands), Barenbrug Holland bv. (Nijmegen, The Netherlands) and the Animal Nutrition Group of Wageningen University (Wageningen, The Netherlands) is gratefully acknowledged. Also, the authors are grateful to Courtney L. Preseault (Department of Animal Science, Michigan State University, East Lansing, USA) for performing the FA analysis.