

Archaeological evidence indicates that the trade of prismatic blades in Mesoamerica began as early as the Archaic period (ca. 4000 b.c.) (Macneish et al. Reference Macneish, Nelken-Terner and Johnson1967:22; Neiderberger Reference Niederberger1976). By the Early Formative period, prismatic blades were exchanged widely from central Mexico to the Olmec region (Cobean et al. Reference Cobean, Coe, Perry, Turekian and Kharkar1971) and the Valley of Oaxaca (Parry Reference Parry1987). However, it was not until the Late Formative period (400 b.c.—a.d. 100) that obsidian prismatic blade cores began to be traded extensively across the region. Archaeologists have typically considered the presence of prismatic blades and the absence of blade cores to constitute evidence for blade trade. A general consensus is that blade trading preceded the trade of cores by close to a millennium (Clark Reference Clark, Johnson and Morrow1987; Clark and Lee Reference Clark, Lee and Hirth1984; Jackson and Love Reference Jackson and Love1991). However, this issue has never been examined critically. To better address the issue, two important questions must be asked; (1) what does blade trade look like in the archaeological record, and (2) how can blade trade be distinguished from other potential distribution systems?
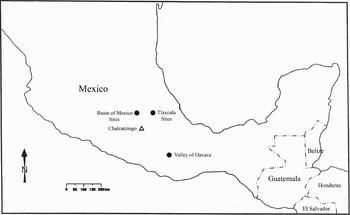
This paper examines how obsidian prismatic blades were exchanged throughout Formative period Mesoamerica using the distributional approach (Hirth Reference Hirth1998). The distributional approach reconstructs forms of exchange by examining the differential distribution of commodities (finished blades) and related production debris within contexts of economic consumption (Hirth Reference Hirth1998:454). Systematic comparison of obsidian blades and blade production by-products from sites in the Valley of Oaxaca, the Basin of Mexico, and Tlaxcala (Figure 1) provides a means of modeling how these different areas were provisioned during the Formative period. The information presented here suggests that obsidian blade trade may have taken several different forms.
Map of sites discussed in text.

Three issues are addressed in the following discussion. First, how is blade trade identified in the archaeological record and was there more than one form of blade trade across Mesoamerica? Second, what behavioral models of obsidian production and exchange explain the distribution of prismatic blades during the Formative period? Finally, what do the actual data from the Formative period tell us about the distribution of obsidian blades? We begin with a discussion of blade trade and how it may produce differences in blade assemblages over space. We describe three distributional models for obsidian prismatic blades: whole-blade trade, processed-blade trade, and local-blade production. We then evaluate these models using obsidian consumption data from Oaxaca, the Basin of Mexico, and Tlaxcala. We conclude with a discussion of the implications of these findings and suggest possibilities for future research on the trade of this essential commodity within pre-Hispanic Mesoamerican economies.
MODELING BLADE TRADE
The evolution of Formative period blade trade has been characterized as a three-step process. Stage 1 was the exchange of flake cores for expedient tool production (Clark Reference Clark, Johnson and Morrow1987:261–265, Reference Clark and Voorhies1989: 218–222; Clark and Lee Reference Clark, Lee and Hirth1984:236–238; Coe and Flannery Reference Coe and Flannery1967:63). Stage 2 was the addition of formed prismatic blades to this exchange system (Awe and Healy Reference Awe and Healy1994; Clark and Lee Reference Clark, Lee and Hirth1984:225). Stage 3 was the replacement of obsidian blade trade with the exchange of obsidian cores so that prismatic blades could be manufactured locally (see Clark Reference Clark, Johnson and Morrow1987). Jackson and Love (Reference Jackson and Love1991:48) provided a succinct description of this proposed evolutionary sequence:
The history of obsidian tool industries in some areas may begin with the initial use of imported obsidian for the manufacture of flake tools, followed by a period during which finished prismatic blades were imported and added to the flaked stone tool kit, and, finally, the introduction of the technology and materials for the local manufacture of prismatic blades.
Although Jackson and Love are referring specifically to the La Blanca region of Guatemala, many have made similar statements about the spread of prismatic blades and production technology across Mesoamerica during the Formative period (see Clark Reference Clark, Johnson and Morrow1987 for the Olmec area; De León and Carballo Reference De León2003 for Tlaxcala; Parry Reference Parry1987:37 for the Valley of Oaxaca).
We argue that this trajectory, although helpful in framing blade trading in general comparative terms, is ultimately overly simplistic and can be improved. First, the existing framework generalizes the evolution of obsidian trading across a culturally heterogeneous Mesoamerican landscape. Political, social, and environmental factors likely had an impact on the extent and structure of trade relationships during the Formative period, as they did later in Mesoamerica (see Hirth Reference Hirth2000, Reference Hirth, Hirth and Andrews2002; Johnson Reference Johnson and Odell1996; Parry Reference Parry2001; Pastrana Reference Pastrana, Hirth and Andrews2002). We must take caution not to oversimplify what was a likely complex and regionally varied phenomenon. Second, the spread of new technologies are never uniform and thus cannot easily be explained by broad developmental stages (see Barnett Reference Barnett1953). Given the conservative nature of preindustrial technologies and a relative paucity of Early Formative period data, we should be cautious about applying a generalized model to a chronological period that spans over a thousand years and several thousand square kilometers. Finally, the existing three-stage developmental model fails to account for different types of blade trading that may have occurred prior to the exchange of blade cores. We will argue that multiple forms of blade trade likely existed, each with its own characteristic archaeological signature. However, before we can discuss these forms in detail, it is necessary to highlight the criteria that we will use to identify blade trade.
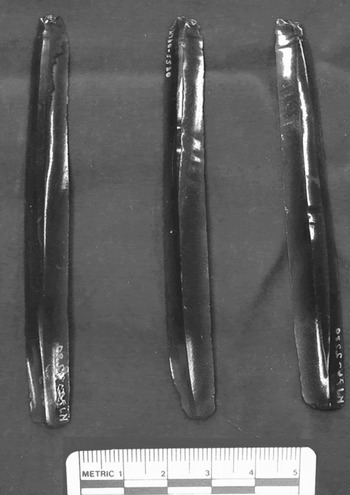
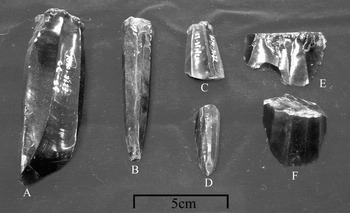
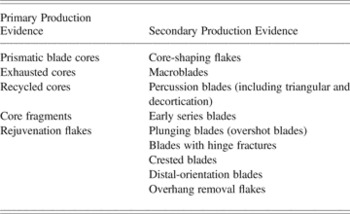
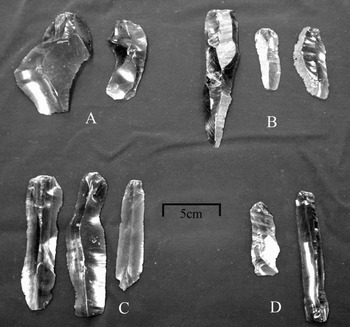
We define blade trade as the exchange of prismatic blades without the cores needed to produce them. The evidence often used to infer blade trade is the presence of late series pressure blades (Figure 2) and the absence of prismatic cores (complete, exhausted, or recycled) (Figure 3) in archaeological assemblages (Clark Reference Clark, Johnson and Morrow1987:262; Jackson and Love Reference Jackson and Love1991:48, 53). Here we refer to blade cores, exhausted cores, recycled cores, platform rejuvenation flakes, and core fragments as primary production evidence (Table 1). It is important to note, however, that the absence of cores does not eliminate the possibility that blades were produced locally. Human hoarding and/or recycling behavior can often obscure the presence of blade cores in the archaeological record.
Late series pressure blades.

(a and b) Blade cores; (c) proximal section of a blade core; (d) distal tip of a blade core; (e) platform rejuvenation flake; (f) blade core fragment. All of these artifacts are considered primary production evidence of on-site blade manufacture.

Summary of the primary and secondary evidence used to infer prismatic blade production

Source: Based on Clark and Bryant Reference Clark and Bryant1997 and Hirth, Andrews, and Flenniken Reference Hirth, Andrews, Flenniken and Hirth2006.
Likewise, the presence of blade cores is not the only evidence for the reliable identification of on-site production; other lithic artifacts can be useful. These include the by-products associated with core shaping and maintenance (core-shaping flakes, decortication blades, macroblades, percussion blades, early series pressure blades) (Figures 4 and 5), production errors (plunging blades, blades with hinge fractures), and the correction of production errors (crested blades, distal orientation blades, overhang removal flakes). We refer to these artifacts of blade manufacture as secondary production evidence (Table 1). Therefore, to confidently infer that blades were traded rather than produced locally, neither primary nor secondary production evidence should be present. However, this is not an absolute rule because many secondary production artifacts also make good tools. Parry (Reference Parry1987:37) has noted that percussion blades and early series blades were occasionally traded as finished tools into the Valley of Oaxaca. We return to this point in the discussion of the local-blade production model. In the following section, we offer three behavioral models to explain the distribution of prismatic blades. Because models are intended to be simplified versions of reality, we describe our models as being wholly separate and independent of each other when, in fact, it is likely that multiple forms of blade exchange and production developed and coexisted side by side.
Some examples of secondary production evidence. (a) Macroflakes; (b) triangular decortication blades; (c) triangular percussion blades; (d) first series pressure blades.

Macroblades.

WHOLE-BLADE TRADE MODEL
The whole-blade trade model assumes that complete blades were exchanged without a corresponding trade in obsidian cores. Instead, prismatic blades were produced in one locale and then exchanged as complete nonsegmented tools to other sites. By complete nonsegmented tools, we mean that blades were not broken into smaller sections prior to their exchange. After whole blades entered a consumption context, they would have been used or processed into tools by their respective consumers.
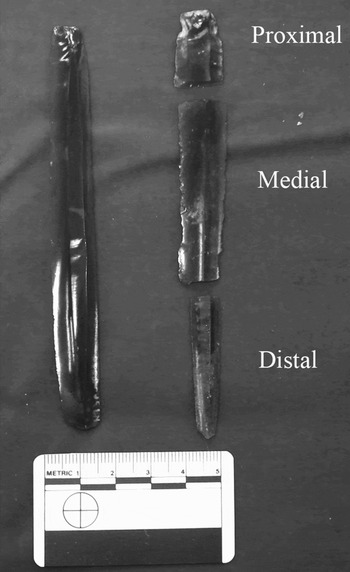
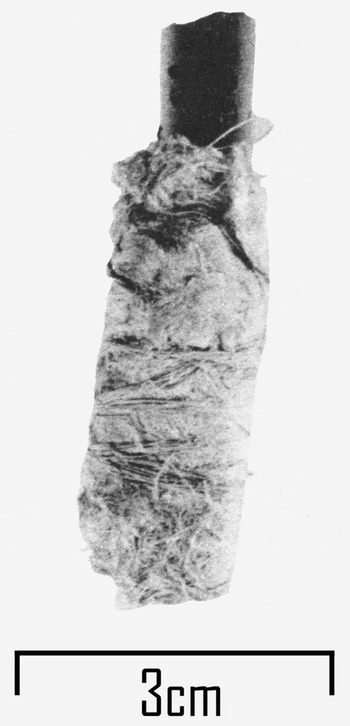
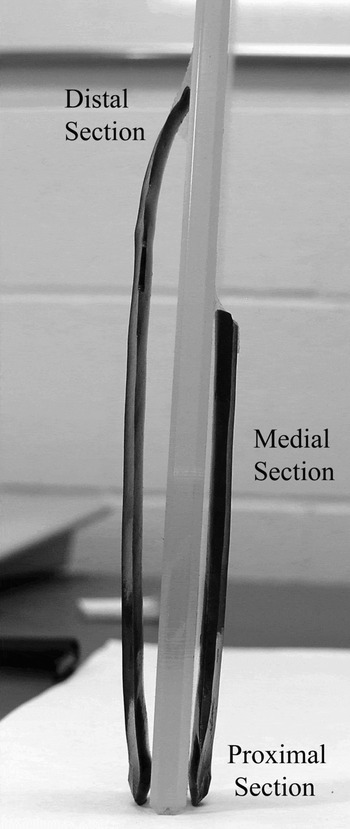
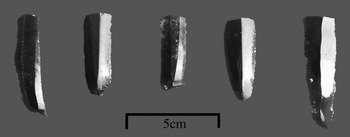
All complete prismatic blades have both a proximal and a distal end. It is the process of segmentation or breakage that produces proximal, medial, and distal segments (Figure 6). Medial segments are the midsections of blades that were highly desired because of their flatness. The desirability of flat medial segments was probably due to the ease with which they could be hafted onto wood implements, such as knife handles (Figure 7). To create flat medial sections, it is necessary to remove the often curved (due to the shape of the core) distal section (Figure 8) and the bulky (due to the bulb of percussion) proximal section of a blade. Medial sections can be further processed into smaller tools. Although complete blades are not common in the archaeological record, they can be, and were, used as tools (see Anderson and Hirth Reference Anderson and Hirth2008; Sheets Reference Sheets and Sheets2002:Table 14.1).
A comparison of a whole prismatic blade and one that has been segmented.

An example of a hafted blade fragment from the Tehuacan Valley (from Macneish et al. Reference Macneish, Nelken-Terner and Johnson1967:Figure 10).

This figure highlights the curvature created by the distal section of a blade. Curved blades are often susceptible to accidental breakage. The removal of the curved distal section creates a flat medial segment.

A logical assumption is that the removal of the proximal and distal ends of a blade for transport or hafting purposes would result in one proximal, one medial, and one distal segment. This would create a blade segment ratio of 1:1:1 (proximal-medial-distal). Although reasonable, an equal frequency of proximal, medial, and distal segments is not typically observed in archaeological contexts, nor should we always expect it. Postdepositional processes and consumption behavior work to skew the idealized ratio. Additionally, production techniques can also result in the loss of many distal tips when blades fall and break on hard floor surfaces during manufacture. Moreover, because one large blade can produce many usable medial segments, such segments often dominate blade assemblages. Unfortunately researchers often fail to distinguish between proximal, medial, and distal blade segments or do not clarify the criteria used to identify segments in published reports (e.g., whether a distal section needs the tip or a proximal section needs the platform to be classified as such). Similarly, blade segment ratios can be difficult to use comparatively when small unusable blade fragments created by breakage are classified as medial segments, inflating segment ratios. Especially critical both to this model and our processed-blade trade model is what constitutes a distal blade section.
Distal segments are the delicate ends of blades that were detached from the core after a fracture was initiated at the platform (or proximal) end. Depending on the shape of the core, the ventral surface of distal sections may be curved or straight with a feathered, pointed, or truncated termination (Figure 9). Despite the fact that there should be one distal segment for every proximal segment, distal segments are often underreported or missing from the archaeological record. This is because their curvature and shape make them more fragile than proximal or medial segments. Distal segments can break off during production or in transport, or they may disintegrate during use. Feathered and pointed terminations are very fragile and may break into pieces that are difficult to identify as parts of prismatic blades. Another analytical problem in using blade segment ratios has to do with discrepancies in the way analysts classify technological types; some analysts, for example, may call a blade complete if it is 90% intact even if it lacks a distal end. Additionally, distal ends are easier to lump into less diagnostic flake categories, particularly in assemblages representing mixed production activities. This is because distal segments lack many of the more diagnostic blade attributes of proximal and medial segments.
Examples of different types of distal segments.

To understand how to use and interpret blade segment ratios, we need to examine production areas where whole-blade production and purposeful segmentation occurred. Although data from workshops are biased because many blade segments are removed for use elsewhere, these contexts are areas where both proximal and distal segments are systematically snapped off to produce medial sections or blade tools. Even though medial segments may be gone, proximal and distal segments may remain, reflecting the processing of whole prismatic blades. Currently, the best data we have for whole-blade processing during the Formative period comes from the obsidian workshop at Chalcatzingo, Morelos. In an idealized production context, we would expect to find proximal-distal ratios of 1:1 and medial-distal ratios of 1:1. However, given that one blade can usually produce more than one usable medial segment, we should expect a medial-distal ratio higher than 1:1. We argue that idealized production contexts should have segment ratios of 1:1 (proximal-medial) and 2–3:1 (medial-distal). At Chalcatzingo, Susan Burton (Reference Burton and Grove1987:Table 19.1) identified and analyzed 15,068 blade segments, 35% of which were proximal segments, 43% were medial sections, and 22% were distal segments. The proximal-distal ratio for this workshop is 1.6:1. The medial-distal ratio is 1.95:1 (Table 2). Because of the large number of blades (whole and segmented) and the presence of associated manufacturing debris, we interpret the Chalcatzingo data to represent a context where blades were produced for local consumption. Burton's percentages, therefore, conform to our expectations that distal sections will be underrepresented even in contexts where we would expect them to equal the number of proximal sections.
Segment ratio expectations of our whole-blade trade model vs. observed ratios from the Chalcatzingo workshop production area

Both ratios are used as points of comparison for inferring whether whole-blade trade was occurring. The whole-blade trade ratios are based on an idealized production ratio of blade segments. The Chalcatzingo totals are based on Burton (Reference Burton and Grove1987).
We propose that two lines of evidence be used to evaluate the whole-blade trade model. Obviously, the presence of whole blades in the absence of production debris would be strong support for this model. However, because of the way blades were used, we rarely find complete blades in consumption contexts. A second line of evidence for this model can thus be found in the relative ratios of proximal, medial, and distal sections. We are most interested in the proximal-distal and the medial-distal ratios of third series blades (Clark and Bryant Reference Clark and Bryant1997).
Blade segment ratios provide information to identify the form in which blades were traded and whether particular segments were favored over others. For example, a hypothetical assemblage of blades characterized by 80% medial segments, 15% proximal segments, and 5% distal segments would have a proximal-distal ratio of 3:1 and a medial-distal ratio of 16:1. We argue that under the whole-blade trade model, one would expect to find proximal-distal ratios close to 1:1 and medial-distal ratios close to 2–3:1. We can apply these expected ratios to what is observed archaeologically. Although these ratios are hypothetical constructs, they are logical given our understanding of how proximal and distal segments preserve in archaeological contexts.
As discussed previously, a perfect proximal-distal ratio of 1:1 should not be expected in all contexts. There are three reasons for this. First, proximal sections are typically thicker and flatter than distal sections and may be more frequently used as tools, rather than being removed and discarded. Second, because proximal sections are more robust, they preserve well in the archaeological record. Third and finally, distal segments are usually underreported in archaeological collections because of breakage and the difficulty of identifying them. For this analysis, we use the ideal proximal-distal segment ratio of 1:1 as a baseline for comparison with the understanding that few data sets are likely to match it perfectly. We use the segment ratios identified at Chalcatzingo as a secondary data set to check the expected ratios of the blade assemblages we examine.
Even though we argue for the utility of blade segment ratios in identifying whole-blade trade, proximal-distal and medial-distal ratios must be examined in tandem because reliance on only one can be misleading. For instance, the removal of distal and/or proximal segments prior to exchange will produce assemblages with many medial segments and very few proximal and distal segments. An example would be an assemblage with 20 proximal segments, 450 medial segments, and 15 distal segments. If we only examined the proximal-distal ratios (1.3:1), we could conclude that whole blades were being traded. However, if we examine the medial-distal ratio (30:1), we see that distal segments are generally missing from our assemblage and thus blades were segmented prior to exchange. A comparison of proximal-distal ratios with medial-distal ratios is a good way to check for this phenomenon. To summarize, when whole-blade trade occurs, we expect to find third series blades, no evidence of production, the occasional whole blade, proximal-distal ratios of 1:1, and medial-distal ratios around 2–3:1. We can use the observed Chalcatzingo production context ratios (1.6:1 proximal-distal, 1.9:1 medial-distal) as a second baseline from which to compare other observed ratios (see Table 2 for summary).
PROCESSED-BLADE TRADE MODEL
The processed-blade trade model posits that blades were segmented prior to being transported for trade. Such segmentation would likely involve the removal of the often curved distal end of a prismatic blade (Figure 8). The degree of distal curvature is directly related to the shape of the core from which it is removed. Several factors influence the shape of the core. They include (1) the shape of the initial stone used to create the core, (2) the techniques used to produce blades, and (3) the stage of production of the core. Early stage cores can have relatively straight sides and near exhausted cores tend to have tapered ends. Crabtree (Reference Crabtree1968:466) noted: “as the core becomes smaller, the curvature of the blade increases.”
Because not all distal ends are curved, we argue that only those with strong curvature would be removed. This removal would have two advantages. First, blades pack easier without their distal section. Curved blades do not pack well, especially if they are stacked or rolled in an animal skin or cloth. For the Valley of Oaxaca, Flannery and Marcus (Reference Flannery and Marcus2005:67) provided some insight into how blades were moved during the Archaic period:
We cannot be sure how the fragile blades were transported from their sources, but MacNeish has provided a clue. In one of his dry Tehuacán caves he found that obsidian blades had been laid out on a strip of cloth, which was then rolled up so as to produce a cylindrical package in which no blade touched another.
This packaging of blades is similar to what has been observed ethnographically among Australian aborigines by Paton (Reference Paton1994). He found that large quartzite blades were individually wrapped in sheaths of thin bark and then tied together in a bundle to facilitate transportation (1994:177). Some of these blades had their distal ends retouched into square shapes (1994:175). When these blades were found in consumption contexts, the majority of them had been purposefully segmented into small square pieces (1994:176).
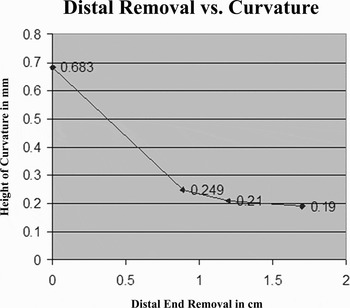
The second advantage of distal removal is that curved blades may break in unpredictable ways that can reduce the utility of a blade (see Figure 8). Blades without distal sections are flatter and less likely to break in transport. Figure 10 shows that by removing only a small portion of the distal end you can sharply decrease a blade's curvature. The removal of the distal section does not generally reduce a blade's overall utility or desirability because curved segments are both difficult to haft and a poor choice for straight cutting or other tool uses such as a projectile point blanks (Boksenbaum Reference Boksenbaum1978:225).
This graph shows the relationship between blade curvature and distal end removal. A complete blade with a significant amount of distal curvature was measured. The total blade length was 12.48 cm. By removing less than 1 cm of the total blade length, we were able to reduce distal curvature by 63%.

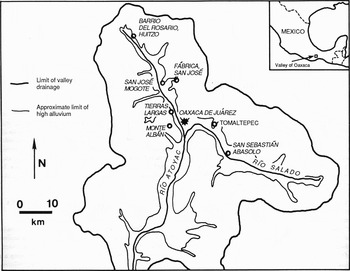
Map of archaeological sites in the Valley of Oaxaca (from Parry Reference Parry1987:Figure 1).

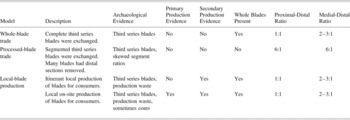
Processed-blade trade is thus defined as the exchange of late series pressure blades that have had their distal (and sometimes proximal) sections removed. When processed blades were traded, we would expect to find third series pressure blades moving over the landscape without distal sections and not associated with primary or secondary evidence of blade production. At sites receiving blades, we expect that both proximal-distal and medial-distal ratios would be high because most distal segments would have been removed. We expect proximal-distal ratios in the neighborhood of 6:1. Medial-distal ratios should be similarly high (6:1) or higher depending on how many medial segments are produced per blade (see Table 3 for summary).
Summary of blade trade models and their corresponding archaeological evidence

LOCAL-BLADE PRODUCTION MODEL
The two previous models only address the trade of finished blades. Another possibility is that blades were produced locally either by itinerant craftsmen or local craftsmen living within the region. By itinerant craftsmen, we mean individuals who traveled with obsidian throughout Mesoamerica producing blades where they were required. Clark (Reference Clark, Johnson and Morrow1987) discussed this scenario as one of the possible ways that blades and blade production technology spread during the Formative period. Local craftsmen, in contrast, are individuals who live permanently in the region and obtain the obsidian they use for production through trade or by periodic visitation to source areas. The wide range of goods moving across Mesoamerica during the Formative period (Cobean et al. Reference Cobean, Coe, Perry, Turekian and Kharkar1971; Drennan Reference Drennan1984; Hirth Reference Hirth1984; Pires-Ferreira Reference Pires-Ferreira1975) and the apparent skill required to produce prismatic blades (Clark Reference Clark, Johnson and Morrow1987:267–268; Crabtree Reference Crabtree1968) make it important to consider itinerant and local craftsmen together as alternative ways to obtain prismatic blades. Although debate continues over the role of elites in the production and exchange of Formative period obsidian blades (Clark Reference Clark, Johnson and Morrow1987; De León Reference De León and Carballo2008; Hirth Reference Hirth2008a; Knight Reference Knight and Pool2004; Santley Reference Santley and Hirth1984, Reference Santley, Santley and Hirth1993; Winter and Pires-Ferriera Reference Winter, Pires-Ferriera and Flannery1976), elite involvement does not directly affect the type of material remains to be recovered. We recognize that elites may have been sponsors or coordinators of either itinerant or local craftsmen, but we do not address this issue here (see De León Reference De León and Carballo2008 for a recent examination of this issue).
Under the local-blade production model, prismatic blades would be removed from preshaped cores for on-site consumers either within the communities where they are found or in a nearby community. Because many blades can be produced from one core (more than any single consumer could use in a reasonable amount of time) (Clark Reference Clark, Johnson and Morrow1987:272), these cores always remained in the possession of the craftsmen. Where itinerant craftsmen are producing these blades we would expect to find (1) third series blade segment ratios and some complete blades indicative of localized manufacturing, and (2) some secondary production evidence. We would not expect to find much primary production evidence because blade cores would remain in the possession of itinerant craftsmen. Proximal-distal (1:1) and medial-distal (2–3:1) ratios should be similar to those of our whole-blade model. Where local craftsmen are manufacturing blades, production evidence could be more varied. We would expect primary production evidence to be found, as well as secondary production evidence from core shaping, error correction, and core rejuvenation (recycling). When local production is occurring, we might also expect to see high numbers of production-related artifacts (e.g., percussion blades, crested blades, and stunted blades) entering into local trade networks to be used as tools (see Table 3 for summary).
The key distinction between the whole-blade trade and local-blade production model is the presence of production evidence (primary and/or secondary) in the latter. Although we posit that itinerant merchants could have been responsible for blade production in some instances, we also recognize the difficulty of distinguishing whole-blade trade and local-blade (itinerant) production. The problem is that both models have similar blade frequencies and the local-blade (itinerant) production model can theoretically produce no primary and very little secondary production evidence. To overcome this issue of equifinality, we suggest that to infer local-blade (i.e., itinerant) production, the type and frequency of secondary production artifacts has to be carefully examined. For example, in his recent study of obsidian at the Olmec site of San Lorenzo, De León (Reference De León and Carballo2008) identified pressure blade segment frequencies similar to the whole-blade trade model in one domestic context (area D4-22). Additionally, a few second series blades and two crested blades were also found alongside these pressure blades. Because of their low frequency (relative to pressure blades) and the fact that all of these secondary production artifacts could have been used as tools, De León argued that this was evidence of whole-blade trade, not on-site or itinerant production. The point is that case-by-case analyses of the types of secondary production evidence found at a site are needed to identify the trading behavior that was responsible for the presence of blades. Crested or percussion blades alone are not strong evidence for the local-blade production. Secondary production artifacts that have no obvious tool use must also be present in the assemblage. This issue is addressed further in the following sections.
DATA
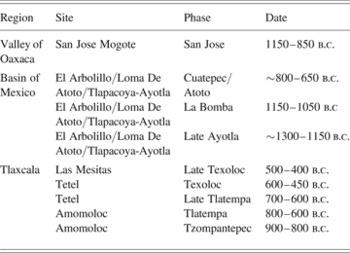
To evaluate these three models, we use Formative period household consumption data from three regions: the Valley of Oaxaca, the Basin of Mexico, and Tlaxcala (Figure 1). These regions were chosen because communities in all three received and used obsidian prismatic blades during the Early and Middle Formative periods (see Table 4 for regional chronology), providing appropriate, comparative data sets with which to evaluate our models.
Chronology for sites discussed in the text

Dates are based on Boksenbaum (Reference Boksenbaum1978), Lesure et al. (Reference Lesure, Borejsza, Carballo, Frederick, Popper and Wake2006), and Parry (Reference Parry1987).
Valley of Oaxaca
The Valley of Oaxaca (Figure 9) is located in the southern Mexican highlands and has a long history of archaeological investigations focused on the Formative period (Drennan Reference Drennan and Flannery1976; Flannery Reference Flannery1976; Flannery and Marcus Reference Flannery and Marcus2005; Marcus Reference Marcus1998; Marcus and Flannery Reference Marcus and Flannery1996). Although the Valley of Oaxaca is located 250 km from the nearest obsidian source (Parry Reference Parry1987:17), raw obsidian and finished tools were arriving there as early as the San Jose phase (1150–850 b.c.) (1987:10). Here we focus on data drawn from Parry's (1987) analysis of blade consumption in 10 San Jose–phase households.
The largest village reported for the San Jose phase is San Jose Mogote, which appears to have been divided into four residential wards (Flannery and Marcus Reference Flannery and Marcus2005; Parry Reference Parry1987:10). We focus here on the 10 households located in wards A, B, and C. Nine of these were nonelite households (Table 5) and one was an elite house with an attached workshop (House 16–17 Upper Terrace [H16-17/UT]) (Flannery and Marcus Reference Flannery and Marcus1994:339). All of the blade fragments included in this analysis originated from interior household earthen floors or exterior house yard proveniences (Parry Reference Parry1987:7). Because the nine nonelite households contained only small quantities of blades, we combined their totals and analyzed them as a single assemblage (for contextual information see Parry Reference Parry1987:10–12).
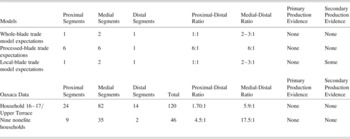
Summary of Oaxaca blade totals and ratios along with the expectations for all three proposed models

The nine nonelite households we examined were SJM-MD 1/House 13, SJM-A/House C, SJM-A/House C2, SJM-A/House C3, SJM-A/House C4, SJM-C/House 2, SJM-C/House 6, SJM-C/House 7, and SJM-C/House 10 (see Parry Reference Parry1987).
The 10 houses examined yielded 185 identifiable prismatic blade segments. No primary production evidence was found in any of the Formative period households. As Parry (Reference Parry1987:37) noted:
No blade core fragments, blade core rejuvenation flakes, plunging blades, or blades with distinctive manufacturing breaks were present in any Formative provenience I examined at any excavated site in the Valley of Oaxaca. … The absence of characteristic manufacturing debris indicates that blades were not produced at any of the excavated Formative proveniences, but were imported as finished tools.
Nevertheless, Parry (Reference Parry1987:37) did identify “a few macroblades and small percussion blades” with heavy use wear. Because these blade production by-products can be used as tools, he argued that they were trade items and did not signal on-site blade production (Parry Reference Parry1987:37; also see Anderson and Hirth [2008] and Sheets [2002] for discussions of percussion blade tool use). The absence of production evidence suggests that blades probably were not produced by local or itinerant craftsmen. The feasibility of the whole-blade and processed-blade trade models can be evaluated using blade segment ratios.
Evaluating the models
We look first at the elite household (H16-17/UT) that yielded 120 identifiable blade segments (24 proximal, 82 medial, and 14 distal segments). No whole blades were found. The proximal-distal ratio is 1.7:1, and the medial-distal ratio is 5.9:1 (Table 5). The observed proximal-distal segment ratio for H16-17/UT is not too far removed from our whole-blade trade ratio (1:1), as well as resembling the proximal-distal ratio observed for Chalcatzingo (1.6:1). However, when we examine the medial-distal ratio for H16-17/UT, a different pattern emerges. If whole blades were traded, we would expect to see a medial-distal ratio around 2–3:1. Instead the medial-distal ratio is 5.9:1, which is much closer to the expected ratio for processed-blade trade (6:1). The proximal-distal ratio is misleading because of the small sample size (n = 38). However, when we examine proximal-distal and medial-distal ratios together, they support the processed-blade trade model.
The nine nonelite households yielded 46 identifiable blade fragments (9 proximal, 35 medial, and 2 distal segments) and no whole blades. The proximal-distal ratio for these nine households is 4.5:1 and the medial-distal ratio is 17.5:1 (Table 5). Both of these ratios correspond to our processed-blade trade model, especially the high ratio of medial segments to distal segments.
During the Middle Formative period, obsidian prismatic blades were imported into the Valley of Oaxaca rather than produced locally (Parry Reference Parry1987). The lack of whole blades and production evidence, along with the observed segment ratios for all 10 households indicate that for the duration of the San Jose phase, these 10 households imported processed blades. The low frequency of distal segments reflects the preprocessing of blades prior to long-distance exchange. Even though the elite household may have had access to more obsidian blades than any nonelite house, everyone appears to have received blades in the same processed form.
Basin of Mexico
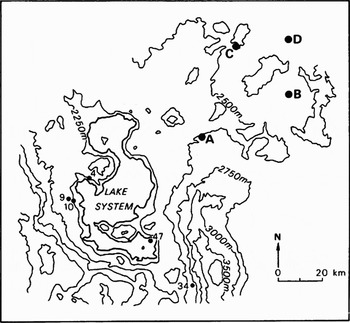
The Basin of Mexico is the hydrological basin that contains modern Mexico City (Figure 12) (Evans Reference Evans2004:58). Its topography, hydrology, and abundant natural resources made it the center of several major civilizations over the course of Mesoamerican prehistory (Sanders and Price Reference Sanders and Price1968; Sanders et al. Reference Sanders, Parsons and Santley1979). During the Early and Middle Formative periods, the Basin of Mexico was the location of some of the earliest villages in central Mexico (Evans Reference Evans2004:124). We focus here on blade assemblages from three Formative period sites that were analyzed by Boksenbaum (Reference Boksenbaum1978): Loma de Atoto, El Arbolillo, and Tlapacoya-Ayotla (see Figure 12 for locations and Table 4 for chronology). Of the three regions examined, the Basin of Mexico is the closest to known obsidian sources (Cobean Reference Cobean2002: Figure 2.3).
Map of Basin of Mexico Sites and Obsidian Sources: (4) El Arbolillo; (9) Tlatilco; (10) Loma de Atoto; (34) Coapexco; (47) Tlapacoya; (a) Otumba; (b) Paredon; (c) Pachuca; (d) Pizarrín (based on Boksenbaum et al. Reference Boksenbaum, Tolstoy, Harbottle, Kimberlin and Neivens1987:Figure 1).

Loma de Atoto sits on a hilltop that overlooks the large site of Tlatilco in the western portion of the basin. El Arbolillo is located in the western Basin of Mexico near the shore of ancient Lake Texcoco. Tlapacoya-Ayotla is a small site located at the base of a steep volcanic cone, which in pre-Hispanic times was an island off of the northeast shore of Lake Chalco. The obsidian from these three sites was recovered from domestic consumption contexts (Boksenbaum Reference Boksenbaum1978:122–126).
Household assemblages were grouped together by phase and only artifacts from unmixed deposits were used in our analysis. Even after grouping, we found that only three phases had 35 or more prismatic blades, which we felt was the minimum needed for meaningful analysis. These were the Late Ayotla (~1300–1150 b.c.), La Bomba (1150–1050 b.c.), and Cuatepec/Atoto (~800–650 b.c.) phases (Boksenbaum Reference Boksenbaum1978:Table 4.14). Boksenbaum (Reference Boksenbaum1978:Table 4.14) reported 128 blade fragments and 3 whole blades from these three time periods. He found no evidence of blade production except for three flakes from a smashed blade core: one from Loma de Atoto and two from El Arbolillo (Boksenbaum Reference Boksenbaum1978:162). Boksenbaum speculated that recycled or exhausted cores were traded and used as flake cores for expedient percussion flaking (Boksenbaum Reference Boksenbaum1978:162, 195–196). The absence of clear primary or secondary production evidence at these Early and Middle Formative sites reduces the likelihood, but does not eliminate the possibility, that households in the Basin of Mexico were regularly provisioned by itinerant or local craftsmen. A good picture emerges when we examine the blade ratio data for processed-blade and whole-blade trade models.
Evaluating the models
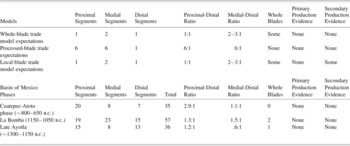
The data from the three phases are summarized in Table 6. The Late Ayotla phase yielded 36 blade fragments (15 proximal, eight medial, and 13 distal) and one whole blade. The proximal-distal ratio is 1.2:1, and the medial-distal ratio is .6:1. These ratios conform to the expectations of our whole-blade trade model. In the following La Bomba phase, 57 blade fragments (19 proximal, 23 medial, and 15 distal) and two whole blades were recovered. The proximal-distal ratio for this phase is 1.3:1 and the medial-distal ratio is 1.5:1. These ratios conform to the expectations of our whole-blade trade model.
Summary of Basin of Mexico blade totals, segment ratios, and the expectations of our three proposed models

In the final Cuatepec/Atoto phase, 35 blade fragments were recovered (20 proximal, eight medial, and seven distal). The proximal-distal ratio for this phase is 2.9:1 and the medial-distal ratio is 1.1:1. The proximal-distal ratio is at the high end of our whole-blade trade model. However, the low medial-distal ratio suggests whole-blade trade. One possible explanation for the high frequency of proximal segments is that Boksenbaum created a category called “proximal-medial” that we grouped with proximal segments in our final calculations. This grouping is likely what caused the overrepresentation of proximal segments during this phase. Because of the low medial-distal ratio, we argue that whole blades were likely imported during the Cuatepec/Atoto phase.
In his analysis, Boksenbaum (Reference Boksenbaum1978:95) hypothesized that some form of selective blade use should have occurred in these consumption contexts:
I suspect that the portion of the blade in use in houses would have been the middle (medial) portion, since the medial portion of a fine prismatic blade would be the most regular portion, the bulbar and distal ends having less straight edges, more longitudinal curvature (more bowed), and greater variation in thickness. I therefore would expect proximal and distal fragments to show up in garbage “dumps” and/or workshop areas.
However, he concluded that “considering the overall pattern for unmixed assemblages, there is little to suggest differential selection of the different portions of the blade” (Boksenbaum Reference Boksenbaum1978:227).
It appears that during the Late Ayotla, La Bomba, and Cuatepec/Atoto phases, all three sites imported whole blades. Three lines of evidence support this statement. First, there is no evidence of primary production. The only secondary production evidence recovered were three percussion flakes struck from a blade core. Second, three whole blades were recovered, one from Late Ayotla and two from La Bomba phase deposits. Finally, the proximal-distal and medial-distal ratios in each phase conform to expectations of the whole-blade trade model.
It is likely that the proximity of these sites to both obsidian sources and larger centers where primary blade production may have occurred influenced the structure of blade trade (see Boksenbaum et al. Reference Boksenbaum, Tolstoy, Harbottle, Kimberlin and Neivens1987 for a discussion of blade production at Coapexco). If obsidian was abundant (as it apparently was in the Basin of Mexico), we might expect less economizing behavior. People may have been segmenting blades into large rather than small sections. This could explain the low ratios of medial to distal segments for the Late Ayotla (.6:1) and La Bomba (1.5:1) phases. Short distances between production and consumption areas may have not necessitated the removal of distal sections. This was the case at the Classic period site of Cerén, El Salvador, where unmodified whole blades were obtained from a producer site 5 km away (Sheets Reference Sheets and Sheets2002:140). The proximity of these Basin of Mexico sites to nearby production centers, such as Coapexco, could explain why blades were not modified for transport.
Tlaxcala
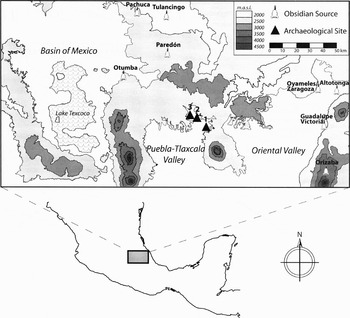
Tlaxcala (Figure 13) has long been famous for the role played by its Postclassic period inhabitants in the Spanish conquest of Mexico. Archaeological investigations have identified the region as an important locus of Late Archaic and Formative period developments as well (García Cook Reference García Cook and Sabloff1981; García Cook and Merino Carrión Reference García Cook, Merino Carrión, García Cook and Merino Carrión1997; Lesure et al. Reference Lesure, Borejsza, Carballo, Frederick, Popper and Wake2006; Snow Reference Snow1969). Recent research in the Apizaco region under the direction of Richard Lesure has uncovered several rural sites dating between the late Early Formative and the late Middle Formative periods (Table 4). We focus on three of those sites in this analysis: Amomoloc, Tetel, and Las Mesitas (Figure 13).
Map of eastern central Mexico displaying Tlaxcala sites discussed in the study: (1) Amomoloc; (2) Tetel; (3) Las Mesitas (from Carballo et al. Reference Carballo, Carballo and Neff2007:Figure 2).

All three of the rural Tlaxcalan settlements are located in the northern Puebla-Tlaxcala Valley on hill slopes near the modern town of Apizaco. Because of their location on slopes, the thin soils of the region, and millennia of intensive cultivation, accelerated soil erosion has obliterated surface features at the sites. Accordingly, project excavations focused on recovering materials from sealed, subterranean pits that were distributed in a manner consistent with house units (sensu Flannery Reference Flannery, Flannery and Marcus1983). Whereas Amomoloc and Tetel were once small villages, Las Mesitas was probably a dispersed hamlet (Carballo et al. Reference Carballo, Carballo and Neff2007; Lesure et al. Reference Lesure, Borejsza, Carballo, Frederick, Popper and Wake2006). Occupation of Amomoloc dates to ca. 900–600 cal b.c.; Tetel was occupied between ca. 700–450 cal b.c.; and Las Mesitas was briefly occupied sometime between ca. 500–400 cal b.c. (Table 4) (Lesure et al. Reference Lesure, Borejsza, Carballo, Frederick, Popper and Wake2006). Amomoloc is contemporary with Chalcatzingo but is earlier than any of the large Middle and Late Formative chiefdoms of the Puebla-Tlaxcala region, such as Xochitecatl, Tlalancaleca, and La Laguna. Tetel and Las Mesitas overlap with these later local regional polities.
The Tlaxcalan sites are not as close to obsidian outcrops as sites in the central and northern Basin of Mexico. They are, however, much closer to obsidian sources than sites located in the Valley Oaxaca. The nearest source to Tlaxcala is Paredon, located 52–66 km (linear distance) to the north (Carballo et al. Reference Carballo, Carballo and Neff2007:31). The obsidian assemblages discussed here were analyzed between 2002 and 2004 and are partially reported elsewhere (Carballo Reference Carballo and Lesure2004; Carballo et al. Reference Carballo, Carballo and Neff2007). We discuss these sites in chronological order, beginning with the earliest occupation at Amomoloc.
Evaluating the models
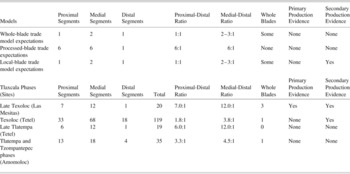
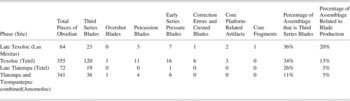
The village of Amomoloc has a total of 47 obsidian core/blade artifacts, 10 from Tzompantepec-phase contexts (900–800 b.c.) and 37 from Tlatempa-phase contexts (800–600 b.c.). Because of the small Tzompantepec sample, we combined the blade totals with those of the Tlatempa phase. The combined Tzompantepec-Tlatempa sample contains 36 blades (one whole blade, 13 proximal, 18 medial, and four distal segments) (see Table 7). The proximal-distal ratio is 3.3:1 and the medial-distal ratio is 4.5:1. Secondary evidence of blade production was recovered in the form of four percussion blades, six early series blades, and one overshot blade (see Table 8 for totals). Because the secondary production evidence is composed of bladelike artifacts that show use wear, we interpret them as tools and not the by-products of blade manufacture. The segment ratios conform to what we would expect for the processed-blade trade model. Coupled with the presence of one whole blade, these ratios may indicate that multiple forms of blade trade were occurring simultaneously.
Summary of Tlaxcala blade totals, segment ratios, and the expectations of our three proposed models

Summary of secondary production evidence from Tlaxcalan sites

Occupation at the small village of Tetel spans two phases, Late Tlatempa (700–600 b.c.) and Texoloc (600–400 b.c.). The Late Tlatempa phase yielded 19 blade fragments (six proximal, 12 medial, and one distal) (Table 7). This produced a proximal-distal ratio of 6:1 and a medial-distal ratio of 12:1. The only evidence of blade production was one early series blade. Although our Late Tlatempa sample falls below our 35 blade minimum, we opted to include this sample because it is our earliest well-dated sample for the site and its use allows us to examine regional change through time. The later Texoloc-phase occupation exhibits a significant increase in the number of blades. In total, 119 prismatic blade segments (33 proximal, 68 medial, and 18 distal) and one whole blade were recovered from the Texoloc-phase assemblage. For this later phase, the proximal-distal ratio is 1.8:1 and the medial-distal ratio is 3.8:1 (Table 7). Three platform-related artifacts were the only primary production evidence found. However, a significant quantity of secondary production evidence was recovered including one overshot blade, 11 percussion blades, 16 early series blades, and six correction-related artifacts (including crested blades) (Table 8). The majority of this secondary production evidence could have been used as tools. Although the medial-distal ratio is slightly higher than what we expected for the local production model, the proximal-distal ratio, the presence of a whole blade, some primary production evidence, and the abundance of secondary production evidence conform to what we might expect for local or itinerant craftsmen production. The increase in the number of medial segments per distal segment may simply be the result of local attempts to extract more usable tool segments per blade.
The site of Las Mesitas was occupied for only a brief time during the Late Texoloc phase (500–400 b.c.). Excavations here recovered 20 prismatic blade fragments (seven proximal, 12 medial, and one distal) and three complete blades. The proximal-distal ratio is 7:1 and the medial-distal ratio is 12:1. Although this sample falls below our 35 blade minimum, we included it because we base the majority of our interpretations of this assemblage on the primary and secondary production evidence (not the segment ratios). The primary production evidence from Las Mesitas included one core fragment and two platform-related artifacts. The secondary production evidence included three percussion blades and seven early series blades (Table 8). The high blade segment ratios are what would be expected under our processed-blade trade model. However, the abundance of primary and secondary production evidence and the presence of three whole blades indicate local production and possibly the involvement of itinerant craftsmen in this community.
The Tlaxcala data show several trends. First, when we examine the assemblages chronologically, we see a steady increase in both the frequency of blades and secondary production evidence (Table 8). The data indicate that during early phases finished blades were imported to communities, and the technology and materials needed to produce blades on-site followed during later ones. At Amomoloc and during the early occupation of Tetel, whole and processed blades were imported to these sites. During the later occupation at Tetel, we see increased evidence for on-site blade production, possibly by itinerant merchants, as there is little evidence of initial core shaping or exhausted cores. This pattern continues at Las Mesitas, chronologically the latest of the three sites, which has both considerable production evidence and relatively high blade segment ratios suggesting blade processing. This combination could be the result of households being provisioned with obsidian blades through both local production, possibly by itinerant craftsmen, and processed-blade trade. Alternatively, blades may have been produced and segmented in an area of the site other than where excavations were undertaken. Finished blades and certain production by-products could have been used by the families living in the house units that were excavated.
CONCLUSIONS
We have shown that the structure of Formative period blade trading is too diverse to be captured by simplistic models. By applying Hirth's (1998) distributional approach to domestic blade consumption contexts, it was possible to identify and distinguish aspects and forms of blade trade. We proposed three models that can be applied to blade assemblages to identify the types of blade-trading behavior responsible for them. We then evaluated our models using empirical data from three regions and found that blades moved in diverse forms through time and across space. In two of the regions examined (Valley of Oaxaca and Tlaxcala), the data indicate that processed-blade trade occurred before whole-blade trade and that both forms of trade were later followed by on-site blade production.
In addition to identifying different types of blade trading, we also found that distance to obsidian sources and access to blade-producing sites have a strong influence on the form that blade trading takes. The Basin of Mexico sites we examined may have had more access to raw and finished obsidian than the other two areas resulting in the importation of whole blades and overall smaller segment ratios, particularly the medial-distal ratios. Because sites such as Loma de Atoto, El Arbolillo, and Tlapacoya-Ayotla were likely importing blades from nearby producer sites, they probably did not need to preprocess blades for transport. In terms of linear distance, these sites are located just as far as the Tlaxcalan sites from obsidian sources. However, the use of water transport in the Basin of Mexico probably made access to obsidian easier than it would have been in more landlocked areas. If obsidian was readily available to these Basin of Mexico sites, we might expect them to use larger blade segments and expend little energy trying to extend the use life of blades. The further you move away from obsidian sources, the more likely it is that blades would be processed for long-distance travel, often by removing the distal ends. The scarcity factor may also result in users extracting more medial segments per blade. Both of these phenomena were observed in the more distant Valley of Oaxaca.
The models we have proposed to examine blade trade have broad implications for future studies of Formative period obsidian. First, these models provide more systematic and nuanced ways to examine the shift from blade trading to on-site blade production. This transition was an important technological change in Mesoamerican lithic industries, yet it continues to be poorly understood. One important consideration for future research is why so few prismatic blade cores have been reported for the Early and Middle Formative periods. Is the paucity of cores related to small sample sizes, recycling, destruction, caching, or operation of blade trade in the absence of itinerant or local craft production? De León's ongoing research at the Olmec site of San Lorenzo indicates that, despite the presence of thousands of prismatic blades dating from Early and Middle Formative contexts, prismatic blade cores and core fragments are virtually absent. This suggests that sample size alone is not responsible for the lack of cores at many Formative period sites. This scarcity of cores means that archaeologists will have to rely on other types of production evidence to study the shift from blade trading to on-site production. The models proposed here provide new ways to deal with this problem.
Another important contribution of our models is that they can be used to study obsidian issues related to trade, scarcity, and economizing behavior. For example, our whole-blade trade model posits that blades brought into sites from nearby production areas should have different segment frequencies than those imported from greater distances. This hypothesis can be tested using trace-element analyses. Furthermore, studies of blade segments can help estimate the number of imported blades to a site and provide information about how accessible these artifacts were. Furthermore, segment ratios can signal whether some type of economizing behavior was used to extract many (or few) usable tools per blade.
Finally, the local-blade production model we have proposed is the first systematic attempt to describe what on-site and itinerant production might look like in the archaeological record. It has been posited that the adoption of blade production during the Formative period had important political and economic implications (Clark Reference Clark, Johnson and Morrow1987). However, few have attempted to study this phenomenon. We have provided a first step toward understanding this crucial development in Mesoamerican lithic industries, and we hope that others will pursue this topic.
We acknowledge that our models are not perfect. One shortcoming of our local-production model is that it conflates output from itinerant craftsmen with that of local craftsmen. If larger samples were available for analysis, it might be possible to discriminate between these two types of activities. In many instances, archaeologists are only able to examine a few households from a particular site. If one individual in a small village is responsible for blade production and that person's house is not excavated, we could easily mistake secondary blade production in other contexts for evidence of itinerant merchant behavior. Developing a model that distinguishes local craft production from that produced by itinerant craftsmen (see Hirth Reference Hirth2008b; Hirth, Bondar, Glascock, Vonarx, and Daubenspeck Reference Hirth, Bondar, Glascock, Vonarx, Daubenspeck and Hirth2006) is a logical next step for this type of research. For now, we feel that the presence of both cores and secondary debitage suggests local production, and secondary production debitage by itself should be indicative of itinerant production behavior. However, we reiterate that secondary production evidence has to be carefully evaluated on a case-by-case basis.
Finally, all of our models and measures can be improved upon. Although we have used blade ratios to help differentiate between different forms of blade trade, we do not feel that they are the best or only types of measurements to use. Other types of measures, such as metric measurements on blade segments, would be useful in evaluating alternative forms of blade trade. Reporting of complete measurements for the proximal, medial, and distal blade segments would allow us to estimate average blade length and verify whether our segment ratios are justifiable. We also need more data from unmixed Formative period production and consumption contexts to refine and evaluate the expectations of our models. The data sets we used in this analysis were generally too small. This was partially the result of a lack of published obsidian data sets dating to the Early and Middle Formative periods. De León's ongoing research on San Lorenzo obsidian, which includes thousands of blades from domestic consumption contexts, will eventually provide more robust data sets from which to evaluate the models proposed here. Despite some of these shortcomings, we have shown that blade trade was a far more complex activity than previously thought, and we hope that other investigators will address these questions in their own research.
RESUMEN
Las navajas prismáticas de obsidiana, fueron intercambiadas extensivamente en toda Mesoamérica durante el formativo temprano y medio. Sin embargo, no fue sino hasta el formativo tardío (400 A.C.-100) que los núcleos prismáticos, comenzaron a ser intercambiados intensivamente. Generalmente se acepta, que el intercambio de navajas precedió al trueque de núcleos pero poco sabemos acerca de la estructura del canje de navajas durante el formativo temprano y medio. En este trabajo describimos tres modelos de distribución para el comercio de las navajas prismáticas de obsidiana: el del comercio de las navajas enteras, el del comercio de las navajas procesadas y en la producción local. Cada modelo, tiene sus restos arqueológicos basados en las frecuencias de diferentes artefactos relacionados a la producción de navajas y el cociente de los segmentos de las navajas.
Nuestros modelos fueron evaluados, usando datos de unidades habitacionales de tres regiones: el Valle de Oaxaca, la Cuenca de México y Tlaxcala. Encontrando que, durante el período formativo, la estructura de intercambio de navajas varía en el tiempo y el espacio. Usando el modelo distribucional de Hirth (1998) para analizar contextos domésticos e identificar y distinguir aspectos y formas de intercambio de navajas. En dos de las regiones examinadas (Valle de Oaxaca y Tlaxcala), los datos indican que el intercambio de las navajas procesadas ocurrió antes del canje de navajas enteras y que ambas formas de intercambio fueron seguidas más adelante por la producción local de navajas.
ACKNOWLEDGMENTS
Portions of this paper were first presented at the 2005 Society for American Archaeology meetings in a session entitled “Formative Period Social Transformations in Central and Western Mexico” organized by Jennifer and David Carballo. The final version of this paper was written as part of a graduate seminar at Pennsylvania State University, and we would like to thank the many seminar participants for their comments and feedback. We would also like to thank Jennifer Carballo for help sorting out the Tlaxcala phase dates and Maria Inclan for proofreading the Spanish translation.