Despite having the ability to use both languages at high levels of proficiency, bilinguals typically show lower performance than their monolingual peers in verbal tasks that demand lexical access, e.g., picture naming and verbal fluency tasks (e.g., Michael & Gollan, Reference Michael, Gollan, Kroll and De Groot2005). Importantly, these bilingual ‘disadvantages’ generally persist even when bilinguals complete the verbal task in their first and dominant language (e.g., Gollan, Montoya, Cera & Sandoval, Reference Gollan, Montoya, Cera and Sandoval2008; Ivanova & Costa, Reference Ivanova and Costa2008).
The verbal fluency test is a word retrieval task that requires participants to produce as many words as possible that satisfy specific criteria within one minute. In category fluency, participants retrieve words from a particular semantic category, e.g., fruits or clothing. In letter fluency, participants retrieve words that begin with a specific letter, e.g., F or S. Because word representations are naturally organized in semantic networks, category fluency is a more automatic and natural process than letter fluency, which is considered to be more effortful and more dependent on executive control strategies (e.g., Grogan, Green, Ali, Crinion & Price, Reference Grogan, Green, Ali, Crinion and Price2009; Delis, Kaplan & Kramer, Reference Delis, Kaplan and Kramer2001). Verbal fluency tests are widely used in clinical settings as standard measures of neuropsychological functioning. Therefore, it is critical to investigate the diagnostic ability of these tasks in bilingual populations and to understand the mechanisms underlying possible bilingual disadvantages.
Three possible, not mutually-exclusive, explanations for verbal fluency disadvantages in bilinguals have been proposed (e.g., Bialystok, Craik & Luk, Reference Bialystok, Craik and Luk2008; Sandoval, Gollan, Ferreira & Salmon, Reference Sandoval, Gollan, Ferreira and Salmon2010; Luo, Luk & Bialystok, Reference Luo, Luk and Bialystok2010): 1) bilinguals may experience interference between exemplars from the target language and non-target language; 2) bilinguals may retrieve target language exemplars more slowly than monolinguals; and 3) smaller vocabulary (within each language) for bilinguals compared to monolinguals may lead to the generation of fewer target language exemplars.
Bilingual disadvantages have been more consistently reported for category fluency than for letter fluency (e.g., Bialystok et al., Reference Bialystok, Craik and Luk2008; Gollan, Montoya & Werner, Reference Gollan, Montoya and Werner2002; Portocarrero, Burright & Donovick, Reference Portocarrero, Burright and Donovick2007; Rosselli, Ardila, Salvatierra, Marquez, Matos & Weekes, Reference Rosselli, Ardila, Salvatierra, Marquez, Matos and Weekes2002). One possible explanation is that category fluency is more sensitive to non-target language interference because translation equivalents necessarily belong to the same semantic category, whereas they typically do not belong to the same letter category (except for cognates). Furthermore, some studies have reported bilingual advantages on executive control tasks that might benefit bilinguals’ performance on letter fluency tasks more than on category fluency tasks (Bialystok, Craik, Green & Gollan, Reference Bialystok, Craik, Green and Gollan2009). Specifically, Luo et al. (Reference Luo, Luk and Bialystok2010) compared the time course of word retrieval in category and letter fluency in monolingual English speakers and unimodal bilinguals with lower and higher English vocabulary levels. No group differences were observed for category fluency, but high-vocabulary bilinguals retrieved more words than the two other groups in letter fluency (cf. Bialystok et al., Reference Bialystok, Craik and Luk2008). The time course analysis revealed a flatter curve for the two bilingual groups in letter fluency compared to the monolingual group, and a lower-shifted curve for the low-vocabulary bilinguals. Luo et al. (Reference Luo, Luk and Bialystok2010) suggested that the flatter curve for the bilinguals reflected enhanced executive control, and that the difference in overall height of the curve reflected the different vocabulary levels of the two bilingual groups.
Only two published studies have compared performance between bimodal bilinguals and monolinguals on a conflict-resolution task and found no evidence for a bimodal bilingual advantage in executive control (Emmorey, Luk, Pyers & Bialystok, Reference Emmorey, Luk, Pyers and Bialystok2008a; Giezen, Blumenfeld, Shook, Marian & Emmorey, Reference Giezen, Blumenfeld, Shook, Marian and Emmorey2015), possibly because bimodal bilinguals do not experience the same needs for inhibition and control as unimodal bilinguals. Specifically, less monitoring may be required because bimodal bilinguals can speak and sign at the same time, and perceptual discrimination between their two languages is easier than for unimodal bilinguals (see Emmorey et al., Reference Emmorey, Luk, Pyers and Bialystok2008a, for discussion). Nonetheless, they must select and control two languages, e.g., in conversations with English monolinguals or deaf signers, and Giezen et al. (Reference Giezen, Blumenfeld, Shook, Marian and Emmorey2015) reported evidence that bimodal bilinguals rely on inhibitory control mechanisms to suppress cross-language competition when listening to English words.
Studying verbal fluency in the dominant, spoken language of hearing bimodal bilinguals may provide useful insights into the mechanisms that underlie bilingual (dis)advantages in verbal fluency tasks because of their unique bilingual context. The majority of native ASL–English bimodal bilinguals are immersed in a spoken language-dominant environment and, unlike unimodal bilinguals, they do not necessarily divide their language use between languages because they often produce ASL signs and English words at the same time through code-blending and mouthing (Emmorey, Borinstein, Thompson & Gollan, Reference Emmorey, Borinstein, Thompson and Gollan2008b). Therefore, they are unlikely to have smaller English vocabulary levels than monolingual English speakers, and may also use English more frequently than unimodal bilinguals (Emmorey, Petrich & Gollan, Reference Emmorey, Petrich and Gollan2013; Pyers, Gollan & Emmorey, Reference Pyers, Gollan and Emmorey2009).
The goal of the present study was to further investigate the role of non-target language interference, vocabulary size and reduced frequency of use in explaining bilingual disadvantages in verbal fluency. We focused on letter fluency, precisely because of the reduced possibility of the non-target language to influence retrieval of words in the target language for bimodal bilinguals. That is, because of their distinct phonological systems, ASL and English have no cognates (words that share form and meaning across the two languages, e.g., Dutch-English huis-house) that might benefit bilingual letter fluency performance (e.g., Sandoval et al., Reference Sandoval, Gollan, Ferreira and Salmon2010; Blumenfeld, Bobb & Marian, Reference Blumenfeld, Bobb and Marian2016). Furthermore, bimodal bilinguals might be less likely than unimodal bilinguals to compensate for word retrieval difficulties with enhanced executive control abilities.
Therefore, if bimodal bilinguals retrieve fewer words than monolinguals in their dominant language (English), then this would strongly suggest that vocabulary size and/or reduced frequency of use are not sufficient to account for the bilingual disadvantage in verbal fluency. Furthermore, it would provide evidence that non-target language interference in verbal fluency is not dependent on phonological competition between the two languages. If, on the other hand, bimodal bilinguals and monolinguals do not differ significantly in the number of words they retrieve, then a comparison of the time course of retrieval of the two groups could provide further insight into the relative contributions of vocabulary size, reduced frequency of use, and executive control ability. Finally, if bimodal bilinguals retrieve more words than monolinguals, then it would, rather surprisingly perhaps, suggest that bimodal bilinguals also benefit from enhanced executive control abilities on a letter fluency task, in which case we would further predict a flatter retrieval slope for the bilinguals compared to the monolinguals (cf. Luo et al., Reference Luo, Luk and Bialystok2010).
Methods
Participants
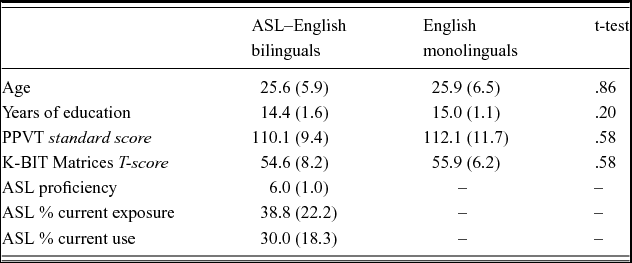
Nineteen hearing ASL–English bimodal bilinguals (8 females) and nineteen native monolingual English speakers (15 females) participated in the study. Background characteristics for both groups are listed in Table 1. One additional bimodal bilingual and monolingual were tested, but excluded from analysis because of technical failure and an incomplete background assessment, respectively. The bimodal bilinguals were all Children of Deaf Adults (Codas) who acquired ASL from birth. They self-rated their ASL and English proficiency on a 1 (‘very little’) – 7 (‘like native’) scale. Their mean ASL proficiency rating for was 6.0 (SD = 1.0), and five were ASL interpreters. All participants rated their English proficiency at the top end of the scale, and none were proficient in another spoken language. English receptive vocabulary knowledge was assessed with the Peabody Picture Vocabulary Test-III (Dunn & Dunn, Reference Dunn and Dunn1997) and nonverbal intelligence was assessed with the K-BIT2 Matrices subtest (Kaufman & Kaufman, Reference Kaufman and Kaufman2004) or the WASI Matrix Reasoning subtest (PsychCorp, 1999). Bimodal bilingual participants and monolingual participants did not differ significantly in age, years of education, vocabulary level or nonverbal intelligence (all ps ≥ .20).
Background characteristics of the bimodal bilingual and monolingual participants.

Note. Proficiency-self ratings and information on language use and exposure were obtained through a language background questionnaire.
Procedure
The letter categories used in the present study were F, A, S, E, P, and M. Participants’ verbal responses were recorded on a digital audio-recorder, and a stopwatch was used to mark start and stop times on the recordings. Repetitions, responses from different letter categories, proper names, places and numbers were scored as errors. Raw scores were obtained by subtracting the number of errors from the total number of responses. Audacity® software was used to process the digital recordings and to identify the correct responses. For each correct response, the associated time-stamp (obtained through the software's sound finder function) reflected the time between the onset of the recording and the onset of a given response. Based on these time-stamps, correct responses were grouped in 5-second bins for each 60-second trial.
Results
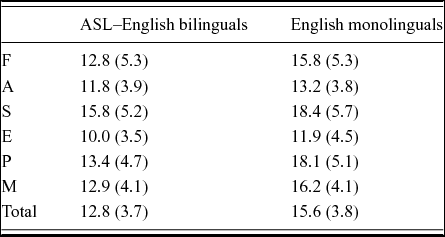
Table 2 illustrates the means and standard deviations for each letter category for the bimodal bilinguals and monolinguals.Footnote 1 Despite similar receptive vocabulary levels, bimodal bilinguals retrieved significantly fewer words than monolinguals (M = 12.8 (SD = 3.7) and M = 15.6 (SD = 3.8), t(36) = -2.36, p < .05, 95% CI [-5.3, -0.4], d = -0.76).
Means and standard deviations (between parentheses) of correct number of responses in each letter category for bimodal bilinguals and monolinguals.

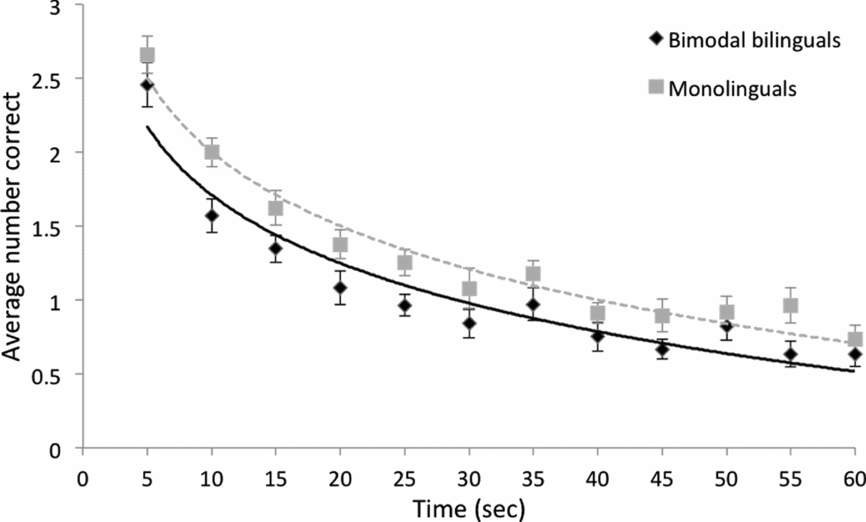
Figure 1 illustrates the time-course of retrieval in each group. Visual inspection of this graph suggests that the bimodal bilingual disadvantage is most apparent early in the letter fluency trial (except for the first five seconds). Towards the end of the trial, the differences appear to diminish slightly but do not completely disappear.
Number of responses produced across all letter categories as a function of time and group. Lines represent the best-fitting logarithmic functions. Error bars represent one standard error from the mean.

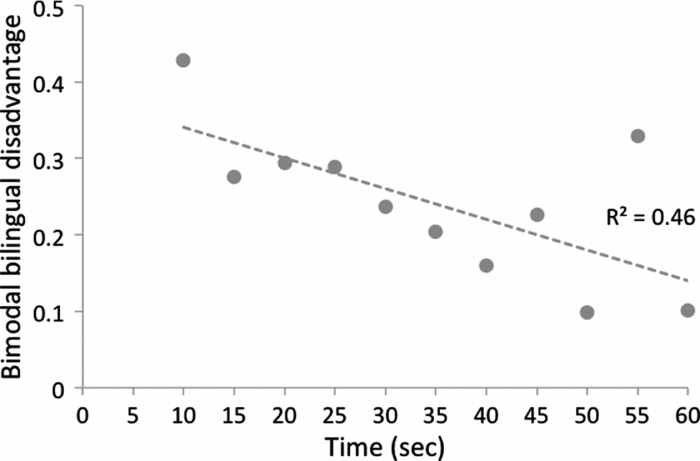
This visual trend towards a larger disadvantage early in the letter fluency trial becomes even more evident if we plot the difference between bimodal bilinguals and monolinguals in number of correct responses (i.e., the ‘bimodal bilingual disadvantage’) as a function of time and exclude the first time bin, which according to Luo et al. (Reference Luo, Luk and Bialystok2010) is mainly determined by vocabulary size. Except for the penultimate bin, there is a clear indication of a downward linear trend over time towards a smaller difference in correct number of responses between bimodal bilinguals and monolinguals (see Figure 2).
‘Bimodal bilingual disadvantage’ with respect to mean number of correct responses as a function of time. The line represents the best-fitting linear function.

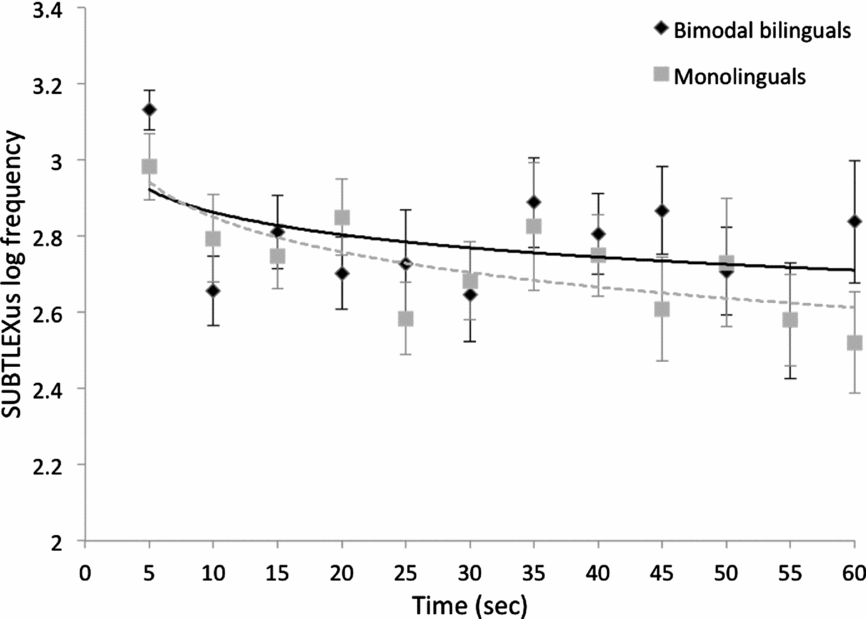
This downward trend is consistent with the reduced frequency of use account as well as the language interference account (Sandoval et al., Reference Sandoval, Gollan, Ferreira and Salmon2010). However, these two accounts make opposite predictions with respect to the word frequency of responses produced by bilinguals. Whereas the reduced frequency of use account predicts that bilinguals will produce more higher-frequency exemplars than monolinguals because low-frequency words are less accessible for them, the interference account predicts that bilinguals will produce more lower-frequency exemplars than monolinguals because high-frequency words are more accessible in both languages and will thus compete more strongly with each other (Gollan et al., Reference Gollan, Montoya, Cera and Sandoval2008). Therefore, we calculated the mean SUBTLEXus log frequency (Brysbaert & New, Reference Brysbaert and New2009) of correct responses produced by bimodal bilinguals and monolinguals, which did not differ significantly (M = 2.83 and M = 2.79, respectively, t(36) = 0.51, p = .61). Figure 3 plots frequency as a function of time for the letter fluency task. Visual inspection of this graph suggests that both groups produce higher-frequency words at the beginning of the trial, and there are no clear differences between the two groups.
Mean SUBTLEXus log frequency of correct responses as a function of time for each group. Lines represent the best-fitting logarithmic function for each group. Please note that the y-axis does not start at zero to enhance visibility of the frequency patterns.

Discussion
The results show for the first time that bilingual disadvantages in verbal fluency are not limited to bilinguals of two spoken languages. This is an especially remarkable finding because 1) the bimodal bilinguals and monolinguals in this study had equal English receptive vocabulary levels, and 2) the bilinguals were immersed in an English-speaking environment from a very early age and were strongly spoken-language dominant. Furthermore, in contrast to unimodal bilinguals they can and often use both languages at the same time, and therefore they are less likely than unimodal bilinguals to differ from monolinguals in frequency of language use. Finally, in contrast to many combinations of spoken languages, there are no cognates for ASL and English that might benefit verbal fluency performance (i.e., there are no overlapping phonological forms).
These results have important implications for the use of verbal fluency tests as a standard measure of neuropsychological functioning and as a diagnostic tool for specific neurodegenerative diseases. The finding that bimodal bilinguals show disadvantages in verbal fluency for spoken English (their dominant language) needs to be taken into account when interpreting fluency test results. This finding also provides an important novel contribution to the existing literature on verbal fluency performance of different bilingual populations (e.g., Friesen, Luo, Luk & Bialystok, Reference Friesen, Luo, Luk and Bialystok2015; Kormi-Nouri, Moradi, Moradi, Akbari-Zardkhaneh & Zahedian, Reference Kormi-Nouri, Moradi, Moradi, Akbari-Zardkhaneh and Zahedian2012; Ljungberg, Hansson, Andrés, Josefsson & Nilsson, Reference Ljungberg, Hansson, Andrés, Josefsson and Nilsson2013).
Specifically, our findings provide insight into the possible mechanisms underlying bilingual disadvantages in verbal fluency tasks. Given that the ASL–English bilinguals and English monolinguals had similar English receptive vocabulary levels, reduced vocabulary size clearly does not appear to be necessary for bilinguals to exhibit disadvantages in letter fluency. Although the results of the present study cannot fully distinguish between explanations based on reduced frequency of use and between-language interference, we think it is unlikely that reduced frequency of use can fully account for the bimodal bilingual disadvantage in letter fluency. This is because findings from two previous production studies with bimodal bilinguals suggested that they are not affected by a frequency lag to the same extent as unimodal bilinguals. Emmorey et al. (Reference Emmorey, Petrich and Gollan2013) found no difference between early or late ASL–English bilinguals and monolingual English speakers in picture naming latencies, error rates or frequency effects. Furthermore, Pyers et al. (Reference Pyers, Gollan and Emmorey2009) found that, although ASL–English bilinguals exhibited more lexical retrieval failures in English than monolingual English speakers, they produced more correct responses than Spanish–English bilinguals.
If between-language interference was driving the observed bimodal bilingual disadvantage in letter fluency (or at least contributed to this effect), then the current study demonstrates that bilingual disadvantages are not dependent on phonological competition between languages. That is, it would suggest that the two languages of bilinguals compete for selection during language production, regardless of whether the two languages share the same articulators or not. Although a number of studies have shown co-activation of a signed and a spoken language in comprehension, much less is known about non-selective access during bimodal bilingual production (see Emmorey, Giezen & Gollan, 2016).
One possibility that we have not yet considered is that ASL knowledge might influence English letter fluency through either fingerspelling (handshapes in a manual alphabet combined to spell English words) or initialized ASL signs (the handshape of the sign represents the initial letter of the English translation). Given the nature of the task (producing English words that begin with a particular letter), one might expect that fingerspelling and/or the existence of initialized signs in the ASL lexicon would actually facilitate rather than impair performance. Alternatively, because fingerspelled forms constitute orthographic rather than phonological representations of English words (i.e., handshapes map to letters not sounds), fingerspelling may interfere with phonologically-based retrieval strategies in English – a language that does not have a transparent mapping between orthographic and phonological representations.Footnote 2
Furthermore, the existence of initialized signs may have interfered with English word retrieval for specific letter categories because some fingerspelled letter handshapes are also part of the native phonological inventory of ASL (Brentari & Padden, Reference Brentari, Padden and Brentari2001). For example, ASL signs produced with the handshapes F, A and S are in most cases non-initialized signs (Lepic, Reference Lepic2013), e.g., the sign WRISTWATCH is made with an F handshape. In contrast, ASL signs produced with the handshapes E and M, and to a lesser extent P, are almost exclusively initialized signs (e.g., ELEVATOR is produced with an E handshape). However, inspection of Table 2 suggests that if anything, the bimodal bilingual disadvantage is larger for the ‘helpful’ letter categories E, P and M compared to F, A and S, indicating that possible language interference from initialized signs was not present for the letters F, A and S.
To further investigate the possibility that bimodal bilingual participants actively utilized links with initialized ASL signs in the letter fluency task, we calculated the proportion of English responses with initialized ASL translations out of the total number of responses for each letter category. If the bimodal bilingual participants actively relied on links with initialized ASL signs, then they would likely produce a higher proportion of English responses that had initialized ASL translations compared to the monolingual English speakers. However, an exploratory series of t-tests only revealed a significant difference for the letter M (p < .01), with the bimodal bilinguals producing a higher proportion of responses with initialized ASL translations (all other ps > .12).Footnote 3 It seems unlikely, then, that associations between English words and initialized ASL signs can account for the observed bimodal bilingual disadvantage in letter fluency.
Although not a primary aim of the present study, we did not find evidence that bimodal bilinguals benefitted from enhanced executive control abilities to suppress already produced responses at the end of the letter fluency trial, as suggested for unimodal bilinguals (Friesen et al., Reference Friesen, Luo, Luk and Bialystok2015; Luo et al., Reference Luo, Luk and Bialystok2010). The reliability and validity of bilingual advantages in executive control tasks are currently widely debated (e.g., Paap, Johnson & Sawi, Reference Paap, Johnson and Sawi2015; Valian, Reference Valian2015), and there are only a few relevant studies with bimodal bilinguals. Further research on the relationship between executive control abilities and language processing in different bilingual populations is clearly needed, including hearing and deaf bilingual signers.
In conclusion, despite being immersed in a spoken language-environment from an early age, with vocabulary levels equal to monolingual English speakers, and more opportunities to use both languages than many unimodal bilingual populations, ASL–English bilinguals exhibited word retrieval difficulties in a letter fluency task in their dominant language (English). This result demonstrates that reduced vocabulary size and/or reduced frequency of use cannot completely account for bilingual disadvantages in verbal fluency. Instead, this finding points to an important role for between-language interference in explaining word retrieval difficulties in bilinguals and, by extension, that the two languages of bilinguals compete for selection during language production even when they are expressed with distinct linguistic articulators.