


Loneliness is “an unpleasant experience [that] occurs when a person’s network of social relations is deficient in some important way, either quantitatively or qualitatively” (Perlman & Peplau, Reference Perlman, Peplau, Gilmour and Duck1981, p. 31). Loneliness could induce a number of detrimental effects on physical as well as mental health, such as a heart attack (Ong, Rothstein, & Uchino, Reference Ong, Rothstein and Uchino2012); high blood pressure (Hawkley, Thisted, Masi, & Cacioppo, Reference Hawkley, Thisted, Masi and Cacioppo2010); depression; or dementia (Cacioppo, Hawkley, & Thisted, Reference Cacioppo, Hawkley and Thisted2010; Prieto-Flores, Forjaz, Fernandez-Mayoralas, Rojo-Perez, & Martinez-Martin, Reference Prieto-Flores, Forjaz, Fernandez-Mayoralas, Rojo-Perez and Martinez-Martin2011). Older people have been identified as most vulnerable to loneliness, and a number of risk factors have been identified, including, for example, widowhood (Russell & Taylor, Reference Russell and Taylor2009), poor physical health and increasingly limited physical abilities (Korporaal, Marjolein, van Groenou, & van Tilburg, Reference Korporaal, Marjolein, van Groenou and van Tilburg2008), the decrease of intimate social relations (Heylen, Reference Heylen2010), and societal or cultural factors (De Jong Gierveld & Havens, Reference De Jong Gierveld and Havens2004; Lykes & Kemmelmeier, Reference Lykes and Kemmelmeier2014; Yang & Victor, Reference Yang and Victor2011). In addition, socioemotional selectivity theory (SST) posits that older people value close, emotional, and meaningful relations more than other matters in life as their time span starts to shrink (Carstensen, Reference Carstensen1992; Löckenhoff & Carstensen, Reference Löckenhoff and Carstensen2004). The implication of SST for the study of loneliness is that the increased priority of intimate relations would make older people more vulnerable to loneliness – while they expect more from their social relations, the number of their intimate social relations may have already started to diminish as a result of widowhood and having an empty nest.
How loneliness changes over time is a very important dimension of this socially originated form of mental suffering. People who are regularly lonely over a sustained period of time are expected to be more vulnerable than those who suffer from “bouts” of “transient loneliness”. In other words, loneliness has serious medical implications only when it becomes “chronic” (Cacioppo & Patrick, Reference Cacioppo and Patrick2008, p. 5). Therefore, it is useful to distinguish “cross-sectional loneliness”, which measures a respondent’s loneliness at one time point or during a very short period of time, from “longitudinal loneliness”, which measures the temporal attributes of loneliness, such as the duration of each episode of loneliness, the number of loneliness episodes, and the pattern of relapses over a long period of time. This conceptual distinction could help us better understand the nature of loneliness: The longer the sense of loneliness lasts, the more likely it is a trait rather than a state. It is in the spirit of discovering these longitudinal attributes of loneliness that this study was conducted, although to determine whether the loneliness under study is a trait or a state is beyond the objectives of this study.
Most empirical studies of loneliness analyse data collected from cross-sectional surveys (e.g., Dykstra & Fokkema, Reference Dykstra and Fokkema2007; Stevens & Westerhof, Reference Stevens and Westerhof2006; Victor & Yang, Reference Victor and Yang2012), because for a long time, longitudinal data on loneliness were hard to come by. “In the United Kingdom, the dearth of longitudinal studies of loneliness is acute …” (Victor & Bowling, Reference Victor and Bowling2012, p. 315). For other European nations and the United States, the number of longitudinal studies on loneliness among older people was not large either (Dykstra, van Tilburg, & De Jong Gierveld, Reference Dykstra, van Tilburg and De Jong Gierveld2005). Furthermore, without referring to any temporal features of the experience of loneliness, the most widely used loneliness scales – the UCLA scale (Russell, Reference Russell1996) and the De Jong-Gierveld scale (De Jong Gierveld & van Tilburg, Reference De Jong Gierveld and van Tilburg2010) – measure loneliness at the time when the respondent was interviewed. Some single-item loneliness instruments do provide a time frame, such as “the past week” in the European Social Survey; however, such a time frame is clearly highly restrictive.
During the past decade or so, some progress has been made in studying loneliness with longitudinal data. For example, analysing data collected in the Dutch town of Zutphen from 939 men born from 1900 to 1920, Tijhuis, de Jong-Gierveld, and Feskens (Reference Tijhuis, de Jong-Gierveld and Feskens1999) found that loneliness scores increased for the older group but not for the younger one, and that losing their spouse and moving into a care home were two significant risk factors. Victor, Scambler, and Bond (2009, p. 146-150) reviewed six longitudinal studies of loneliness published at the turn of the new millennium, reporting that although two studies saw loneliness increasing with age, others reported a more stable pattern over time. Later, Victor and Bowling (2012) conducted a follow-up study (1999–2000 to 2007–2008) of 287 people aged 65 and older in Britain and discovered a highly stable pattern of the prevalence of loneliness across the 8-year period, which is broadly consistent with results from other longitudinal studies. In the United States, analysing the data collected from the Chicago Health, Ageing and Social Relations Survey (CHASRS), Cacioppo et al. (Reference Cacioppo, Hawkley and Thisted2010) found that the mean score of the UCLA Loneliness Scale (UCLA-R) remained around 35 to 36 over the 5-year period from 2002 to 2006. There are, however, exceptions to a state of such longitudinal stability of loneliness. For example, from 1988 to 2004, some Finnish researchers (Heikkinen & Kauppinen, Reference Heikkinen and Kauppinen2011) followed several hundred older residents in Jyväskylä and found the prevalence of loneliness significantly increasing over the 16-year period.
The English Longitudinal Study of Ageing (ELSA) is another valuable source of data for studying loneliness longitudinally. It has a nationally representative and large sample, and it has multiple waves covering a long time span for studying longitudinal patterns of loneliness among older people. Analysis of such a dataset would also enable researchers to discover whether the risk factors found to be significant in cross-sectional studies remain so longitudinally. Although this is not the first study that analyses the ELSA data for studying loneliness, other researchers analysing this dataset have not revealed longitudinal trajectories of loneliness and related risk factors because they were concerned with other issues.
For example, some analysed the data collected in the second wave of ELSA alone (Shankar, McMunn, & Banks, Reference Shankar, McMunn and Banks2011; Steptoe, Shankar, Demakakos, & Wardle, Reference Steptoe, Shankar, Demakakos and Wardle2013), leaving the longitudinal features of loneliness untouched, as it was the first wave that included measures on loneliness. Chou, Cacioppo, Kumari, and Song (Reference Chou, Cacioppo, Kumari and Song2014) analysed the data collected from two waves of ELSA (2003/4 and 2006/7) and discovered the interactive effect of the CRHR1 gene with a lack of support from adult children on loneliness among older adults in England. Because they analysed only two waves of data, such studies could not show the shape of the “process of change”, nor could they distinguish true change from measurement errors (Singer and Willett, Reference Singer and Willett2003, p. 10). Shankar, Rafnsson, and Steptoe (Reference Shankar, Rafnsson and Steptoe2015) analysed multiple waves of the ELSA data, but they treated loneliness as an explanatory variable of physical as well as mental well-being. Another recent study analysed a sample of survivors in waves 2 to 6 of ELSA (Pikhartova, Bowling, & Victor, Reference Pikhartova, Bowling and Victor2016), but its focus was the effect of the respondents’ expectations of loneliness on the actual level of loneliness rather than which risk factors affected the respondents’ longitudinal loneliness.
Analysing the sample of all respondents who participated in two or more waves of ELSA, and taking the UCLA three-item summed score of loneliness as the response variable, this study aims to make the following contributions: (1) to reveal the patterns of longitudinal loneliness; (2) to test the longitudinal stability of loneliness; and (3) to discover whether the risk factors identified in cross-sectional studies remain statistically significant longitudinally. The third contribution is perhaps the most significant. In particular, most existing studies focus on the presence or absence of the respondent’s social relations – for example, living with spouse or children. This study goes a step further by examining whether the perceived closeness of the respondent’s relations with their spouse (or partner), and the number of children, other family members, and friends that they felt close to, affected their chance of feeling lonely.
Data and Methods
Sources of Data
Data for this study came from waves 2 to 6 of ELSA, whose samples were drawn from the Health Survey for England (HSE). The target population were those aged 50 and older in England. The first wave started in 2002, and the following waves were conducted subsequently every two years. Wave 2 was the first that included measures of loneliness and is used here as the baseline, with a valid sample size of 9,171. Since the third wave, a refreshment sample of about one to two thousand was added in order to make up for attrition. Steptoe, Breeze, Banks, and Nazroo (Reference Steptoe, Breeze, Banks and Nazroo2013) produced a detailed cohort profile of ELSA, and acknowledged that “[t]he analysis of response rates and attrition from ELSA is complicated because of variations in responses to different elements of the study, deaths and differences between core and refreshment cohorts” (2013; p. 1642). According to their analysis, attrition rates varied from about 20 per cent to 40 per cent. They and other researchers (Banks, Breeze, Lessof, & Nazroo, Reference Banks, Breeze, Lessof and Nazroo2006; Marmot, Banks, Blundell, Lessof, & Nazroo, Reference Marmot, Banks, Blundell, Lessof and Nazroo2003) confirmed that those who failed to continue to participate “tended to be older, less wealthy, less educated” but “more likely to come from a non-managerial occupation and suffer from a limiting long-standing illness” (2013; p. 1642). The dataset for this study included all respondents who participated and offered valid responses to the loneliness questions for two or more waves. It is therefore sensible to expect that the respondents included in this study were less lonely than those who dropped out.
Measurement of Loneliness
This study used the three-item UCLA loneliness scale:
-
(1) How often do you feel you lack companionship?
-
(2) How often do you feel left out?
-
(3) How often do you feel isolated from others?
For each question, the respondent could choose one of the following options: 1 = Hardly ever or never, 2 = Some of the time, and 3 = Often. Thus, the summed score of these three items ranged from 3 to 9, with a higher score indicating a higher level of loneliness. This short scale had good internal reliability (Cronbach’s α = 0.82) as well as strong and positive correlations with the full UCLA loneliness scale (Hughes, Waite, Hawley, & Cacioppo, Reference Hughes, Waite, Hawley and Cacioppo2004).
Co-variates
Three sets of co-variates widely recognized as risk factors for loneliness in the literature were included in the following statistical analyses. The first contained three demographic variables: gender, age (capped at 90 and centred at its grand mean), and marital status (simplified into four categories: 1 = Single, 2 = Married or civil partnership, 3 = Separated, divorced, or dissolved, and 4 = Widowed). The second set included two variables related to health: self-reported general health conditions (5 = Excellent, 4 = Very good, 3 = Good, 2 = Fair, and 1 = Poor) and whether the respondent had a limiting long-term illness (1 = Yes, 0 = No). The third set contained four variables describing the quality and the quantity of the respondent’s social relations: how close they felt they were to their spouse (or partner) (4 = Very close, 3 = Quite close, 2 = Not very close, and 1 = Not at all close), and the number of children, the number of family members, or the number of friends they had close relationships with, respectively. These were all inherently quantitative variables, although their actual values were limited.
Missing Values
As “participants who drop out between ELSA waves have been shown to be less healthy, wealthy, socially connected and more lonely than those who remain in the study (Scholes, Taylor, Cheshire, Cox, & Lessof, Reference Scholes, Taylor, Cheshire, Cox and Lessof2008; Shankar et al., Reference Shankar, McMunn and Banks2011; Shankar, Hamer, McMunn, & Steptoe, Reference Shankar, Hamer, McMunn and Steptoe2013) and report poorer well-being” (Shankar, Rafnsson, & Steptoe, Reference Shankar, Rafnsson and Steptoe2015), the missing values of the variables were very likely not missing at random. In addition, as shown below, the distribution of the summed score of the 3-item UCLA scale was not normal. Thus, multiple imputations for missing values were not implemented (Leech, Barrett, & Morgan, Reference Leech, Barrett and Morgan2015, p. 293). Cases without a valid summed score of the 3-item UCLA scale – at least one of the three items was missing – were excluded from the subsequent analyses. The number of such cases increased from 1,263 at wave 2 to 4,421 at wave 6.
Statistical Methods and Models
The wave number was used as a metric of time. Bivariate statistics were produced for describing the longitudinal changes between two consecutive waves, and generalized linear mixed models were constructed to measure the effects of the co-variates on loneliness over the five waves. Three statistical models were constructed and estimated for different purposes. The first included time and selected predictors of loneliness. A second model took the change of the loneliness score as the response variable with the change of selected predictors as explanatory variables. Longitudinal sampling weights were applied for the calculation of the descriptive statistics but not for the mixed-effects models I present below.
Hypotheses
I conducted the statistical analyses to test the following important hypotheses:
Hypothesis 1: There was no significant change of the mean scores of loneliness from wave 2 to wave 6.
Hypothesis 2: Correlations of cross-wave loneliness scores remained high (above 0.5) and consistent over time.
Hypothesis 3: The probability of feeling often lonely over time among the married was statistically significantly lower than that among those of other marital statuses.
Hypothesis 4: Closeness to spouse (or partner) had a statistically significant effect on feeling often lonely over time.
Hypothesis 5: Good self-reported general health significantly lowered the probability of feeling often lonely over time.
Hypothesis 6: Having a limiting and long-term illness significantly increased the probability of feeling often lonely over time.
Results
Descriptive Statistics
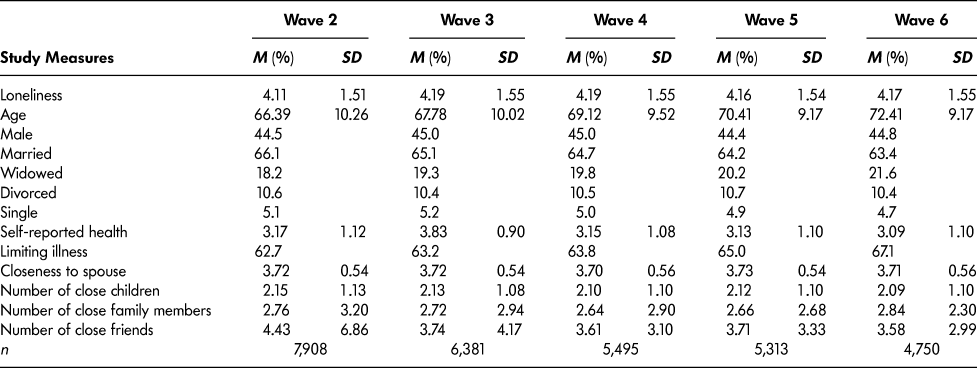
The mean (or percentage) and standard deviation for each variable at each wave of ELSA are presented in Table 1. The mean of the response variable “summed score of the 3-item UCLA loneliness scale” increased from 4.11 at wave 2 to 4.19 at waves 2 and 3, and then declined slightly to 4.16 and 4.17 at the last two waves, respectively, which suggests an overall longitudinal non-linear increase of the average level of loneliness.
Descriptive statistics of the English Longitudinal Study of Ageing (ELSA) by wave

The mean of age did not increase by exactly two years across two consecutive waves, because it depended on who participated in these waves. The percentage of males remained extremely stable across the waves at around 45 per cent. Not surprisingly, the percentage of married respondents and those in civil partnerships slowly declined from 66 per cent at wave 2 to about 63 per cent at wave 6; those widowed increased gradually from 18 per cent to more than 21 per cent; and the percentage of the divorced and the singles remained about the same over the waves. The scores of self-reported general health followed the same longitudinal pattern as that of loneliness scores: going up at waves 2 to 3 and then declining at the remaining three waves. The percentage of respondents with an illness that limited their daily life remained in the range of 63 per cent to 67 per cent, increasing slightly over the first three waves and more rapidly at the last two waves. The respondents who were married (or in a civil partnership) felt very close to their spouses: the mean stayed at 3.7 for all waves, very close to the maximum (4). On average, the respondents had more than two children, more than two other family members, and about three to four friends to whom they felt close, which, like most other factors, showed a very high level of longitudinal stability.
Testing Growth Trajectories
For the studied sample, the equal variance and co-variance hypothesis was rejected as Mauchly’s test of sphericity was highly significant (W = 0.889, df = 9, and p < 0.001). The corresponding F test of equal means over time was highly significant as well (F = 9.927, df = 4, and p < 0.001), providing strong evidence for rejecting the first hypothesis of equal means of the loneliness scores over time. Thus, the construction of the following mixed-effects models on the summed longitudinal loneliness scores was justified.
Between-Wave Correlations of the Summed Loneliness Scores
To reveal how the summed loneliness scores changed across two consecutive waves, the percentages of three types of between-wave scores (decrease, no change, and increase) are presented in Table 2: about 21 per cent of the respondents’ loneliness scores decreased between two consecutive waves, 55 per cent had no change, and 23 per cent increased. In addition, given that the distribution of the summed loneliness scores was strongly skewed to the right (that is, at every wave the percentage of respondents quickly declined with the increase of loneliness score; results omitted), Spearman’s rather than Pearson’s correlation coefficients were produced (the fourth row of Table 2). These coefficients, all around 0.6, indicate a relatively strong and stable between-wave correlation of loneliness scores, thus lending support for Hypothesis 2.
Percentage distribution of cross-wave summed score of the 3-item UCLA loneliness scale

*** p < 0.001.
Mixed-Effects Models on the Summed Loneliness Score
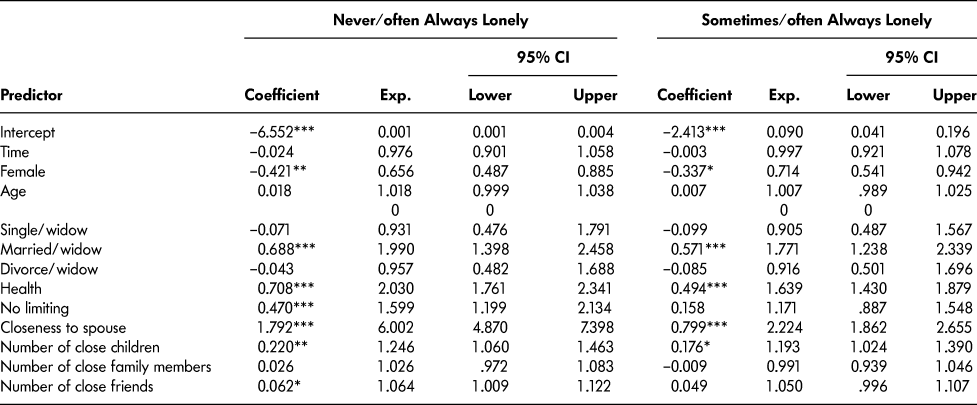
The skewness of the summed loneliness scores’ distribution made it sensible to recode the scores into ordered categories, a strategy adopted in Shankar et al. (Reference Shankar, Rafnsson and Steptoe2015) who recoded the scores into two categories. Here, it was recoded into three categories: 3 = Never lonely, 4–6 = Sometimes lonely, and 7–9 = Often and always lonely. Two ordinal mixed logistic regression models were then constructed, with “often/always lonely” as the reference category (Table 3).
Multinomial mixed logistic regression model on categorical loneliness score

***p < 0.001; ** p < 0.01; * p < 0.05.
The first model was a binary logistic regression model that contrasted those who were “never lonely” with those “often or always lonely”, and the second contrasted he “sometimes lonely” with the “often or always lonely”. Results for the two models were clearly very consistent. Perhaps the first important observation was that neither time (wave number) nor age was statistically significant. The interaction terms between time and each of the predictors were then added to this model; I found no need to present the results here, however, as none of the terms was statistically significant, confirming that the predictors did not depend on time.
For the effects of marital status, with “the widowed” as the reference category, the singles and the divorced or separated had no statistically significant effects on the relative chance of feeling lonely in both models. The married (or in civil partnership), in great contrast but perhaps not surprisingly, enjoyed a statistically significant chance of not feeling lonely often with reference to the widowed, lending support to the third hypothesis. Moreover, how close the respondent felt to their spouse or partner was highly significant, and this is true for both models, giving support to the fourth hypothesis. In other words, what matters was not merely that an older person was married (or had a partner) but also the quality of the relationship: the perceived level of closeness of their relationship with spouse (or partner) greatly enhanced the chance of being never or only sometimes lonely as opposed to often or always being lonely. The number of children an older respondent felt close to was also statistically significant for both models, although to a lesser extent in terms of both the magnitude and the level of statistical significance. The number of other family members an older respondent felt close to was not statistically significant, whereas the number of friends an older respondent felt close to was statistically significant for being “never lonely” at the 0.05 level but not so for being “sometimes lonely”, relative to “often and always lonely”. Together, these results pointed to an emerging hierarchy of social relations in terms of their effects on the level of loneliness: the relationship with spouse or partnership was the most important, followed by those with children, friends, and other family members, offering new empirical evidence to a theory of a similar hierarchy of social support to people in stress (Kahn & Antonucci, Reference Kahn, Antonucci, Baltes and Brim1980).
For the two health predictors, “self-reported general health” was highly significant – the better the perceived health, the more likely an older respondent would feel never or sometimes lonely as opposed to feeling often or always lonely. This was not the case for having a health condition that limited the daily life of the respondent, which was only significant for “never lonely” in comparison with “often or always lonely”. Thus, the fifth hypothesis gained some supporting evidence, but the sixth did not.
The Effects of the Changes of Predictors on the Change of Loneliness Scores
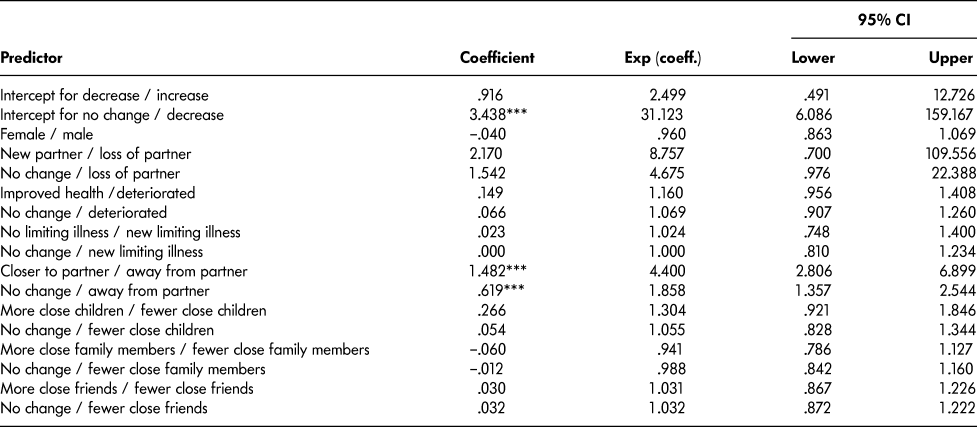
The above-described models did not directly take the change of the loneliness scores as the target; rather, they took their values as the direct target although they took into account the clustering effect of these scores over time for each respondent. To model the effects of the changes of selected predictors on the cross-wave change of loneliness scores, I created a new dataset. For loneliness, the change score equals the score at wave n minus the score at wave (n – 1). I then recoded these differences into three categories (increase if the change score was positive, indicating more frequent or worsening loneliness; no change if the changes score was zero; and decrease if the change score was negative, for less frequent or improving loneliness). My purpose was to discover which predictors were responsible for the changes of loneliness scores among older people in England. Change of age was not included anymore as it was constant. Gender was included as a fixed control variable. I included the change of each of the following predictors as predictors: having a spouse (or partner), self-reported general health, having a limiting long-term illness, closeness to spouse/partner, number of close children, number of close family member, and number of close friends. As the interest shifted to the changes of these predictors, their values were all recoded into three categories: increase, no change, and decrease (results presented in Table 4).
Multinomial logistic mixed-effects model on change of loneliness score

*** p < 0.001.
CI = confidence interval
Only two coefficients were found to be statistically significant in this model. The first was the intercept for the relative difference between the “no change” group and the “increasingly lonely” group; that is, when there was no change in all predictors of this model – that is, all being 0 – then a respondent was at least six times more likely to experience no change in their loneliness score over two consecutive waves, which was not surprising given that nearly 60 per cent of the respondents experienced no change in their loneliness scores. The second factor with a statistically significant coefficient was the change of the respondents’ closeness to their spouse or partner. Feeling closer to their spouse or partner from one wave to the next increased the odds of having reduced frequency of loneliness by more than four times, and even having no change in the closeness of relationship to their partner across waves would increase the chance of decreased frequency of loneliness by nearly twice, which clearly showed the importance of the change of relationship with their spouse or partner in reducing the summed loneliness score. This lent further support to the fourth hypothesis. The changes of all other predictors were found statistically not significant.
Discussion
This study has revealed the longitudinal patterns of loneliness among older people and the effects of selected predictors in England over the time period of 2004 to 2012. The results were broadly consistent with those from other longitudinal studies of loneliness among older people (Heikkinen & Kauppinen, Reference Heikkinen and Kauppinen2011; Holmen & Furukawa, Reference Holmen and Furukawa2002; Jylhä, Reference Jylhä2004; Wenger & Burholt, Reference Wenger and Burholt2004; Victor & Bowling, Reference Victor and Bowling2012). If scores of 3 and 4 in this study were taken as equivalent to the category of “never or almost never lonely” in other studies, then about two-thirds of the respondents fell into this category, and the prevalence was remarkably stable (66.8% to 69.4%). For the “severely lonely” or “most frequently lonely” group, the percentages found in other studies were around 10 per cent; for this study, with the summed scores 7, 8, and 9 being classified as “severely” or “frequently”, the percentages were in the range of 8.2 per cent to 9.7 per cent, very close to those in other studies; if only the score of 9 was classified as “severely lonely”, the percentage would decrease to about 2 per cent, which again remained almost the same over the 8-year period. Given the strong correlations between cross-wave scores, this 2 per cent of older adults deserve the most attention: once they felt often lonely at one time point, it would be very likely that they felt the same two years later, and some of them would feel frequently lonely over the whole 8-year period.
Some findings from this study, however, differed from those of existing studies. First of all, the percentage of respondents whose scores experienced no change over time – about 55 per cent – was considerably lower than the 70 per cent reported by Dykstra et al. (Reference Dykstra, van Tilburg and De Jong Gierveld2005) and Victor and Bowling (Reference Victor and Bowling2012). Correspondingly, the percentages of “increase” (or “worsening”, 23% to 25%) and “decrease” (or “improving”, 21%) in this study were respectively much higher than those in the other studies (10%–15%). A series of factors could contribute to these differences across studies, one of which could be the more refined scale of the range 3 to 9 used in this study that captured more nuanced changes, in contrast to the categorical measurements used in most of other studies; other factors such as sampling scheme and sample size, timing of waves, and the measurements of loneliness could play a role as well.
Regarding the predictors for longitudinal loneliness, some of the results from this study were consistent with those in other studies, although others were not. First of all, given researchers’ key interest in the longitudinal change of loneliness, the remarkable stability found in this study and others was in great contrast to the findings from cross-sectional studies (for example, Victor and Yang, Reference Victor and Yang2012) – both loneliness itself and the effects of selected predictors including being female, self-perceived health conditions, illness with limiting effect, and closeness to spouse and children remained considerably stable longitudinally. The most notable difference between this study and others lay in the effect of marital status. Whereas other researchers found the effect of the loss of a spouse or partner statistically significant for predicting loneliness (Dykstra et al., 2005; Heikkinen & Kauppinen, Reference Heikkinen and Kauppinen2011), in this study, it was the perceived closeness to their spouses or partners in addition to the presence of their spouses or partners that had a significant effect on the level of loneliness. One possible explanation might be that the difference between these findings could be attributed to the possibility that the effect of marital status was overwhelmed by the variable of “closeness to spouse or partner” – the “closeness” variable presumed no loss of spouse/partner, and the percentage of respondents losing spouse/partner was very small. Thus, this study has provided new evidence for such an effect that was found in studies based on cross-sectional data (Dykstra & Fokkema, Reference Dykstra and Fokkema2007; Stevens and Westerhof, Reference Stevens and Westerhof2006).
This study has several limitations. Perhaps the most important one is that although it revealed the longitudinal change of loneliness and analysed the longitudinal effects of selected predictors on the change of loneliness, it did not make use of the longitudinal order of the predictors when modelling their causal effects on loneliness. To do this, a separate study using longitudinal structural equation models will be needed. For the measurement of loneliness, ELSA contains two other single-item instruments, which I did not analyse here due to limited space, although I found that the single-item and multi-item instruments to be highly correlated and therefore interchangeable (Victor et al., Reference Victor, Scambler and Bond2009). In addition, the selection of the predictors was obviously constrained by the questions included in the original ELSA questionnaire; thus, theoretically important predictors found significant in other empirical studies, such as the number of confidants and migration, were not included here. Finally, the limited space meant that the article could not present results using different measures of loneliness so that the robustness of the results could be examined.
Conclusions
I can summarize the key findings of this study more generally as in the following. Fewer than one in 10 older people in England felt often lonely, and this remained so throughout the years from 2004 to 2012. The distribution of older people across different levels of loneliness remained stable over time, first because the loneliness of a little more than half of older people did not change, whereas about one quarter became lonelier and the remaining one quarter became less lonely. The most worrying were those who remained very lonely consistently throughout the years, which constituted about 2 per cent of the sample, and who deserve the most serious attention and interventions from those who have the responsibility of looking after them.
As the risk factors (or aetiologies) for loneliness, longitudinal loneliness and cross-sectional loneliness share the same factors of marital status, social relations, and health. More specifically, this study has confirmed that those married (or in civil partnership) were significantly less lonely over time than the widowed, those with more children and friends that they felt close to were less lonely than those who had fewer, and those who felt healthier were less lonely than those who were less confident of their health. What differentiates these two forms of loneliness was the role of spouse (or partner). Older people in England tended to value their relationship with their spouse more than any other social relations over time, most likely because both their time horizon and social networks were shrinking. In addition to having a spouse or partner, how close they felt to their spouse (or partner) was particularly responsible for longitudinal loneliness or a temporal increase in loneliness. Those who felt closer and closer to their spouse over time enjoyed a significantly reduced risk of loneliness.
Several implications can be derived from the findings of this study for practitioners and policy-makers in order to tackle loneliness among older people. First, they are urged to target the 2 per cent of older people who frequently feel lonely over a long period of time (several years), as they are the most likely to become patients of more serious physical and mental illnesses such as those I listed at the beginning of this article. Second, health conditions and relations with their own family members seemed to be the two most powerful factors affecting the likelihood and the longitudinal persistence of feeling lonely, and so deserve serious attention by practitioners when identifying potential victims and helping existing sufferers. Finally, although this study has found that about 21 per cent of older people’s loneliness grew worse and another 23 per cent improved over time, we still do not know much about why and how these changes happened. For example, an intriguing issue is that the attributes and strategies of older adults and their families that helped these adults grow out of loneliness might not be the same as those for preventing them growing into loneliness; in other words, the causal connections might not be symmetrical. Much research is needed to find out the exact mechanisms in different contexts.