1. Introduction
The resonant wave–particle interaction is known to be one of the main drivers of dynamics of such space plasma systems as planetary radiation belts (e.g. Thorne Reference Thorne2010; Menietti et al. Reference Menietti, Shprits, Horne, Woodfield, Hospodarsky and Gurnett2012), collisionless shock waves (e.g. Balikhin et al. Reference Balikhin, de Wit, Alleyne, Woolliscroft, Walker, Krasnosel'skikh, Mier-Jedrzejeowicz and Baumjohann1997; Wilson et al. Reference Wilson, Cattell, Kellogg, Goetz, Kersten, Hanson, MacGregor and Kasper2007, Reference Wilson, Koval, Szabo, Breneman, Cattell, Goetz, Kellogg, Kersten, Kasper and Maruca2012; Wang et al. Reference Wang, Vasko, Mozer, Bale, Artemyev, Bonnell, Ergun, Giles, Lindqvist and Russell2020), auroral acceleration region (e.g. Chaston et al. Reference Chaston, Salem, Bonnell, Carlson, Ergun, Strangeway and McFadden2008; Watt & Rankin Reference Watt and Rankin2009; Mauk et al. Reference Mauk, Haggerty, Paranicas, Clark, Kollmann, Rymer, Bolton, Levin, Adriani and Allegrini2017) and solar wind (e.g. Krafft & Volokitin Reference Krafft and Volokitin2016; Kuzichev et al. Reference Kuzichev, Vasko, Rualdo Soto-Chavez, Tong, Artemyev, Bale and Spitkovsky2019; Roberg-Clark et al. Reference Roberg-Clark, Agapitov, Drake and Swisdak2019; Tong et al. Reference Tong, Vasko, Artemyev, Bale and Mozer2019; Yoon et al. Reference Yoon, Seough, Salem and Klein2019). The classical quasi-linear theory (Drummond & Pines Reference Drummond and Pines1962; Vedenov, Velikhov & Sagdeev Reference Vedenov, Velikhov and Sagdeev1962) and its generalizations for inhomogeneous plasma systems (Ryutov Reference Ryutov1969; Lyons & Williams Reference Lyons and Williams1984) describe well charged particle resonant interaction with low-amplitude broadband waves (Karpman Reference Karpman1974; Shapiro & Sagdeev Reference Shapiro and Sagdeev1997; Tao et al. Reference Tao, Bortnik, Albert and Thorne2012a; Camporeale & Zimbardo Reference Camporeale and Zimbardo2015; Allanson et al. Reference Allanson, Watt, Ratcliffe, Allison, Meredith, Bentley, Ross and Glauert2020).
One of the important examples of the application of the quasi-linear theory is the Earth radiation belt models that describe energetic electron acceleration and losses due to resonances with electromagnetic whistler-mode waves and electromagnetic ion cyclotron (EMIC) waves (see reviews Millan & Thorne (Reference Millan and Thorne2007), Shprits et al. (Reference Shprits, Subbotin, Meredith and Elkington2008), Nishimura et al. (Reference Nishimura, Bortnik, Li, Thorne, Lyons, Angelopoulos, Mende, Bonnell, Le Contel and Cully2010), Thorne et al. (Reference Thorne, Ni, Tao, Horne and Meredith2010), Ni et al. (Reference Ni, Thorne, Zhang, Bortnik, Pu, Xie, Hu, Han, Shi and Zhou2016) and references therein). Moreover, the natural inhomogeneity of the background magnetic field and plasma density in the radiation belts can significantly weaken the conditions of applicability of the quasi-linear theory (Solovev & Shkliar Reference Solovev and Shkliar1986; Albert Reference Albert2001, Reference Albert2010). However, this theory meets difficulties in describing resonances with sufficiently intense waves (Shapiro & Sagdeev Reference Shapiro and Sagdeev1997), when the nonlinear effects of phase trapping and phase bunching become important (Omura et al. Reference Omura, Matsumoto, Nunn and Rycroft1991; Shklyar & Matsumoto Reference Shklyar and Matsumoto2009; Albert, Tao & Bortnik Reference Albert, Tao and Bortnik2013; Artemyev et al. Reference Artemyev, Neishtadt, Vainchtein, Vasiliev, Vasko and Zelenyi2018a). Indeed, sufficiently intense whistler-mode waves are frequently observed in the radiation belts (Cattell et al. Reference Cattell, Wygant, Goetz, Kersten, Kellogg, von Rosenvinge, Bale, Roth, Temerin and Hudson2008; Wilson et al. Reference Wilson, Cattell, Kellogg, Wygant, Goetz, Breneman and Kersten2011; Agapitov et al. Reference Agapitov, Artemyev, Mourenas, Krasnoselskikh, Bonnell, Le Contel, Cully and Angelopoulos2014) and contribute significantly to wave statistics (Zhang et al. Reference Zhang, Thorne, Artemyev, Mourenas, Angelopoulos, Bortnik, Kletzing, Kurth and Hospodarsky2018, Reference Zhang, Mourenas, Artemyev, Angelopoulos, Bortnik, Thorne, Kurth, Kletzing and Hospodarsky2019; Tyler et al. Reference Tyler, Breneman, Cattell, Wygant, Thaller and Malaspina2019). Theoretically, phase trapping and bunching (also called nonlinear scattering) effects are responsible for fast acceleration (e.g. Demekhov et al. Reference Demekhov, Trakhtengerts, Rycroft and Nunn2006, Reference Demekhov, Trakhtengerts, Rycroft and Nunn2009; Omura, Furuya & Summers Reference Omura, Furuya and Summers2007; Hsieh & Omura Reference Hsieh and Omura2017a; Hsieh, Kubota & Omura Reference Hsieh, Kubota and Omura2020) and losses (e.g. Kubota, Omura & Summers Reference Kubota, Omura and Summers2015; Kubota & Omura Reference Kubota and Omura2017; Grach & Demekhov Reference Grach and Demekhov2020) of energetic electrons and for the generation of coherent whistler-mode waves (Omura, Katoh & Summers Reference Omura, Katoh and Summers2008; Demekhov Reference Demekhov2011; Nunn & Omura Reference Nunn and Omura2012; Omura, Nunn & Summers Reference Omura, Nunn and Summers2013; Katoh Reference Katoh2014; Tao Reference Tao2014; Katoh & Omura Reference Katoh and Omura2016). There are many observational evidences of such nonlinear resonant wave generation (Titova et al. Reference Titova, Kozelov, Jiricek, Smilauer, Demekhov and Trakhtengerts2003; Cully et al. Reference Cully, Angelopoulos, Auster, Bonnell and Le Contel2011; Tao et al. Reference Tao, Li, Bortnik, Thorne and Angelopoulos2012b; Mourenas et al. Reference Mourenas, Artemyev, Agapitov, Krasnoselskikh and Mozer2015) and of the related electron acceleration/losses (e.g. Foster et al. Reference Foster, Erickson, Baker, Claudepierre, Kletzing, Kurth, Reeves, Thaller, Spence and Shprits2014; Agapitov et al. Reference Agapitov, Artemyev, Mourenas, Mozer and Krasnoselskikh2015b; Mourenas et al. Reference Mourenas, Artemyev, Agapitov, Mozer and Krasnoselskikh2016a; Chen et al. Reference Chen, Breneman, Xia and Zhang2020; Gan et al. Reference Gan, Li, Ma, Artemyev and Albert2020b).
The quasi-linear diffusion theory describes a sufficiently weak scattering in energy/pitch-angle space and operates with a Fokker–Planck diffusion equation for the charged particle distribution function (Andronov & Trakhtengerts Reference Andronov and Trakhtengerts1964; Kennel & Engelmann Reference Kennel and Engelmann1966; Lerche Reference Lerche1968). In contrast to this description, the nonlinear phase trapping assumes a fast transport in energy/pitch-angle space (e.g. Furuya, Omura & Summers Reference Furuya, Omura and Summers2008; Artemyev et al. Reference Artemyev, Vasiliev, Mourenas, Agapitov, Krasnoselskikh, Boscher and Rolland2014b), when even a single resonant interaction changes significantly the electron's energy/pitch-angle (e.g. Albert et al. Reference Albert, Tao and Bortnik2013; Artemyev et al. Reference Artemyev, Neishtadt, Vainchtein, Vasiliev, Vasko and Zelenyi2018a). This essentially non-diffusive process cannot be directly included into the Fokker–Planck equation. One possible approach is the construction of an operator that would describe fast charged particle jumps in the energy/pitch-angle; this operator can be constructed with the numerical (test-particle) approach (e.g. Hsieh & Omura Reference Hsieh and Omura2017b; Zheng, Chen & Zhu Reference Zheng, Chen and Zhu2019) or with the analytical calculation of jumps’ probabilities (e.g. Vainchtein et al. Reference Vainchtein, Zhang, Artemyev, Mourenas, Angelopoulos and Thorne2018). The main advantage of this approach is the inclusion of an almost arbitrary (as realistic as needed) wave spectrum and characteristics (e.g. wave modulation and frequency drifts, see Kubota & Omura (Reference Kubota and Omura2018), Artemyev, Vasiliev & Neishtadt (Reference Artemyev, Vasiliev and Neishtadt2019b) and Hiraga & Omura (Reference Hiraga and Omura2020)). The main disadvantages are an accumulation of numerical errors with running time, and the almost intractable fine details of the energy/pitch-angle space binning needed to simultaneously resolve large jumps due to trapping and small changes due to drift/diffusion.
An alternative approach to the construction of such an operator is a generalization of the Fokker–Planck equation to include effects of phase trapping and phase bunching (Solovev & Shkliar Reference Solovev and Shkliar1986; Artemyev et al. Reference Artemyev, Neishtadt, Vasiliev and Mourenas2016b, Reference Artemyev, Neishtadt, Vasiliev and Mourenas2017). This approach is based on a fine balance of trappings and bunchings for a single wave system (e.g. Shklyar Reference Shklyar2011; Artemyev, Neishtadt & Vasiliev Reference Artemyev, Neishtadt and Vasiliev2019a). The main advantage of this approach is that the evolution of a charged particle distribution function can be investigated in arbitrary detail in the presence of phase trapping, phase bunching and diffusion (e.g. Artemyev et al. Reference Artemyev, Neishtadt, Vasiliev and Mourenas2018b, Reference Artemyev, Neishtadt and Vasiliev2019a). The main disadvantage is that there is no straightforward generalization of this approach for multiwave (multiresonance) systems. A single-wave resonance results in charged particle transport in the energy/pitch-angle space along one-dimensional (1-D) curves, so-called resonance surface curves (e.g. Lyons & Williams Reference Lyons and Williams1984; Summers, Thorne & Xiao Reference Summers, Thorne and Xiao1998), and the Fokker–Planck equation with trapping was derived for such a quasi-1-D system (Artemyev et al. Reference Artemyev, Neishtadt, Vasiliev and Mourenas2016b).
Another alternative for the description of charged particle distribution evolution driven by nonlinear wave–particle interaction (phase trapping and bunching) is the mapping technique that describes the characteristics of the Fokker–Planck equation (Van Kampen Reference Van Kampen2003). The classical example of this approach is the Chirikov map (Chirikov Reference Chirikov1979), which describes particle diffusion and is widely used for systems with wave–particle resonances (e.g. Vasilev et al. Reference Vasilev, Zaslavskii, Natenzon, Neishtadt and Petrovichev1988; Zaslavskii et al. Reference Zaslavskii, Zakharov, Neishtadt, Sagdeev and Usikov1989; Benkadda, Sen & Shklyar Reference Benkadda, Sen and Shklyar1996; Khazanov, Tel'nikhin & Kronberg Reference Khazanov, Tel'nikhin and Kronberg2013, Reference Khazanov, Tel'nikhin and Kronberg2014). Such a map has been constructed for a single-wave system with phase trapping and phase bunching effects (Artemyev, Neishtadt & Vasiliev Reference Artemyev, Neishtadt and Vasiliev2020b). In this study we show the generalization of this map for a multiresonance system.
We consider a strong magnetic field system, where charged particle motion is very gyrotropic and magnetic moments are well-conserved away from the resonances. Thus, three-dimensional velocity space can be reduced to 2-D energy/pitch-angle space. The mapping for this space should describe 2-D charged particle motion due to energy/pitch-angle jumps with the time intervals between jumps equal to the interval between passages through the resonances. Diffusive jumps (with zero mean values) and jumps driven by nonlinear phase bunching and phase trapping depend on the resonant phase  $\varphi _R$, i.e. a variable proportional to the particle gyrophase, which changes fast. In low wave intensity systems this phase is randomly distributed over the entire (
 $\varphi _R\in [0,2{\rm \pi} ]$) range, and the phase dependence
 $\sim \sin \varphi _R$ can be directly included into the map (Vasilev et al. Reference Vasilev, Zaslavskii, Natenzon, Neishtadt and Petrovichev1988; Zaslavskii et al. Reference Zaslavskii, Zakharov, Neishtadt, Sagdeev and Usikov1989; Benkadda et al. Reference Benkadda, Sen and Shklyar1996; Khazanov et al. Reference Khazanov, Tel'nikhin and Kronberg2013, Reference Khazanov, Tel'nikhin and Kronberg2014). The phase bunching and phase trapping operate in certain
 $\varphi _R$ ranges (e.g. Albert Reference Albert1993; Itin, Neishtadt & Vasiliev Reference Itin, Neishtadt and Vasiliev2000; Grach & Demekhov Reference Grach and Demekhov2020), whereas jumps depend on
 $\varphi _R$ quite non-monotonically (see Artemyev et al. Reference Artemyev, Vasiliev, Mourenas, Agapitov and Krasnoselskikh2014a, Reference Artemyev, Neishtadt, Vainchtein, Vasiliev, Vasko and Zelenyi2018a). However, due to phase randomization between two successive resonances (see the appendix in Artemyev et al. (Reference Artemyev, Neishtadt and Vasiliev2020b)), the phase dependence can be reduced to a simplified determination of ranges corresponding to phase trapping
 $\varphi _R\in [0,2{\rm \pi} \varPi ]$ and phase bunching
 $\varphi _R\in [\varPi ,2{\rm \pi} ]$ where
 $\varPi < 1$ is the probability of trapping (see, e.g. Artemyev et al. Reference Artemyev, Neishtadt, Vainchtein, Vasiliev, Vasko and Zelenyi2018a). The phase gain between two resonances is a large value depending on particle energy and pitch-angle, but this dependence can be omitted in the leading approximation (see discussion in Artemyev et al. (Reference Artemyev, Neishtadt and Vasiliev2020b)). Therefore, in this study we consider charged particle transport in the energy/pitch-angle space due to nonlinear resonant interaction under assumption of resonant phase randomization (limitations of this assumption have been studied in Artemyev, Neishtadt & Vasiliev (Reference Artemyev, Neishtadt and Vasiliev2020a)).
The paper structure includes a description of the basic system properties and examples of multiresonant systems observed in the Earth's radiation belts (§ 1). We present three examples: with two whistler-mode waves providing two cyclotron resonances; with one oblique whistler-mode wave providing cyclotron and Landau resonances; and with one whistler-mode wave and one EMIC wave providing two different cyclotron resonances. Then we focus on the first example and construct the map for this system (§ 2). Theoretical results derived from this map are verified with test particle simulations. At the end of the paper we discuss the constructed map and possible extensions of the proposed approach (§ 3).
2. Basic system properties
The Hamiltonian of a relativistic charged particle (e.g. an electron with rest mass  $m_e$ and charge
 $-e$) moving in the 2-D inhomogeneous magnetic field of the Earth dipole and interacting with electromagnetic waves (in the low amplitude limit with the wave energy
 $U_w$ much smaller than electron energy
 $\sim m_{ec}^{2}$, where
 $c$ is the speed of light) can be written as (e.g. Albert et al. Reference Albert, Tao and Bortnik2013; Artemyev et al. Reference Artemyev, Neishtadt, Vasiliev and Mourenas2018b)
 \begin{equation} \left.\begin{array}{c} H = m_{e} c^{2} \gamma + U_w ( {s,I_x } )\sin ( {\phi \pm n\psi } ),\\ \gamma = \sqrt {1 + \dfrac{{p_\parallel ^2 }}{{m_e^2 c^2 }} + \dfrac{{2I_x \varOmega_\textrm{ce} }}{{m_{e} c^{2} }}} , \end{array}\right\}\end{equation}
where two pairs of conjugate variables are  $(s, p_\parallel )$ (the field-aligned coordinate and momentum) and
 $(\psi , I_x)$ (gyrophase and momentum
 $I_x=c\mu /e$;
 $\mu$ is the classical magnetic moment). The electron gyrofrequency
 $\varOmega _\textrm {ce}=eB_0/m_ec$ is determined by the background magnetic field
 $B_0(s)$, given by, e.g. the reduced dipole model (Bell Reference Bell1984). The sign
 $\pm$ in front of
 $\psi$ is determined by the wave polarization:
 $+$ for whistler-mode waves interacting with electrons and
 $-$ for EMIC waves interacting with electrons. The resonance number is
 $n=0,\pm 1, \pm 2\ldots$. The wavevector
 $\textbf {k}=(k_{\parallel }(\omega ,s), k_{\perp }(\omega ,s))$ is given by a cold plasma dispersion equation (Stix Reference Stix1962) for a constant wave frequency
 $\omega$ (i.e.
 $\partial \phi /\partial s=k_\parallel , \partial \phi /\partial t=\omega$). For a finite angle
 $\theta =\textrm {arctan}( k_\perp / k_\parallel )$ between the wavevector and the background magnetic field, the wave amplitude in Hamiltonian (2.1) takes the form (Albert Reference Albert1993; Tao & Bortnik Reference Tao and Bortnik2010; Nunn & Omura Reference Nunn and Omura2015; Artemyev et al. Reference Artemyev, Neishtadt, Vasiliev and Mourenas2018b)
 \begin{align} U_w &= \sqrt {\frac{{2I_x \varOmega_\textrm{ce} }}{{m_e c^2 }}} \frac{{eB_w }}{k}\sum_ \pm {\frac{{\cos \theta \pm C_1 }}{{2\gamma }}J_{n \pm 1} \left( {\sqrt {\frac{{2I_x k^2 }}{{m_e \varOmega_\textrm{ce} }}} \sin \theta } \right)} \nonumber\\ & \quad + \frac{{eB_w }}{k}\left( {\frac{{p_\parallel }}{{\gamma m_e c}} + C_2 } \right)J_n \left( {\sqrt {\frac{{2I_x k^2 }}{{m_e \varOmega_\textrm{ce} }}} \sin \theta } \right)\sin \theta , \end{align}
where  $B_w$ is the wave magnetic field amplitude,
 $C_{1,2}$ are functions of wave dispersion and
 $\theta$, and
 $J_n$ are Bessel functions. Equation (2.2) shows that for field-aligned waves
 $\theta =0$ there is only one cyclotron resonance
 $n=-1$:
 $U_{w}=\sqrt {2I_x\varOmega _\textrm {ce}/m_ec^2}eB_w/k\gamma$ (with
 $C_1=1$ for
 $\theta =0$, see Tao & Bortnik (Reference Tao and Bortnik2010)). For oblique wave propagation
 $\theta \ne 0$ the whole set of resonances with different values of
 $n$ is present.
2.1. Field-aligned whistler waves
Let us start with the system of two field-aligned whistler waves with the Hamiltonian
 \begin{equation} H = m_e c^2 \gamma + \sqrt {\frac{{2I_x \varOmega_\textrm{ce} }}{{m_e c^2 }}} \frac{e}{\gamma }\sum_{i = 0,1} {\frac{{B_{w,i} }}{{k_i }}\sin ( {\phi_i + \psi } )},\end{equation}
where  $\partial \phi _i/\partial s=k_i=k_i(\omega _i,s)$ with the two different wave frequencies
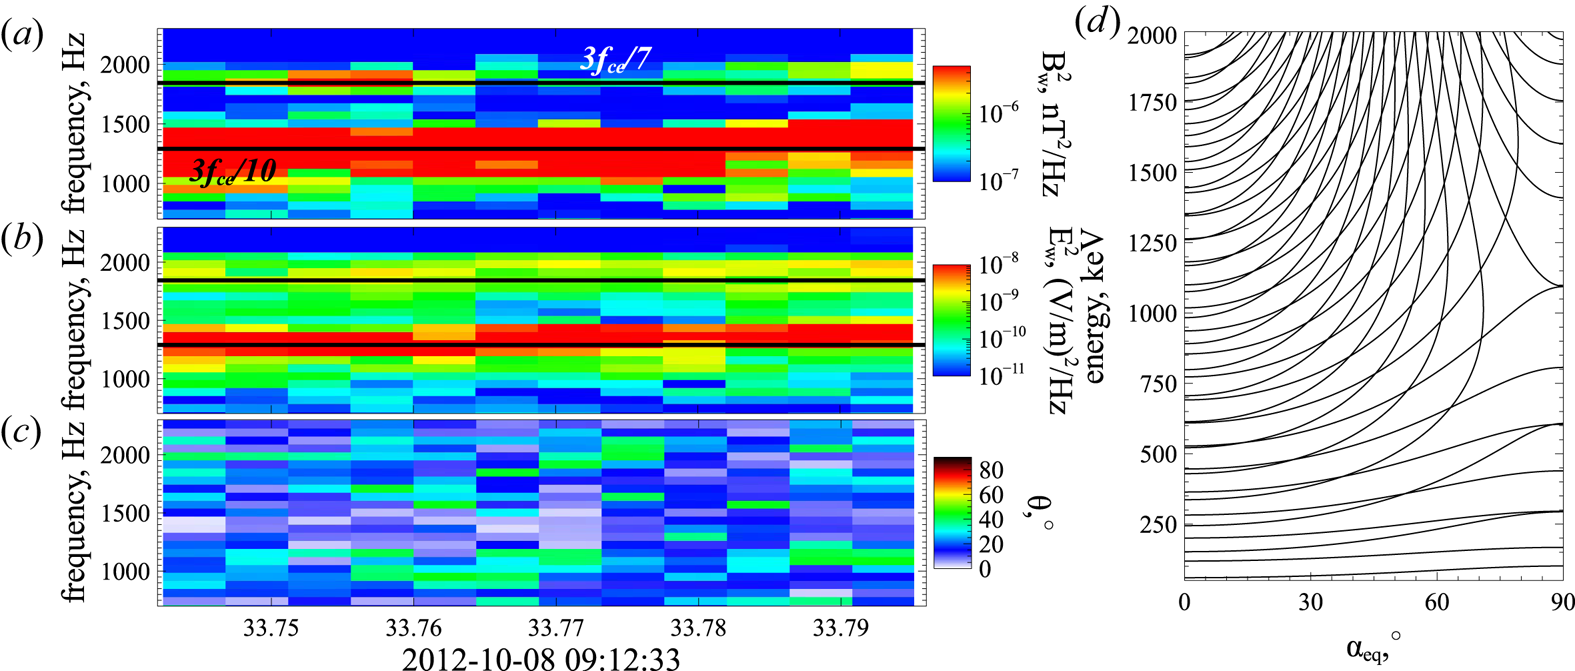
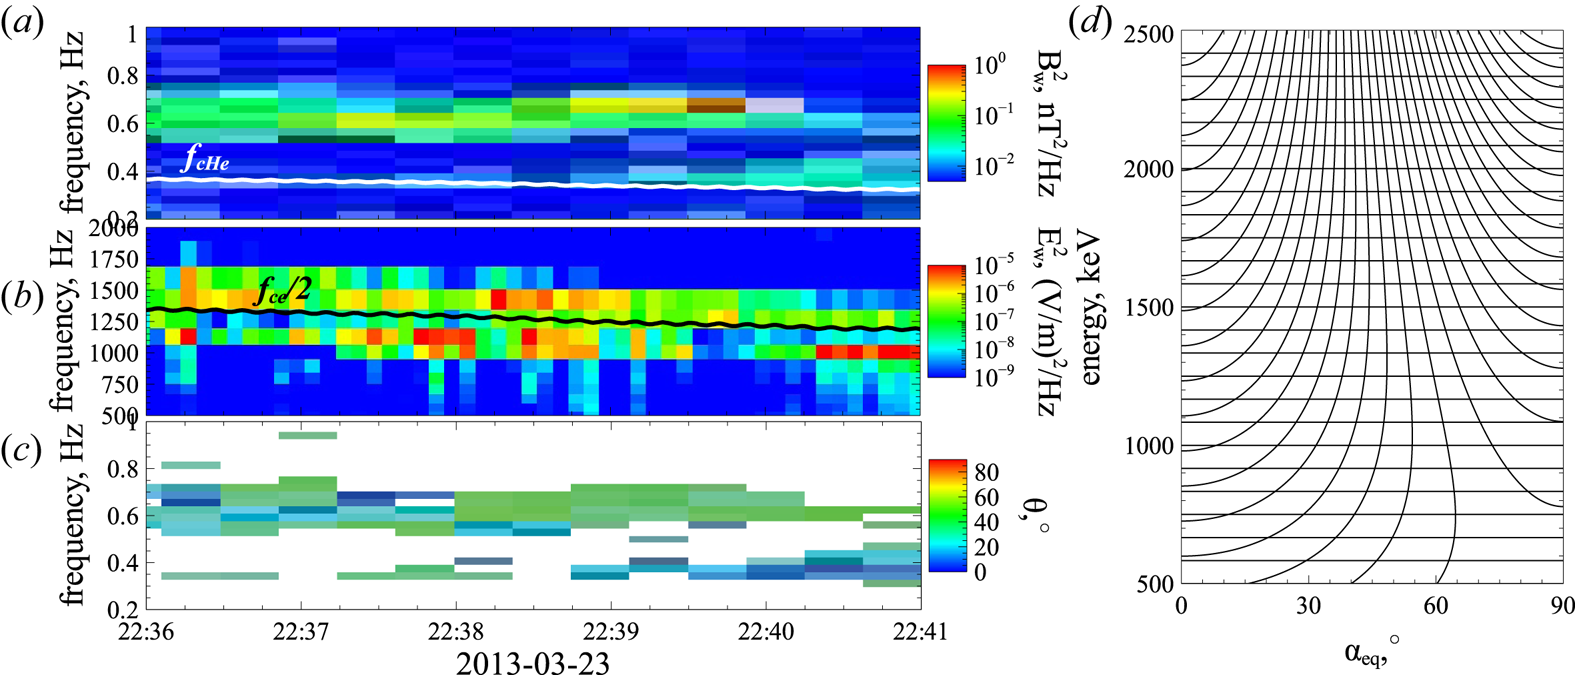
 $\omega _i$. Figure 1 shows an example of such system observations. The THEMIS spacecraft measure waves within the whistler-mode frequency range (
 $f\in [0.1, 1] f_\textrm {ce}$;
 $f_\textrm {ce}=\varOmega _\textrm {ce}/2{\rm \pi}$): there are two clear maxima in the magnetic and electric field spectra at
 $f\sim f_\textrm {ce}/4$ and
 $f\sim 3f_\textrm {ce}/8$ (see panels (a) and (b)). Both waves propagate along the background magnetic field: panel (c) shows
 $\theta$ as a function of the frequency. These double-peak spectra are quite typical for whistler-mode waves in the inner magnetosphere (see, e.g. Meredith et al. Reference Meredith, Horne, Glauert and Anderson2007; Crabtree et al. Reference Crabtree, Tejero, Ganguli, Hospodarsky and Kletzing2017; Ma et al. Reference Ma, Mourenas, Li, Artemyev and Thorne2017; He et al. Reference He, Yan, Zhang, Yu, Ma, Cao and Cui2020; Yu et al. Reference Yu, Wang, Li, Cui, Cao and He2020; Zhang et al. Reference Zhang, Mourenas, Artemyev, Angelopoulos, Kurth, Kletzing and Hospodarsky2020b).
Observational example of two whistler-mode waves by Van Allen Probe A (Mauk et al. Reference Mauk, Fox, Kanekal, Kessel, Sibeck and Ukhorskiy2013): magnetic field spectrum (a) and electric field spectrum (b) are obtained from EMFISIS measurements (Kletzing et al. Reference Kletzing, Kurth, Acuna, MacDowall, Torbert, Averkamp, Bodet, Bounds, Chutter and Connerney2013), wave-normal angle (c) is estimated using Mean's method (Means Reference Means1972). Resonance curves for the system with two observed whistler-mode waves (d).

To study electron energy/pitch-angle variation in the system with Hamiltonian (2.3), we follow the standard procedure (Neishtadt & Vasiliev Reference Neishtadt and Vasiliev2006; Neishtadt Reference Neishtadt2014) and introduce the wave phases as new canonical variables,  $\varphi _i=\phi _i+\psi$, with the generating function
 \begin{equation} W = sP + \left( {\int {k_0 (\tilde s)\,\textrm{d} \tilde s} - \omega_0 t + \psi } \right)I_0 + \left( {\int {k_1 (\tilde s)\,\textrm{d} \tilde s} - \omega_1 t + \psi } \right)I_1.\end{equation}
This function gives new variables:  $P=p-k_0I_0-k_1I_1, S=s$ (we keep
 $s$ notation),
 $I_x=I_0+I_1$ and new Hamiltonian
 $H_I=H+\partial W/\partial t=H-\omega _0I_0-\omega _1I_1$
 \begin{equation} \left.\begin{array}{c} \displaystyle H_I ={-} \omega_0 I_0 - \omega_1 I_1 + m_e c^2 \gamma + \sqrt {\dfrac{{2( {I_0 + I_1 } )\varOmega_\textrm{ce} }}{{m_e c^2 }}} \dfrac{e}{\gamma }\sum_{i = 0,1} {\dfrac{{B_{w,i} }}{{k_i }}\sin \varphi _i } ,\\ \displaystyle \gamma = \sqrt {1 + \dfrac{{( {P + k_0 I_0 + k_1 I_1 } )^2 }}{{m_e^2 c^2 }} + \dfrac{{2( {I_0 + I_1 } )\varOmega_\textrm{ce} }}{{m_e c^2 }}} .\end{array}\right\} \end{equation}
Hamiltonian  $H_I$ describes a conservative system (
 $H_I=\textrm {const.}$; without loss of generality we take
 $H_I={0}$) with three degrees of freedom, i.e. with three pairs of conjugate variables
 $(s, P), (\varphi _0,I_0), (\varphi _1, I_1)$. The resonance
 $\dot \varphi _i=0$ conditions give
 $I_{0}=I_{0R}(s,P,I_1), I_{1}=I_{1R}(s,P,I_0)$ as solutions of equations
 $\omega _i=m_ec^2\partial \gamma /\partial I_i = 0$. Thus, there are two resonant surfaces. If these surfaces cross (i.e. at the same
 $s,P$ electron can have simultaneously
 $I_{0}=I_{0R}$ and
 $I_1=I_{1R}$), then electrons can simultaneously be in resonance with the two waves (Zaslavsky et al. Reference Zaslavsky, Krafft, Gorbunov and Volokitin2008; Shklyar & Zimbardo Reference Shklyar and Zimbardo2014). This quite complicated system would require a separate consideration (Lichtenberg & Lieberman Reference Lichtenberg and Lieberman1983; Sagdeev, Usikov & Zaslavsky Reference Sagdeev, Usikov and Zaslavsky1988). Hereafter, we focus instead on the simpler case of well-separated resonances, when resonant surfaces do not cross. Equations
 $I_{0}=I_{0R}$ and
 $I_1=I_{1R}$ together with the condition
 $H_I={0}$ determine two families of curves in
 $(s,P)$ plane; values
 $I_{0}$ and
 $I_{1}$ are parameters of these families. Thus, on the curve
 $I_0=I_{0R}(s,P,I_1)$ there is no change of
 $I_1$, and on the curve
 $I_1=I_{1R}(s,P,I_0)$ there is no change of
 $I_0$. With constant
 $I_1$ (or
 $I_0$) the
 $I_0$ (or
 $I_1$) variation is directly related to the variation of energy:
 $-\omega _0I_0-\omega _1I_1+m_ec^2\gamma = 0$. Taking into account that
 $I_0+I_1=I_x=m_ec^2(\gamma ^2-1)\sin ^2\alpha _\textrm {eq}/2$, we can plot resonance curves (e.g. Lyons & Williams Reference Lyons and Williams1984; Summers et al. Reference Summers, Thorne and Xiao1998; Mourenas et al. Reference Mourenas, Artemyev, Agapitov and Krasnoselskikh2012), along which
 $I_{i}$ change, in the energy/pitch-angle space (
 $m_ec^2(\gamma -1),\alpha _\textrm {eq}$) (note that we use the equatorial pitch-angle
 $\alpha _\textrm {eq}$ defined at the minimum of
 $B_0(s)$ field, i.e. at the minimum of
 $\varOmega _\textrm {ce}(s)$). Figure 1(d) shows these curves
 $m_ec^2\gamma -\omega _{i}I_{i}=\textrm {const.}$: each curve of
 $I_0$ change corresponds to a fixed value of
 $I_1$, and vice versa. Electrons move along these curves with the time step of the interval between resonances. Note between resonances both
 $I_{i}$ and
 $\gamma$ are conserved, and electrons are moving along adiabatic orbits without wave influence, i.e. energy and pitch-angle change only at the resonances.
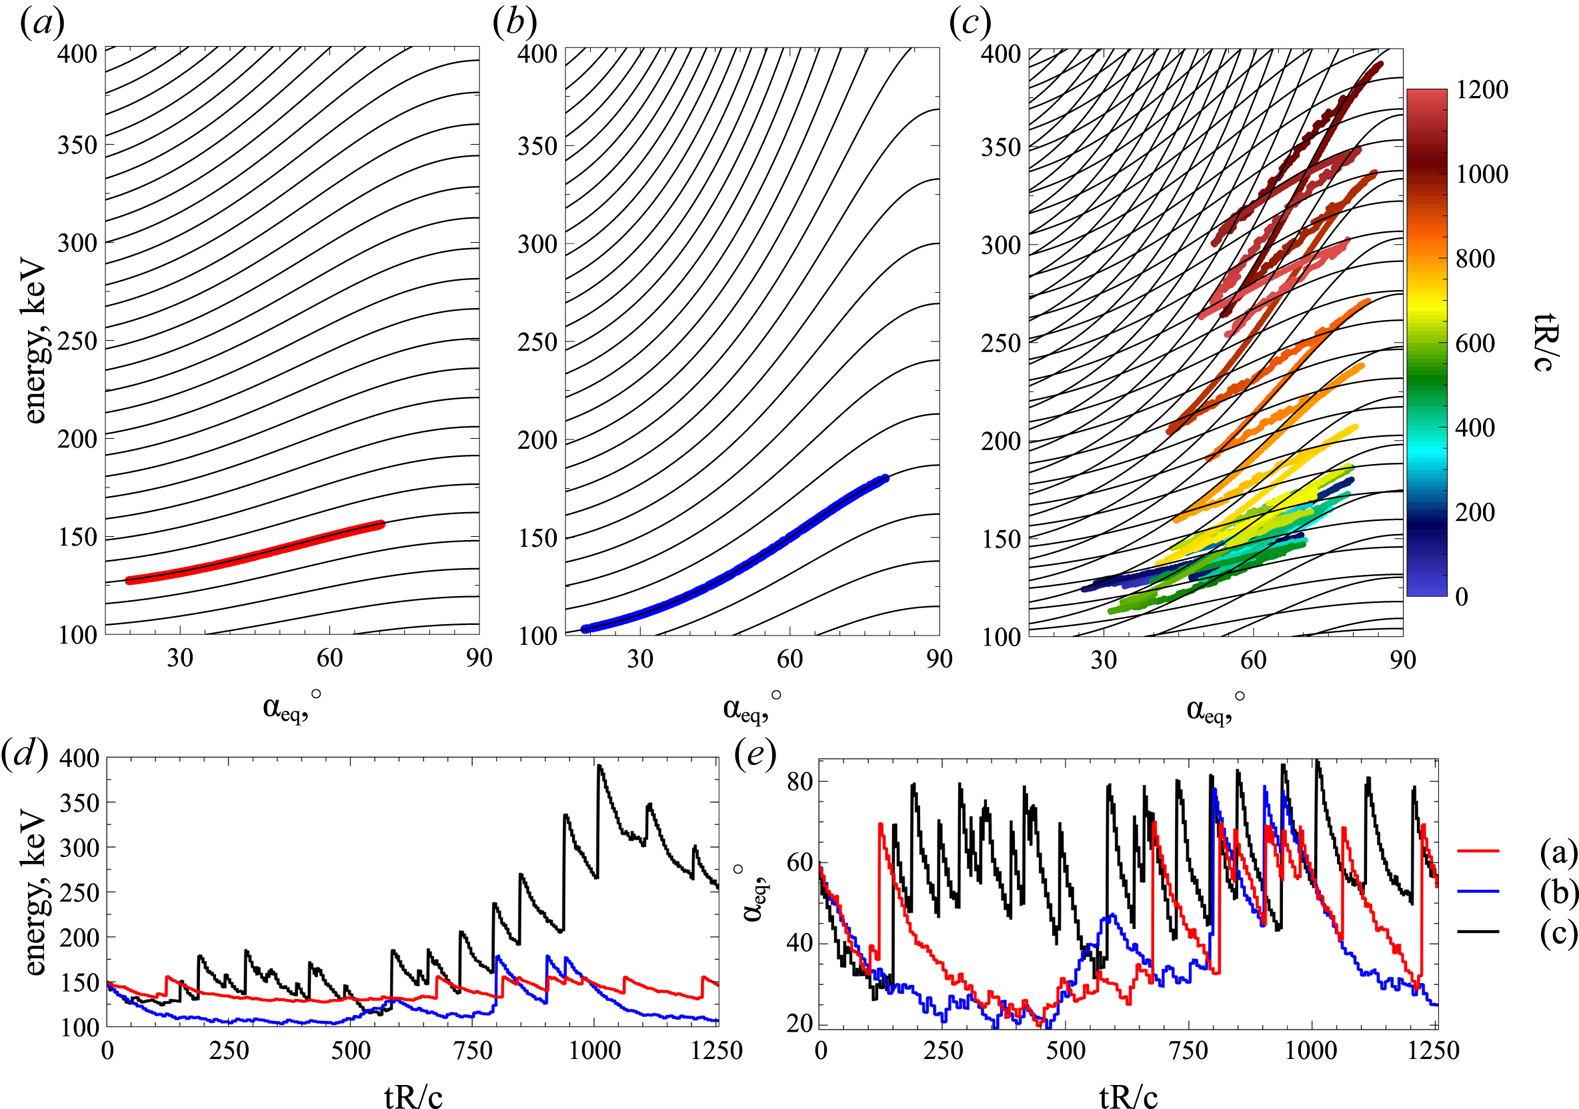
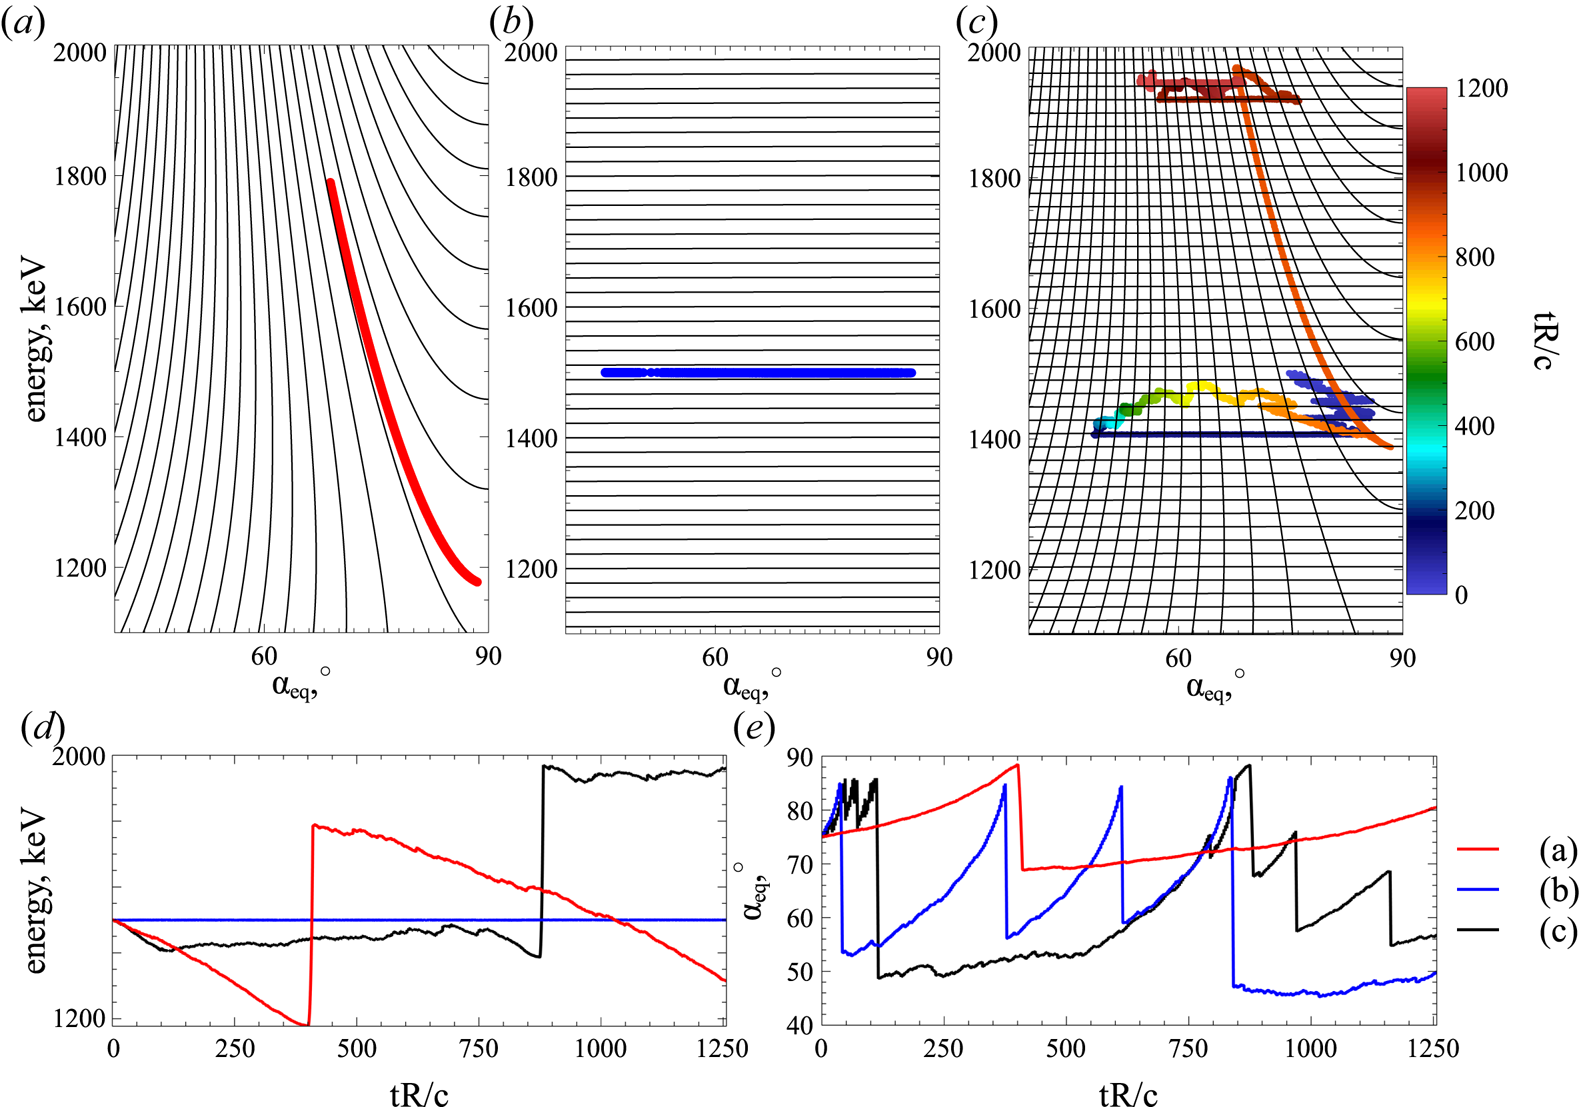
Let us consider electron dynamics in the energy/pitch-angle space for the system with Hamiltonian (2.3). We numerically integrate Hamiltonian equations for systems with a single wave and with two waves. Figure 2(a,b) show electron motion in the energy/pitch-angle space due to the resonance with a single wave. Solid curves are resonant curves of  $-\omega _0I_0-\omega _1I_1+m_ec^2\gamma =\textrm {const.}$ for the wave frequency
 $\omega _0$ and for the wave frequency
 $\omega _1$. Electrons move along this curve due to phase bunching (small negative jumps of energy and pitch-angle; see panels (d,e)) and phase trapping (rare large positive jumps of energy and pitch-angle; see panels (d,e)). Conservation of
 $-\omega _0I_0-\omega _1I_1+m_ec^2\gamma$ and one of the momenta (
 $I_0$ or
 $I_1$) makes electron dynamics 1-D in the energy/pitch-angle space. However, this dynamics becomes 2-D in the system with two waves, when both
 $I_0$ and
 $I_1$ change, see figure 2(c). The electron moves along resonance curves and jumps between these curves due to
 $I_i$ jumps. There are still the same energy and pitch-angle jumps due to phase bunching and phase trapping (see panels (d,e)), but electron phase trajectory covers the entire energy/pitch-angle space. We describe this 2-D dynamics with the mapping technique in this study.
Panels (a–c) show resonance curves (black) and electron trajectories in the energy/pitch-angle space for Hamiltonian (2.3): only the first whistler-mode wave (a), only the second whistler-mode wave (b), both whistler-mode waves (c). In panel (c) different colours correspond to different time intervals. Panels (d,e) show energy and pitch-angle time series for the three trajectories in panels (a–c). We use parameters of dipole field at a radial distance of  $\sim 5$ Earth radii. Plasma density is given by the model from Sheeley et al. (Reference Sheeley, Moldwin, Rassoul and Anderson2001) and constant along magnetic field lines. Wave frequencies are
 $\omega _0=0.4\varOmega _\textrm {ce}, \omega _1=0.2\varOmega _\textrm {ce}$. Both wave amplitudes are
 $300$ pT (see discussion of such wave observations in Zhang et al. (Reference Zhang, Thorne, Artemyev, Mourenas, Angelopoulos, Bortnik, Kletzing, Kurth and Hospodarsky2018) and Tyler19). Wave amplitude is distributed along magnetic field lines as
 $\tanh ((\lambda /\delta \lambda _1)^2)\exp (-(\lambda /\delta \lambda _2)^2)$ with
 $\lambda$ the magnetic latitude (
 $ds=Rd\lambda \sqrt {1+\sin ^2\lambda }\cos \lambda$) and
 $\delta \lambda _1=2^\circ , \delta \lambda _2=20^\circ$. This function fits the observed whistler-mode wave intensity distribution (Agapitov et al. Reference Agapitov, Artemyev, Krasnoselskikh, Khotyaintsev, Mourenas, Breuillard, Balikhin and Rolland2013).

2.2. Oblique whistler-mode wave
The second example corresponds to electron resonant interaction with a single oblique ( $\theta \ne 0$) wave, for which Hamiltonian (2.1) takes the form
 \begin{equation} \left.\begin{array}{c} \displaystyle H = m_e c^2 \gamma + \dfrac{{eB_w }}{{k\gamma }}h_0 \sin ( \phi ) + \sqrt {\dfrac{{2I_x \varOmega_\textrm{ce} }}{{m_e c^2 }}} h_1 \dfrac{{eB_w }}{{k\gamma }}\sin ( {\phi + \psi } ), \\ \displaystyle h_0 ={-} \sqrt {\dfrac{{2I_x \varOmega_\textrm{ce} }}{{m_e c^2 }}} C_1 J_1 + \left( {\dfrac{{p_\parallel }}{{m_e c}} + C_2 } \right)J_0 \sin \theta, \\ \displaystyle h_1 = \dfrac{1}{2}( J_2{( {\cos \theta + C_1 } ) + J_0 ( {\cos \theta - C_1 } )} ) + \left( {\dfrac{{p_\parallel }}{{m_e c}} + C_2 } \right)\dfrac{{kc}}{{2\varOmega_\textrm{ce} }}( {J_2 + J_0 } ) \sin \theta, \end{array}\right\}, \end{equation}
where we restrict our consideration to the first two resonances: Landau resonance  $n=0$ and the first cyclotron resonance
 $n=1$. The Bessel function argument is
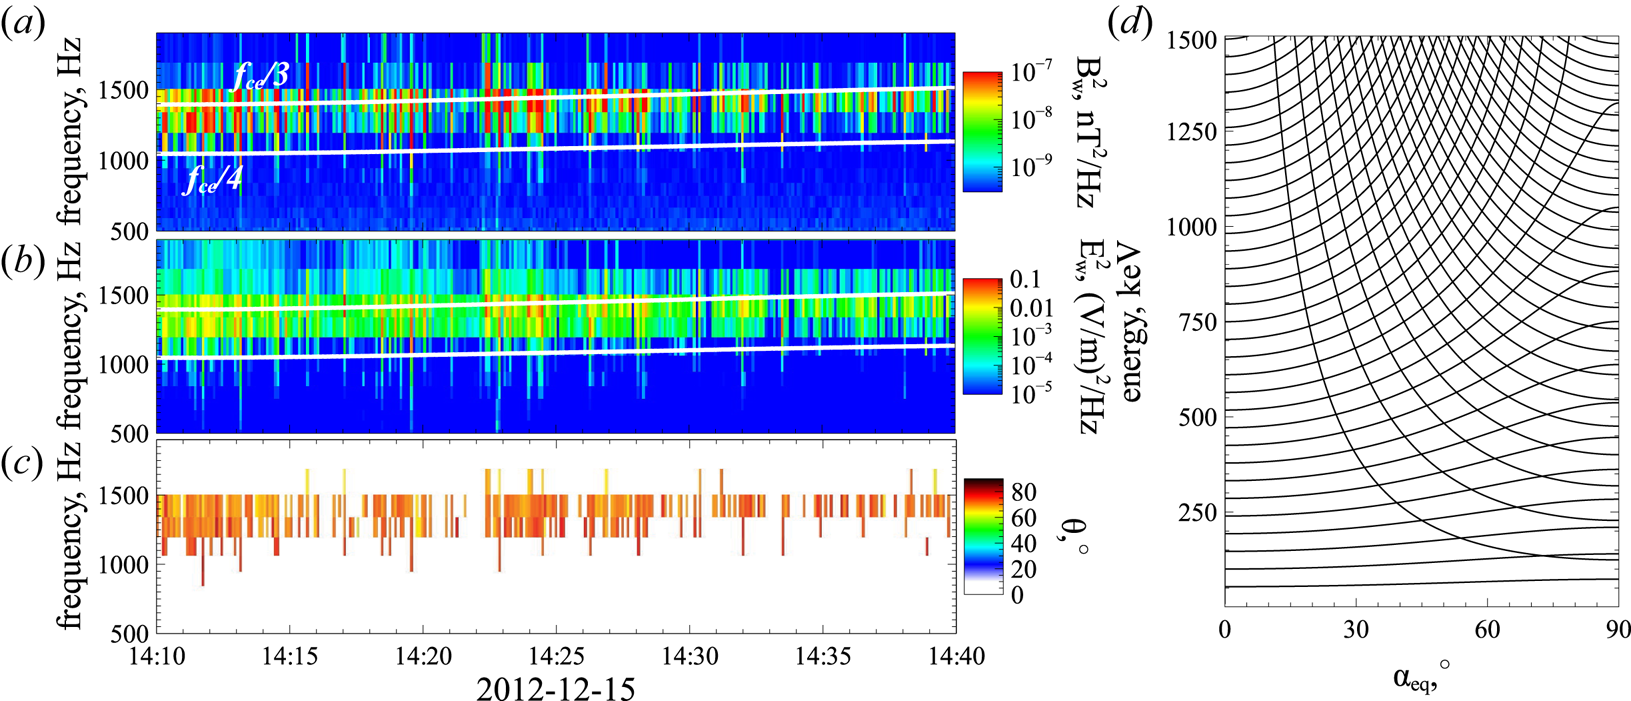
 $\sqrt {2I_xk^2/m_e\varOmega _\textrm {ce}}\sin \theta$. Such oblique whistler-mode waves are widely observed in the radiation belts (Agapitov et al. Reference Agapitov, Artemyev, Krasnoselskikh, Khotyaintsev, Mourenas, Breuillard, Balikhin and Rolland2013, Reference Agapitov, Artemyev, Mourenas, Mozer and Krasnoselskikh2015a; Li et al. Reference Li, Santolik, Bortnik, Thorne, Kletzing, Kurth and Hospodarsky2016), and their amplitudes are often sufficiently high for nonlinear resonances (Agapitov et al. Reference Agapitov, Artemyev, Mourenas, Mozer and Krasnoselskikh2015b; Artemyev et al. Reference Artemyev, Agapitov, Mourenas, Krasnoselskikh, Shastun and Mozer2016a; Mourenas et al. Reference Mourenas, Artemyev, Agapitov, Mozer and Krasnoselskikh2016a). Figure 3 shows an example of an oblique whistler-mode wave measured by THEMIS spacecraft in the outer radiation belt. Electric and magnetic field spectra show the one wave power maximum around
 $f/f_\textrm {ce}\sim 1/3$ (see panels (a,b)), i.e. this is a single wave. Wave-normal angle
 $\theta \approx 70^\circ$ (see panel (c)), i.e. this wave propagates obliquely to the background magnetic field.
Observational example of oblique whistler-mode wave by Van Allen Probe A (Mauk et al. Reference Mauk, Fox, Kanekal, Kessel, Sibeck and Ukhorskiy2013): magnetic field spectrum (a) and electric field spectrum (b) are obtained from EMFISIS measurements (Kletzing et al. Reference Kletzing, Kurth, Acuna, MacDowall, Torbert, Averkamp, Bodet, Bounds, Chutter and Connerney2013), wave-normal angle (c) is estimated using Mean's method (Means Reference Means1972). Resonance curves for the system with two observed whistler-mode waves (d).

Using the same approach as the one we applied for Hamiltonian (2.3), we introduce wave phases as new variables,  $\varphi _0=\phi _0$ and
 $\varphi _1=\phi _1+\psi$, using the generating function (Neishtadt & Vasiliev Reference Neishtadt and Vasiliev2006; Neishtadt Reference Neishtadt2014)
 \begin{equation} W = sP + \left( {\int {k(\tilde s)\,\textrm{d} \tilde s} - \omega t} \right)I_0 + \left( {\int {k(\tilde s)\,\textrm{d} \tilde s} - \omega t + \psi } \right)I_1.\end{equation}
This function gives the new variables:  $P=p-k_0I_0-k_1I_1, S=s$ (we keep
 $s$ notation),
 $I_x=I_1$ and new Hamiltonian
 $H_I=H+\partial W/\partial t=H-\omega I_0-\omega I_1$
 \begin{equation} \left.\begin{array}{c} \displaystyle H_I ={-} \omega I_0 - \omega I_1 + m_e c^2 \gamma + \dfrac{{eB_w h_0 }}{{k\gamma }}\sin \varphi_0 + \sqrt {\dfrac{{2I_1 \varOmega_\textrm{ce} }}{{m_e c^2 }}} \dfrac{{eB_w h_1 }}{{k\gamma }}\sin \varphi_1 ,\\ \displaystyle \gamma = \sqrt {1 + \dfrac{{( {P + k_0 I_0 + k_1 I_1 } )^2 }}{{m_e^2 c^2 }} + \dfrac{{2I_1 \varOmega_\textrm{ce} }}{{m_e c^2 }}}. \end{array}\right\} \end{equation}
The resonance curves in the energy/pitch-angle space are given by two equations:  $m_ec^2\gamma -\omega I_1=\textrm {const.}$ with
 $I_1=I_x=(\gamma ^2-1)\sin ^2\alpha _\textrm {eq}/2$ for the cyclotron resonance and
 $I_x=\textrm {const.}$ for the Landau resonance. Figure 3(d) shows that at
 $\alpha _\textrm {eq}<{\rm \pi} /4$ Landau resonance curves cross cyclotron resonance curves almost transversely, i.e. in the Landau resonance electrons quickly change energy with weaker pitch-angle change, whereas in the cyclotron resonance the energy change is more effective than the pitch-angle change.
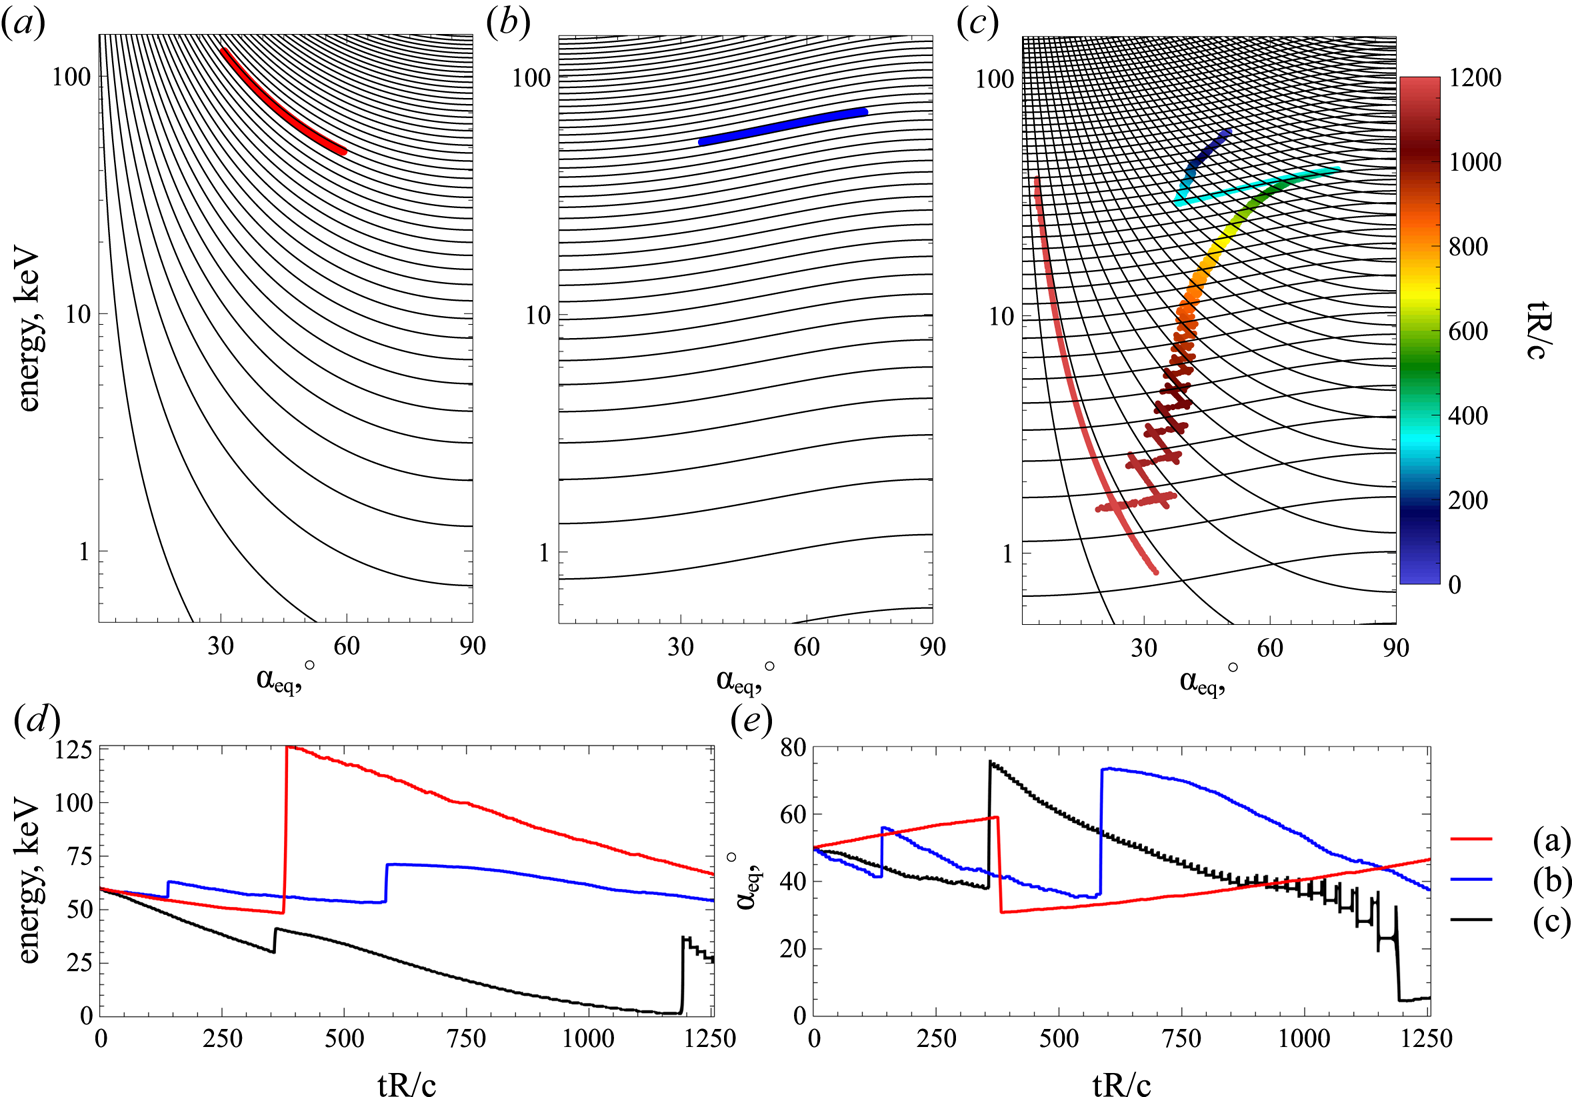
To demonstrate the effects of the two resonances on electron transport in energy/pitch-angle space, we numerically integrate Hamiltonian equations (2.8) for three systems. Figure 4(a) shows results of the Landau resonance of the electron and oblique whistler-mode wave. The electron moves along a single resonant curve  $I_x={rm const.}$ with phase bunching responsible for pitch-angle increase and energy decrease, and the phase trapping responsible for pitch-angle decrease and energy increase (panels (d,e)). Figure 4(b) shows results of the cyclotron resonance: electron motion in the energy/pitch-angle space are quite similar to motions shown in figure 2(a,b): phase bunching is responsible for pitch-angle and energy decrease, whereas the phase trapping is responsible for pitch-angle and energy increase (panels (d,e)). The combination of the two resonances results in rapid electron motion within the whole energy/pitch-angle domain, see figure 4(c). The phase bunching decreases electron energy in both resonances, but moves electrons in opposite directions in pitch-angle. As a result, a resonant electron loses energy until it reaches the region with a high probability of trapping into the Landau resonance (Artemyev et al. Reference Artemyev, Vasiliev, Mourenas, Agapitov and Krasnoselskikh2013). After being trapped in Landau resonance, the electron gains energy and reaches the energy/pitch-angle domain where it can now be trapped into the cyclotron resonance with further energy increase. Such cycles of bunching, Landau trapping and cyclotron trapping, quickly cover a large energy/pitch-angle domain for a single electron trajectory.
Panels (a–c) show resonance curves (black) and electron trajectories in the energy/pitch-angle space for Hamiltonian (2.6): only Landau resonance (a), only cyclotron resonance (b), both resonances (c). In panel (c) colour shows time. Panels (d,e) show energy and pitch-angle time series for three trajectories from panels (a–c). System parameters are the same as in figure 2, wave frequency is  $\omega =0.35\varOmega _\textrm {ce}$, wave amplitude is
 $500$ pT and wave-normal angle
 $\theta$ is
 $5\,^\circ$ away of the resonance cone angle
 $\textrm {acos}(\omega /\varOmega _\textrm {ce})$ (see discussion of such wave observations in Wilson et al. (Reference Wilson, Cattell, Kellogg, Wygant, Goetz, Breneman and Kersten2011), Agapitov et al. (Reference Agapitov, Artemyev, Mourenas, Krasnoselskikh, Bonnell, Le Contel, Cully and Angelopoulos2014), Artemyev et al. (Reference Artemyev, Agapitov, Mourenas, Krasnoselskikh, Shastun and Mozer2016a) and Mourenas et al. (Reference Mourenas, Artemyev, Agapitov, Mozer and Krasnoselskikh2016a)). The wave amplitude distribution along magnetic field-lines is the same as one used in figure 1.

2.3. Field-aligned whistler-mode and EMIC waves
A third example is a system with field-aligned whistler-mode wave and field-aligned EMIC wave with polarization opposite to the whistler-mode wave. The corresponding Hamiltonian of a relativistic electron (reduction of Hamiltonian (2.2)) takes the form
 \begin{equation} H = m_e c^2 \gamma + \sqrt {\frac{{2I_x \varOmega_\textrm{ce} }}{{m_e c^2 }}} \left( {\frac{{eB_{w,0} }}{{k_0 \gamma }}\sin ( {\phi_0 + \psi } ) + \frac{{eB_{w,1} }}{{k_1 \gamma }}\sin ( {\phi_1 - \psi } )} \right), \end{equation}
where  $k_0=k_0(\omega _0,s)$ follows the whistler-mode wave dispersion, whereas
 $k_1=k_1(\omega _1,s)$ follows the EMIC wave dispersion. Figure 5(a,b) shows a typical example of observation of such two waves: the high-frequency magnetic field spectrum shows the whistler-mode wave with
 $f/f_\textrm {ce}\sim f_\textrm {ce}/2$, whereas the low-frequency magnetic field spectrum shows the EMIC wave with
 $f/f_{cp}\sim f_{cp}/2$ (
 $f_{cp}$ is the proton gyrofrequency). The EMIC wave is field-aligned (see panel (c)). Due to the low EMIC wave frequency, the resonance condition
 $\dot \phi _1-\dot \psi =k_1p/\gamma -\omega _1-\varOmega _\textrm {ce}/\gamma =0$ can be reduced to
 $k_1p=\varOmega _\textrm {ce}$, with typical
 $k_1$ approximately the inverse ion inertial length (Silin et al. Reference Silin, Mann, Sydora, Summers and Mace2011). Thus, only high-energy electrons (with large enough
 $p$) can resonate with EMIC waves (e.g. in the Earth radiation belts the resonant energy is typically larger than
 $\sim 1$ MeV, see Thorne & Kennel (Reference Thorne and Kennel1971), Summers & Thorne (Reference Summers and Thorne2003) and Shprits et al. (Reference Shprits, Drozdov, Spasojevic, Kellerman, Usanova, Engebretson, Agapitov, Zhelavskaya, Raita and Spence2016); Chen, Zhu & Zhang (Reference Chen, Zhu and Zhang2019)). Let us compare whistler-mode and EMIC wave resonance curves for such high energies.
Observational example of a system with whistler-mode and EMIC waves by Van Allen Probe A (Mauk et al. Reference Mauk, Fox, Kanekal, Kessel, Sibeck and Ukhorskiy2013): magnetic field spectrum of EMIC wave (a) and whistler-mode wave (b) are obtained from EMFISIS measurements (Kletzing et al. Reference Kletzing, Kurth, Acuna, MacDowall, Torbert, Averkamp, Bodet, Bounds, Chutter and Connerney2013), the wave-normal angle of the EMIC wave (c) is estimated using Mean's method (Means Reference Means1972). Resonance curves for the system with the two observed whistler-mode waves (d).

First, we introduce wave phases as new variables,  $\varphi _0=\phi _0+\psi$ and
 $\varphi _1=\phi _1-\psi$, with the generating function (Neishtadt & Vasiliev Reference Neishtadt and Vasiliev2006; Neishtadt Reference Neishtadt2014)
 \begin{equation} W = sP + \left( {\int {k_0 (\tilde s)\,\textrm{d} \tilde s} - \omega_0 t + \psi } \right)I_0 + \left( {\int {k_1 (\tilde s)\,\textrm{d} \tilde s} - \omega_1 t - \psi } \right)I_1.\end{equation}
This function gives new variables:  $P=p-k_0I_0-k_1I_1, S=s$ (we keep
 $s$ notation),
 $I_x=I_0-I_1$ and new Hamiltonian
 $H_I=H+\partial W/\partial t=H-\omega I_0-\omega I_1$
 \begin{equation} \left.\begin{array}{c} \displaystyle H_I ={-} \omega_1 I_0 - \omega_1 I_1 + m_e c^2 \gamma + \sqrt {\dfrac{{2( {I_0 - I_1 } )\varOmega_\textrm{ce} }}{{m_e c^2 }}} \sum_{i = 0,1} {\dfrac{{eB_{w,i} }}{{k_i \gamma }}\sin \varphi_i },\\ \displaystyle \gamma = \sqrt {1 + \dfrac{{( {P + k_0 I_0 + k_1 I_1 } )^2 }}{{m_e^2 c^2 }} + \dfrac{{2( {I_0 - I_1 } )\varOmega_\textrm{ce} }}{{m_e c^2 }}}. \end{array}\right\} \end{equation}
The EMIC resonance curves are given by equation  $m_ec^2\gamma -\omega _1I_1=\textrm {const.}$, and taking into account the smallness of
 $\omega _1$ we obtain
 $\gamma \approx 0$, i.e. resonance curves are almost straight lines parallel to the energy axis (see figure 5d). The whistler-mode resonance curves (
 $m_ec^2\gamma -\omega _0I_0=\textrm {const.}$ with
 $I_0=I_x+\textrm {const.}$) cross these lines: the EMIC wave is responsible for electron transport along pitch-angle space, and the whistler-mode wave leads to both pitch-angle and energy changes. Figure 6(a,b) confirms this scenario: the EMIC wave resonates with small pitch-angle (large
 $p$) electron and phase bunch it to larger pitch-angles (phase trapping by EMIC waves is responsible for pitch-angle decrease; see panels (d,e)) with an approximate conservation of energy, whereas the whistler-mode wave can resonate with large pitch-angle electrons and transport them to smaller pitch-angles via phase bunching with energy decrease (moving them away from the EMIC wave resonance).
Panels (a–c) show resonance curves (black) and electron trajectories in the energy/pitch-angle space for Hamiltonian (2.9): only whistler-mode wave (a), only EMIC wave (b), both whistler-mode and EMIC waves (c). In panel (c) colour shows time. Panels (d,e) show energy and pitch-angle time series for three trajectories in panels (a–c). System parameters are the same as in figure 2. The EMIC wave is  $H^+$ band with the frequency
 $\omega =0.7\varOmega _{cp}$ and amplitude
 $1$ nT (see discussion of such wave observations in Kersten et al. (Reference Kersten, Horne, Glauert, Meredith, Fraser and Grew2014) and Zhang et al. (Reference Zhang, Li, Thorne, Angelopoulos, Bortnik, Kletzing, Kurth and Hospodarsky2016)). Whistler-mode wave frequency is
 $\omega =0.35\varOmega _\textrm {ce}$ and wave amplitude is
 $300$ pT. The wave amplitude distribution along magnetic field-lines is the same as one used in figure 1.

The combination of EMIC and whistler-mode wave resonances (see figure 6c) can result in a very effective transport of large pitch-angle electrons to small pitch-angles (rapid electron losses): bunching of  $\sim 2$ MeV electrons with initially large pitch-angles results in electron transfer to small pitch-angles, where even faster EMIC phase trapping may move this electron to the loss-cone (see discussions of similar effects of combined EMIC and whistler-mode waves in the diffusive approximation in Mourenas et al. (Reference Mourenas, Artemyev, Ma, Agapitov and Li2016b) and Zhang et al. (Reference Zhang, Mourenas, Artemyev, Angelopoulos and Thorne2017)). From small pitch-angles (note that the loss-cone is not included in our simulations) the EMIC wave can transport an electron via phase bunching to higher pitch-angles, where whistler-mode resonance can accelerate it via trapping. As a result of such different resonant interactions with EMIC and whistler-mode waves, the electron trajectory can quickly fill up a large domain in the energy/pitch-angle space.
3. Mapping technique for multiresonances
To describe the long-term evolution of electron dynamics in the energy/pitch-angle space, we propose to develop a map providing relations for each resonant interaction  $\varDelta \gamma =\varDelta \gamma (\gamma ,\alpha _\textrm {eq}), \varDelta \alpha _\textrm {eq}=\varDelta \alpha (\gamma ,\alpha _\textrm {eq})$. Changes
 $\varDelta \gamma , \varDelta \alpha _\textrm {eq}$ are due to phase bunching (nonlinear scattering) and phase trapping. Thus, the first step in the construction of such a map is to derive equations for
 $\varDelta \gamma , \varDelta \alpha _\textrm {eq}$ driven by both these processes. We start with Hamiltonian (2.5) and follow the standard procedure of Hamiltonian expansion around the resonant
 $I_0, I_1$ values (Neishtadt Reference Neishtadt2014; Artemyev et al. Reference Artemyev, Neishtadt, Vainchtein, Vasiliev, Vasko and Zelenyi2018a), which are defined by equations
 $\partial H_I/\partial I_i=0$,
 \begin{equation} \frac{{k_i I_{iR} }}{{m_e c}} ={-} \frac{{P + k_{i'} I_{i'} }}{{m_e c}} - \frac{{\varOmega_\textrm{ce} }}{{k_i }} + \frac{1}{{\sqrt {( {k_i c/\omega _i } )^2 - 1} }}\sqrt {1 - \left( {\frac{{\varOmega_\textrm{ce} }}{{k_i c}}} \right)^2 - 2\frac{{\varOmega_\textrm{ce} }}{{k_i c}}\frac{{P + ( {k_{i'} - k_i } )I_{i'} }}{{m_e c}}},\end{equation}
where  $i'=0$ for
 $i=1$ and
 $i'=1$ for
 $i=0$. Expansion of Hamiltonian (2.5) around
 $I_i=I_{iR}$ gives
 \begin{equation} \left.\begin{array}{c@{}} \displaystyle H_{Ii} \approx \varLambda_i + m_e c^2 \tfrac{1}{2}g_i ( {I_i - I_{iR} } )^2 + u_{iR} \sin \varphi_i ,\\ \displaystyle \varLambda_i = m_e c^2 \gamma_{iR} - ( {\omega_0 I_0 + \omega_1 I_1 } )_{I_i = I_{iR} } ,\\ \displaystyle \gamma_{iR} = \dfrac{{( {k_i c/\omega_i } )}}{{\sqrt {( {k_i c/\omega_i } )^2 - 1} }}\sqrt {1 - \left( {\dfrac{{\varOmega_\textrm{ce} }}{{k_i c}}} \right)^2 - 2\dfrac{{\varOmega_\textrm{ce} }}{{k_i c}}\dfrac{{P + ( {k_{i'} - k_i } )I_{i'} }}{{m_e c}}},\\ \displaystyle u_{iR} = \sqrt {\dfrac{{2\varOmega_\textrm{ce} ( {I_0 + I_1 } )_{I_i = I_{iR} } }}{{m_e c^2 }}} \dfrac{e}{{\gamma_{iR} }}\dfrac{{B_{w,i} }}{{k_i }} ,\\ \displaystyle g_i = \left. {\dfrac{{\partial ^2 \gamma }}{{\partial I_i^2 }}} \right|_{I_i = I_{iR} } = \dfrac{{k_i^2 }}{{m_e^2 c^2 }}, \end{array}\right\} \end{equation}
where  $\varphi _i$ are fast variables and
 $I_{i}-I_{iR})$ and
 $(s, P)$ are slow variables (note that
 $\varLambda _i$ does not depend on fast variables). Next, we introduce new variables
 $P_{\varphi i}=I_i-I_{iR}$ with the generating function
 $Q_i=(I_i-I_{iR})\varphi _i+s\tilde {P}_i$. New Hamiltonians are
 \begin{align} F_i &= \varLambda_i ( {\tilde s,\tilde P} ) + m_e c^2 \tfrac{1}{2}g_i P_{\varphi i}^2 + u_{iR} \sin \varphi_i \nonumber\\ &\approx \varLambda_i ( {s,P} ) + \{ {\varLambda_i ,I_{iR} } \}_{s,P} \varphi_i + m_e c^2t \tfrac{1}{2}g_i P_{\varphi i}^2 + u_{iR} \sin \varphi_i , \end{align}
where  $\tilde {s}=s-(\partial I_{iR}/\partial P)\varphi _i, \tilde {P}=p+(\partial I_{iR}/\partial s)\varphi _i, \{\ \}$ are Poisson brackets, and we expand
 $\varLambda (\tilde {s},\tilde {P})$ over small
 $\partial I_{iR}/\partial s, \partial I_{iR}/\partial P$ terms. Hamiltonian
 $F_i$ is the sum of
 $\varLambda _i(s,P)$ describing slow variable dynamics and pendulum Hamiltonian describing fast variable dynamics,
 \begin{equation} F_{\varphi i} = m_e c^2 \tfrac{1}{2}g_i P_{\varphi i}^2 + \{ {\varLambda_i ,I_{iR} } \}_{s,P} \varphi_i + u_{iR} \sin \varphi _i,\end{equation}
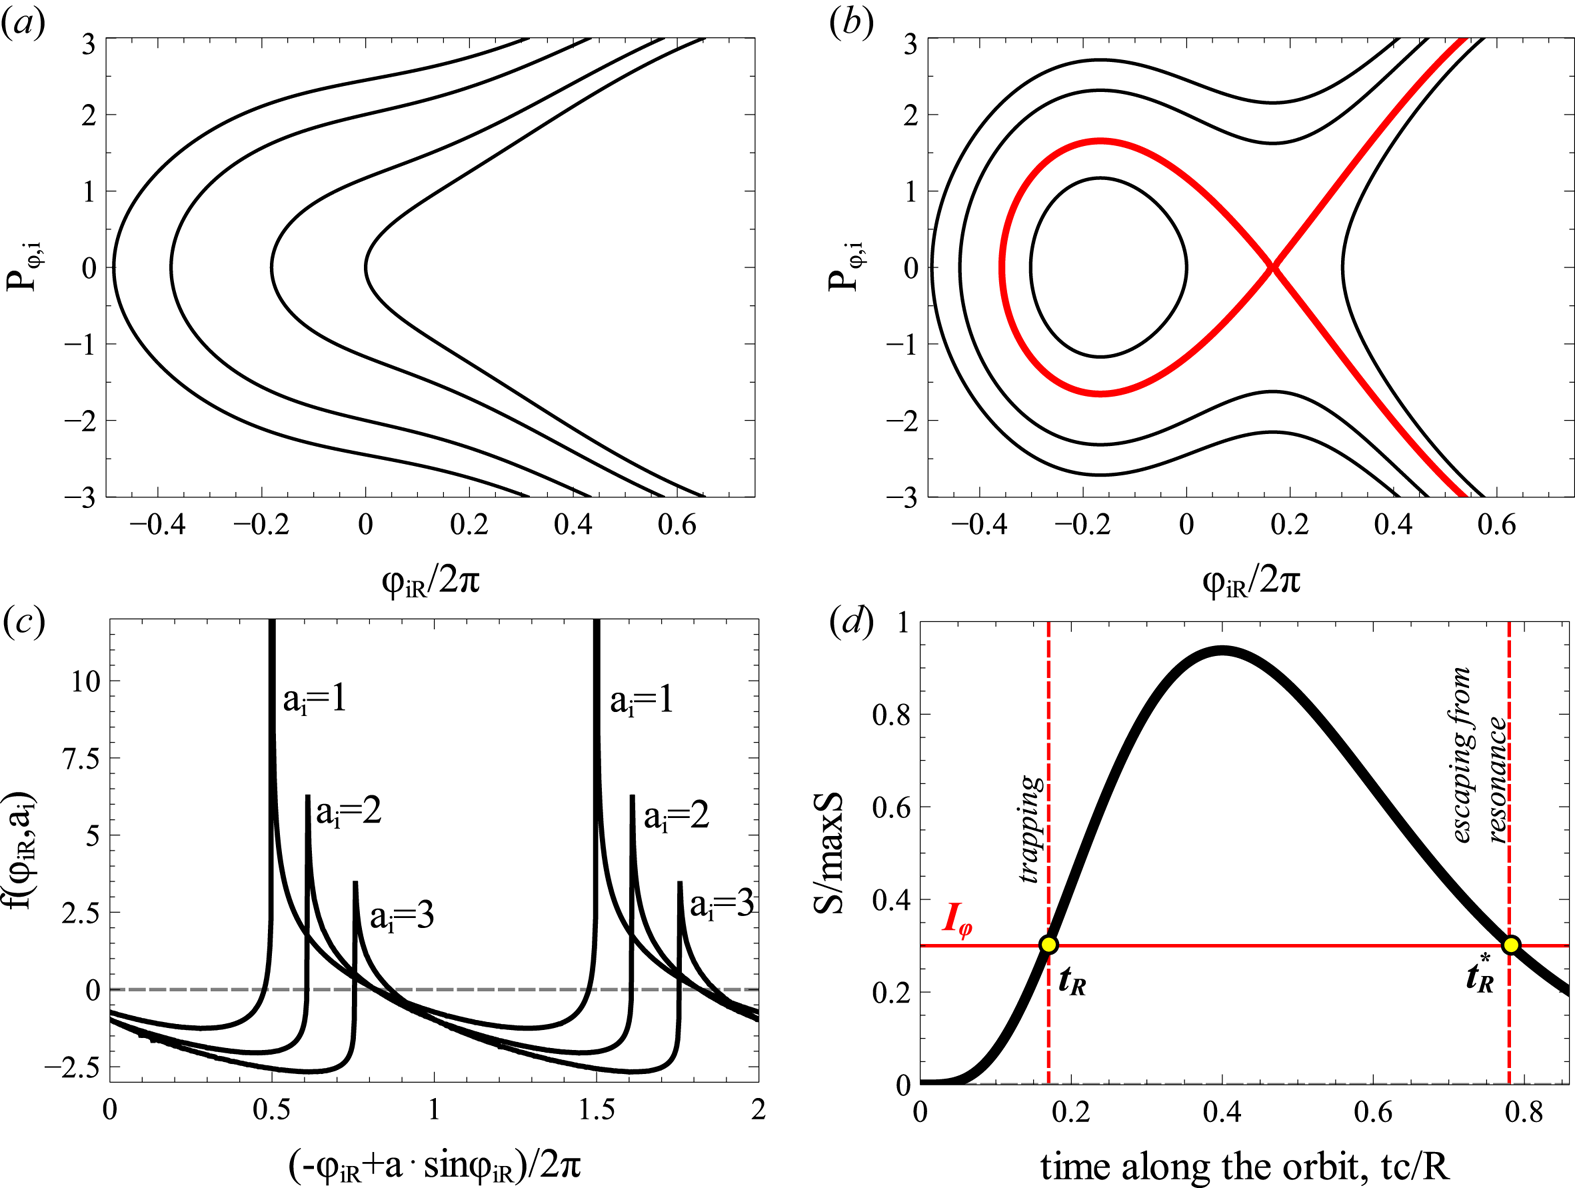
where the coefficients depend on the slow variables. Figure 7 shows phase portraits of  $F_{\varphi i}$ for systems with
 $a_i=|u_{iR}/\{\varLambda _{i}, I_{iR}\}|<1$ (panel (a)) and with
 $a_i=|u_{iR}/\{\varLambda _{i}, I_{iR}\}|>1$ (panel (b)). For low wave amplitude
 $a_i<1$ the phase portrait does not contain closed orbits, i.e. all particles cross the resonance
 $\dot \varphi _i=m_ec^2g_iP_{\varphi ,i}=0$ within an interval of approximately one period of
 $\varphi _i$. There are only weak scatterings in this regime with zero mean changes of
 $I_i$, and such scatterings can be described by the quasi-linear diffusion model for inhomogeneous plasma (e.g. Karpman Reference Karpman1974; Albert Reference Albert2010; Grach & Demekhov Reference Grach and Demekhov2020). For sufficiently high wave amplitude
 $a_i>1$, however, the phase portrait contains both closed and open orbits, i.e. there are now phase trapped particles oscillating around the resonance
 $\dot \varphi _i=m_ec^2g_iP_{\varphi ,i}=0$ for a long time. Scattering (crossing of the resonance along the open orbits) would result in phase bunching with a small, yet non-zero mean change of
 $I_i$ (see reviews by Shklyar & Matsumoto (Reference Shklyar and Matsumoto2009), Albert et al. (Reference Albert, Tao and Bortnik2013) and references therein), whereas phase trapping would significantly change
 $I_i$. We would like to include this nonlinear regime of wave–particle interaction into the map in energy/pitch-angle space. For this reason, we derive expressions for changes of
 $I_i$ due to phase bunching,
 $\varDelta _\textrm {scat} I_i$, and due to phase trapping
 $\varDelta _\textrm {trap} I_i$. As
 $\varDelta _\textrm {scat} I_i$ is local, i.e. depends on particle and system characteristics at the resonance, we can keep slow variables unchanged for
 $\varDelta _\textrm {scat} I_i$ evaluations
 \begin{align} \varDelta_\textrm{scat} I_i = 2\int_{ - \infty }^{t_{iR} } {\frac{{\partial H_{Ii} }}{{\partial I}}\, \textrm{d} t} = \frac{{2u_{iR} }}{{m_e c^2 g_i }}\int_{ - \infty }^{\varphi_{iR} } {\frac{{\cos \varphi_i \, \textrm{d} \varphi_i }}{{P_{\varphi i} }}} \nonumber\\ = \sqrt {\frac{{2u_{iR} }}{{m_e c^2 g_i }}} \int_{ - \infty }^{\varphi_{iR} } {\frac{{\sqrt {u_{iR} } \cos \varphi_i \, \textrm{d} \varphi_i }}{{\sqrt {F_{\varphi i} - \{ {\varLambda_i ,I_{iR} } \}_{s,P} \varphi_i - u_{iR} \sin \varphi_i } }}} \nonumber\\ = \sqrt {\frac{{2u_{iR} }}{{m_e c^2 g_i }}} \int_{ - \infty }^{\varphi_{iR} } {\frac{{\sqrt {u_{iR} } \cos \varphi_i \, \textrm{d} \varphi_i }}{{\sqrt {\{ {\varLambda_i ,I_{iR} } \}_{s,P} ( {\varphi_{Ri} - \varphi_i } ) + u_{iR} ( {\sin \varphi_{Ri} - \sin \varphi_i } )} }}} \nonumber\\ = \sqrt {\frac{{2u_{iR} }}{{m_e c^2 g_i }}} \int_{ - \infty }^{\varphi_{iR} } {\frac{{\sqrt{a_i} \cos \varphi_i \, \textrm{d} \varphi_i }}{{\sqrt {( {\varphi_{Ri} - \varphi_i } ) + a_i ( {\sin \varphi_{Ri} - \sin \varphi_i } )} }}} = \sqrt {\frac{{2u_{iR} }}{{m_e c^2 g_i }}} f_i ( {\varphi_{Ri} ,a_i } ), \end{align}
where  $t_{iR}$ is the time of passage through the resonance,
 $\varphi _{iR}$ is the wave phase at this time, and we use
 $\dot \varphi _{i}=m_ec^2g_iP_{\varphi i}=2^{1/2}\sqrt {F_{\varphi i}-\{\varLambda _{i}, I_{iR}\}\varphi _i-u_{Ri}\sin \varphi _i}, F_{\varphi i}$
 $=\{\varLambda _{i}, I_{iR}\}\varphi _{Ri}+u_{Ri}\sin \varphi _{Ri}$ (resonant energy
 $F_{\varphi i}$ value evaluated at
 $P_{\varphi i}=0$). Note (3.5) describes the
 $\varDelta _\textrm {scat}I_i$ change for the particle motion throughout the resonance from
 $-\infty$ to resonant
 $\varphi _{iR}$, whereas the motion in the opposite direction would result in the change of sign of
 $\varDelta _\textrm {scat}I_i$. Function
 $f_i(a_i,\varphi _{iR})$ is periodic for
 $\varphi _{iR}$, see figure 7(c). Although the sign of
 $f_i$ changes within one
 $\varphi _{iR}$ period, the mean value of this function for
 $a_i>1$ is not zero, providing the effect of phase bunching. To consider the precise
 $\varDelta _\textrm {scat} I_i$ dependence on
 $\varphi _{iR}$ in the mapping, one would need to keep information about resonant phase
 $\varphi _i$ and calculate the phase gain between resonances. However, the phase is fast rotating, and even a small change of
 $\varphi _i$ at the resonance would result in a significant change of phase gain between resonances. Therefore, we can assume that
 $\varphi _{iR}$ is a random variable with a uniform distribution of the resonant energy
 $F_{\varphi i}(\varphi _{iR})$ at
 $P_{\varphi i}=0$ axis (see justification of this assumption in Itin et al. (Reference Itin, Neishtadt and Vasiliev2000), Artemyev et al. (Reference Artemyev, Neishtadt and Vasiliev2020a) and Artemyev et al. (Reference Artemyev, Neishtadt and Vasiliev2020b)), and all resonant particles with the same slow variables (same energy and pitch-angle) at the resonance would experience the same
 $\varDelta I_i$ change equal to
 $\langle \varDelta I_i \rangle$ averaged over the resonant energy (Artemyev et al. Reference Artemyev, Neishtadt and Vasiliev2020b).
Phase portraits of  $F_{\varphi i}$ for systems with
 $|u_{iR}|<|\{\varLambda _{i}, I_{iR}\}|$ (a) and with
 $|u_{iR}|>|\{\varLambda _{i}, I_{iR}\}|$ (b). Black curves show contours of
 $F_{\varphi ,i}=\textrm {const.}$, red curve is the separatrix demarcating region of trapped (closed) electrons orbits and region of transient (open) orbits. Function
 $f(h_\phi ,a)$ for several
 $a$ and
 $(-\varphi _{iR}+a\sin \varphi _{iR})/2{\rm \pi}$ (c) and scheme of trapping/ detrapping (d).

An important property of the  $f$ function from (3.5) is that being averaged over energies in resonance,
 $F_{\varphi i}=\{\varLambda _{i}, I_{iR}\}\varphi _{Ri}+u_{Ri}\sin \varphi _{Ri}$, this function gives
 \begin{equation} \langle {f_i } \rangle ={-} \sqrt {\frac{m_ec^2g_i}{2u_{iR}} }\frac{S}{{2{\rm \pi} }}={-}\sqrt{\frac{8|u_{iR}|}{a_im_ec^2g_i}}\int_{ \varphi_{i-} }^{\varphi_{iR} } {\sqrt {( {\varphi_{Ri} - \varphi_i } ) + a_i ( {\sin \varphi_{Ri} - \sin \varphi_i } )}\, \textrm{d} \varphi_i }, \end{equation}
where  $S$ is the area surrounded by the separatrix in the phase portrait in figure 7(b) (see details of (3.6) derivations in Neishtadt (Reference Neishtadt1999) and Artemyev et al. (Reference Artemyev, Neishtadt, Vainchtein, Vasiliev, Vasko and Zelenyi2018a)). Therefore, the
 $\varDelta _\textrm {scat}I_i$ change due to phase bunching is equal to
 $-S/2{\rm \pi}$ and for
 $a_i\gg 1$ (i.e. for very weak magnetic field inhomogeneity; note
 $\{\varLambda _i, I_{iR}\}\sim \partial /\partial s$) we have
 $\varDelta _\textrm {scat}I_i=-8\sqrt {2u_{iR}/m_ec^2g_i}$ where
 $S=16\sqrt {2u_{iR}/m_ec^2g_i}$ is the width of the resonance for large amplitude waves (Palmadesso Reference Palmadesso1972; Karimabadi et al. Reference Karimabadi, Akimoto, Omidi and Menyuk1990).
The change of  $I_i$ due to phase bunching (nonlinear scattering) is sufficiently small to consider this process locally in energy/pitch-angle space, i.e.
 $\varDelta _\textrm {scat}I_i\ll I_i$ (see discussion of exceptions for
 $\varDelta _\textrm {scat}I_i\sim I_i$ in Appendix A), whereas the change of
 $I_i$ due to phase trapping is essentially non-local. To evaluate
 $\varDelta _\textrm {trap}I_i$, we take into account that
 $I_i=I_{iR}$ in the resonance (during the trapping), the trapping time is defined as
 $2{\rm \pi} I_\phi =\int {P_{\varphi i}\, \textrm {d} \varphi _{iR}}=S$, and
 $I_{\phi }$ is conserved during the trapping (because trapped particles oscillate in the
 $(\varphi _{iR}, P_{\phi i})$ plane much faster than the system evolves (much faster than variations of slow variables
 $s,P$). Thus, the trapping time is defined as the time of arrival to the resonance
 $t_R$ with
 $\dot S(t_R)>0$ (the growth of the area surrounded by the separatrix allows trapping of particles moving along open trajectories into closed trajectories), whereas the time
 $t_R^*$ of escape from the trapping is defined by
 $S(t_R^*)=S(t_R)$ and
 $\dot S(t_R^*)<0$ (see scheme in figure 7d)
 \begin{equation} \varDelta_\textrm{trap} I_i = I_{iR} ( {t_{iR}^* } ) - I_{iR} ( {t_{iR} } ),\quad S( {t_{iR}^* } ) = S( {t_{iR} } ),\quad \dot S( {t_{iR} } ) > 0,\quad \dot S( {t_{iR}^* } ) < 0.\end{equation}
At the resonance, an electron can be scattered (i.e. experience the phase bunching) or trapped, and this depends on the  $\varphi _{iR}$ value (e.g. Albert Reference Albert1993; Itin et al. Reference Itin, Neishtadt and Vasiliev2000; Grach & Demekhov Reference Grach and Demekhov2018). However, as
 $\varphi _{iR}$ is a fast oscillating variable, we can consider the so-called probability of trapping instead of tracing the precise
 $\varphi _{iR}$ value: the range of
 $\varphi _{iR}$ of trapped particles, i.e. the ratio of trapped particles to the total number of resonant particles for a single resonance, is the probability of trapping,
 $\varPi _i$ (e.g. Arnold, Kozlov & Neishtadt (Reference Arnold, Kozlov and Neishtadt2006), and references therein). For small
 $\varPi _i$, this probability is defined as the ratio of the change of the area under the separatrix,
 $\dot S$, and the total resonant flux
 $\int _0^{2\pi }\dot P_{\varphi ,i}\, \textrm {d} \phi =2{\rm \pi} \{\varLambda _i, I_{iR}\}$:
 $\varPi _i=\dot S/2{\rm \pi} \{\varLambda _i, I_{iR}\}=\{S, F_i\}/2{\rm \pi} \{\varLambda _i, I_{iR}\}$. This definition of the trapping probability has been verified for various plasma systems (e.g. Artemyev et al. Reference Artemyev, Vasiliev, Mourenas, Agapitov and Krasnoselskikh2014a; Leoncini, Vasiliev & Artemyev Reference Leoncini, Vasiliev and Artemyev2018; Vainchtein et al. Reference Vainchtein, Zhang, Artemyev, Mourenas, Angelopoulos and Thorne2018). Therefore, the resonant interaction can be characterized by
 $\varPi , \varDelta _\textrm {trap} I_i$ and
 $\varDelta _\textrm {scat} I_i$.
Due to conservation of  $H_i=m_ec^2\gamma -\omega _0I_0-\omega _1I_1$, changes of
 $I_i$ are directly related to
 $\gamma$ changes, whereas the
 $I_x=I_0+I_1$ relation gives the pitch-angle change
 \begin{align} &\frac{{\omega_i \sin ^2 \alpha_\textrm{eq} }}{{\gamma ^2 - 1}}( {\varDelta_i \gamma } )^2 - 2\varDelta_i \gamma \frac{{\varOmega_\textrm{eq} - \gamma \omega_i \sin ^2 \alpha_\textrm{eq} }}{{\gamma ^2 - 1}} \nonumber\\ & \quad + \omega_i ( {\sin ^2 ( {\alpha_\textrm{eq} + \varDelta _i \alpha_\textrm{eq} } ) - \sin ^2 \alpha_\textrm{eq} } ) = 0, \end{align}
that for small changes (phase bunching) can be rewritten as
 \begin{equation} \varDelta_i \alpha_\textrm{eq} = \varDelta_i \gamma \frac{{\varOmega_\textrm{eq} - \gamma \omega_i \sin ^2 \alpha_\textrm{eq} }}{{\omega_i \sin \alpha_\textrm{eq} \cos \alpha_\textrm{eq} ( {\gamma ^2 - 1} )}}.\end{equation}
Therefore, the map for one resonance can be written as
 \begin{equation} \left.\begin{array}{c} \left( \begin{array}{@{}c@{}} {\bar \gamma } \\ {\bar \alpha_\textrm{eq} }, \\ \end{array} \right) = \left( \begin{array}{@{}c@{}} G_{\gamma i} ( {\gamma ,\alpha_\textrm{eq} } ) \\ {G_{\alpha i} ( {\gamma ,\alpha_\textrm{eq} } )} \end{array} \right) = \left( \begin{array}{@{}c@{}} \gamma \\ {\alpha_\textrm{eq} } \end{array} \right) + \left( \begin{array}{@{}c@{}} {\varDelta_i \gamma } \\ {\varDelta_i \alpha_\textrm{eq} } \end{array} \right),\\ \varDelta_i \gamma = \omega_i \left\{ \begin{array}{@{}ll} \varDelta_\textrm{scat} I_i ( \gamma ,\alpha_\textrm{eq} ), & \xi_i \in [ \varPi_i ( \gamma ,\alpha_\textrm{eq} ),1 ] \\ \varDelta_\textrm{trap} I_i ( \gamma ,\alpha_\textrm{eq} ), & \xi_i \in [ 0,\varPi_i ( \gamma ,\alpha_\textrm{eq} ) ] \end{array} \right.\\ \varDelta_i \alpha_\textrm{eq} = \left\{ {\begin{array}{@{}ll} {\dfrac{{\varOmega_\textrm{eq} - \gamma \omega_i \sin ^2 \alpha_\textrm{eq} }}{{\sin \alpha_\textrm{eq} \cos \alpha_\textrm{eq} ( {\gamma ^2 - 1} )}}\varDelta_\textrm{scat} I_i ( {\gamma ,\alpha_\textrm{eq} } ),} & {\xi_i \in [ {\varPi_i ( {\gamma ,\alpha_\textrm{eq} } ),1} ]} \\ {\varDelta_i \alpha_\textrm{eq} ( {\varDelta_\textrm{trap} I_i ,\gamma ,\alpha_\textrm{eq} } ),} & {\xi_i \in [ {0,\varPi_i ( {\gamma ,\alpha_\textrm{eq} } )} )} \end{array}} \right. \end{array}\right\} \end{equation}
where  $\xi _i$ is a random variable uniformly distributed in
 $[0,1]$. If there are two resonances (one with the first wave and another one with the second wave) during one electron bounce period
 $\tau _b$, then over this period the electron energy/pitch-angle change should be
 \begin{equation} \left( {\begin{array}{c} {\bar \gamma } \\ {\bar \alpha_\textrm{eq} } \end{array}} \right) = \left( \begin{array}{c} {G_{\gamma 1} ( {G_{\gamma 0} ( {\gamma ,\alpha_\textrm{eq} } ),G_{\alpha 0} ( {\gamma ,\alpha_\textrm{eq} } )} )} \\ {G_{\alpha 1}( {G_{\gamma 0} ( {\gamma ,\alpha_\textrm{eq} } ),G_{\alpha 0} ( {\gamma ,\alpha_\textrm{eq} } )} )} \end{array}\right).\end{equation}
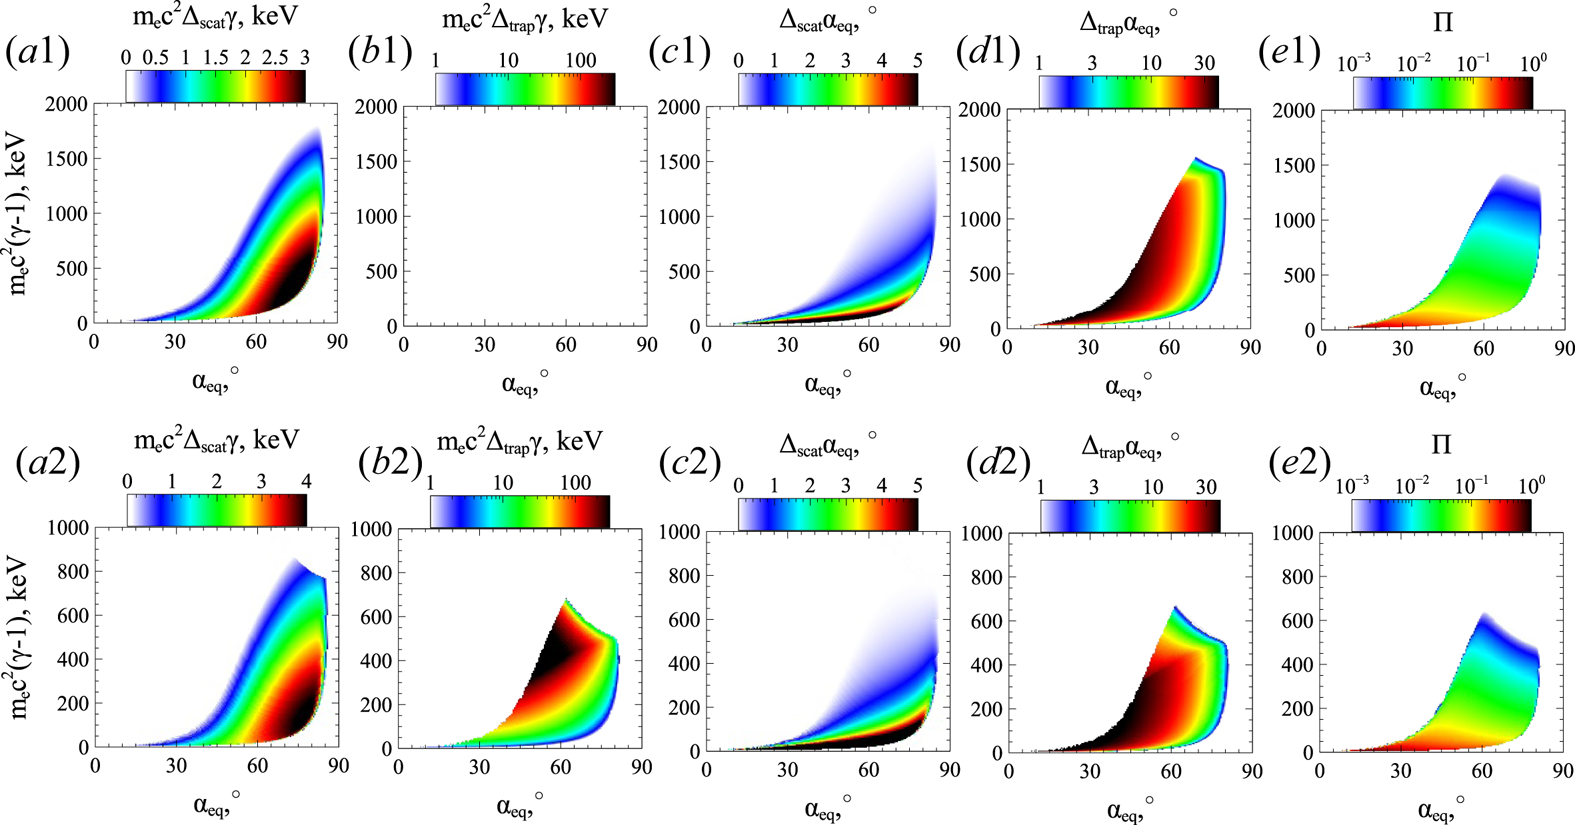
Figure 8 shows 10 main characteristics of map (3.11) in the energy/pitch-angle space: amplitudes of scattering  $\varDelta _{scat,i}\gamma , \varDelta _{scat, i}\alpha _\textrm {eq}$; amplitudes of trapping
 $\varDelta _{trap,i}\gamma , \varDelta _{trap, i}\alpha _\textrm {eq}$; and trapping probabilities
 $\varPi _i$ for two field-aligned whistler-mode waves. To derive these characteristics for given energy and pitch-angle, we (1) calculate
 $\gamma , \alpha _\textrm {eq}$ and resonance location
 $s_R$ given by equation
 $I_i=I_{iR}$; (2) determine coefficients of Hamiltonian
 $F_i, S, \dot S$, and trapping probability
 $\varPi$ at
 $s_R$; (3) determine
 $\varDelta _\textrm {scat}I_i=-S/2{\rm \pi}$, position of escape from the resonance
 $s_R^*$ (if
 $\dot S(s_R)>0$), and
 $\varDelta _\textrm {trap}I_i=I_{iR}(s_R^*)- I_{iR}(s_R)$; (4) recalculate
 $\varDelta _\textrm {scat}I_i, \varDelta _\textrm {trap}I_i$ into energy and pitch-angle changes. Numerical verification of this technique of
 $\varDelta _{scat,i}\gamma , \varDelta _{trap,i}\gamma , \varPi _i$ with test particle trajectories can be found in Vainchtein et al. (Reference Vainchtein, Zhang, Artemyev, Mourenas, Angelopoulos and Thorne2018) and Artemyev et al. (Reference Artemyev, Neishtadt and Vasiliev2020b).
System characteristics for two field-aligned whistler-mode waves with the parameters as in figure 1: energy change due to scattering (a) and trapping (b), pitch-angle change due to scattering (c) and trapping (d), trapping probability (e).

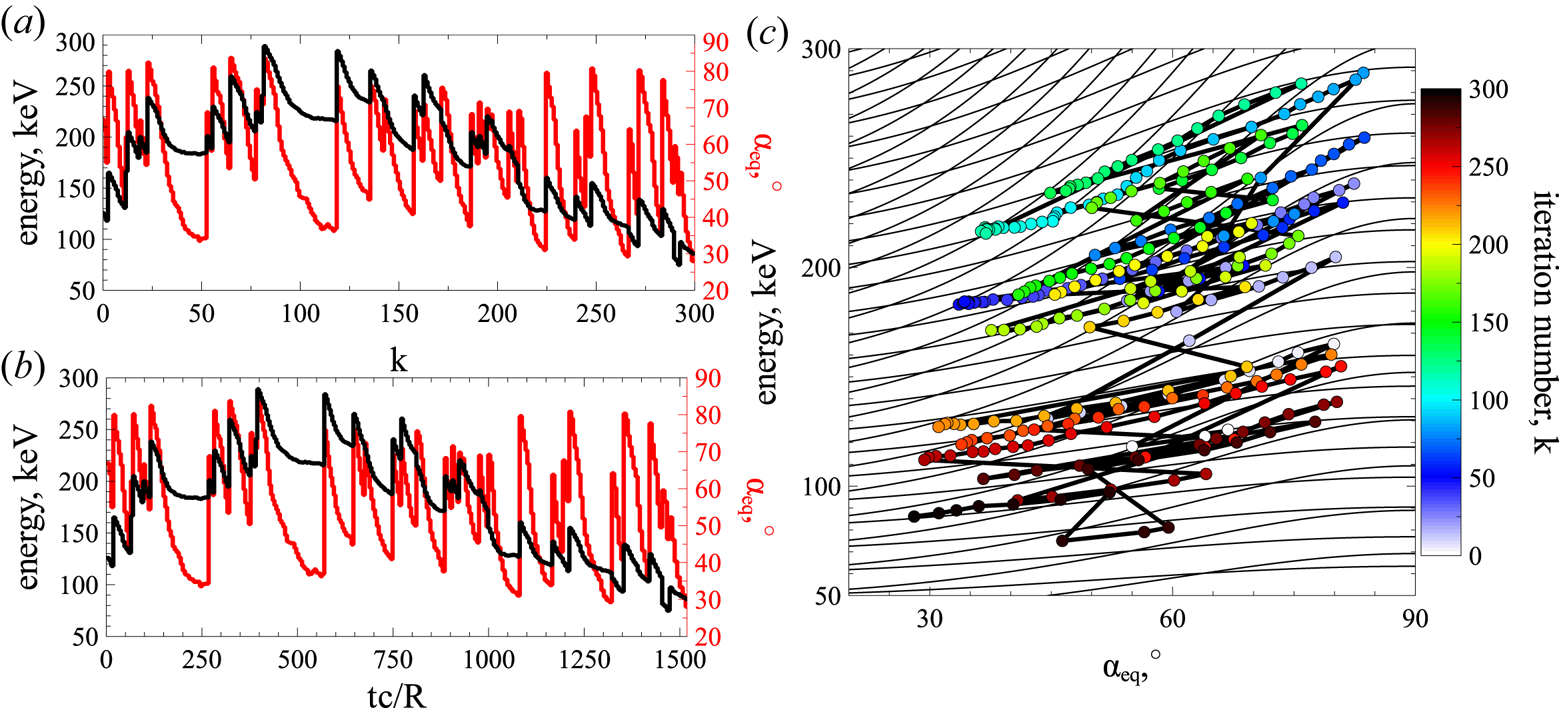
Substituting characteristics from figure 8 into map (3.11), we evaluate dynamics of resonant electrons. Figure 9 shows a sample trajectory: energy and pitch-angle are plotted versus the number of iterations  $k$ and versus time
 $t=\sum _k\tau _{b,k}(\gamma ,\alpha _\textrm {eq})$. The trajectory obtained with the mapping technique contains all elements that can be found in the numerically integrated trajectory (compare with figure 2): energy decrease due to phase bunching and rare jumps due to phase trapping. Note that the bounce period is given by
 $\tau _b=4\int _0^{s_{\max }}\, \textrm {d} s/p$ with
 $p=m_ec^2\sqrt {1-\gamma -2I_x\varOmega _\textrm {ce}(s)}$ and
 $2I_x\varOmega _\textrm {ce}(s_{\max })=1-\gamma$. Any direct comparison of trajectories obtained via numerical integration and mapping technique is not possible due to significant randomization of resonant electron motion, i.e. trajectories in energy/pitch-angle plane for two test electrons can differ significantly even with small difference of initial electron phases (e.g. Shklyar Reference Shklyar1981; Le Queau & Roux Reference Le Queau and Roux1987; Albert Reference Albert2001). Thus, the verification of map (3.11) is mainly based on verification of (3.5) and (3.7a–d) (see Artemyev et al. Reference Artemyev, Vasiliev, Mourenas, Neishtadt, Agapitov and Krasnoselskikh2015, Reference Artemyev, Neishtadt, Vasiliev and Mourenas2016b; Vainchtein et al. Reference Vainchtein, Zhang, Artemyev, Mourenas, Angelopoulos and Thorne2018) and on verification of 1D analogues of this map (see Artemyev et al. Reference Artemyev, Neishtadt and Vasiliev2020b).
A sample trajectory obtained using map (3.11): energy and pitch-angle versus number of map iterations (a), energy and pitch-angle versus time (b), particle trajectory in the energy/pitch-angle space (c).

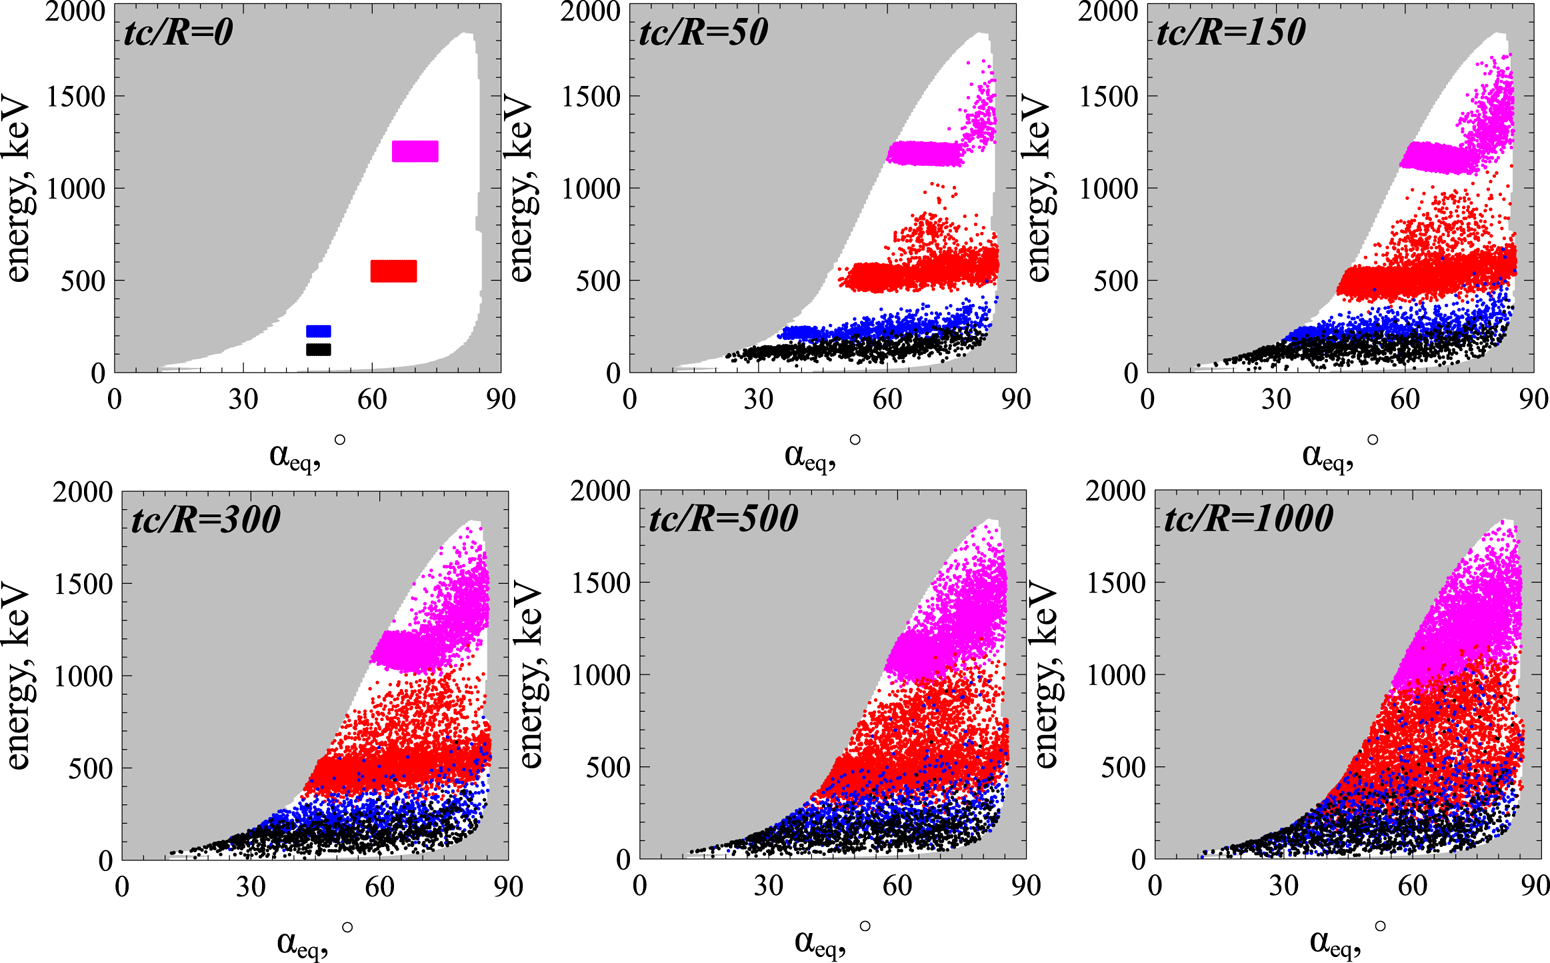
Using map (3.11), we can simulate the evolution of the electron distribution function as an ensemble of test trajectories. We start with the test simulation of electron spread in the energy/pitch-angle space. Four populations of electrons with small ranges of initial energy and pitch-angles are traced for  $500$ interactions and their positions in energy/pitch-angle space are shown at six different times, see figure 10. White colour shows the area of resonant wave–particle interaction (see Appendix B for a definition of this area and for technical details of the map (3.11) application). Electrons of different initial populations quickly (already after
 $tc/R\sim 50$, i.e.
 ${\sim }15$ resonant interactions) spread within a wide pitch-angle range, but are somehow separated in energy. After
 $tc/R\sim 300$ (
 ${\sim }80$ resonant interactions) the populations fill large areas in energy/pitch-angle space and start overlapping. After
 $tc/R\sim 1000$ (
 ${\sim }250$ resonant interactions) the entire energy/pitch-angle space is covered, and electrons from low energy populations (black and blue) reach high energies (
 ${\sim }1$ MeV), whereas electrons from high-energy populations (red and magenta) decelerate with energy losses of several hundred keVs. Such fast phase mixing should result in spreading and smoothing of the electron phase space density.
Evolution of four electron populations modelled with map (3.11). Six moments of time are shown. White colour shows the area of wave–particle nonlinear resonant interaction, see Appendix B.

To examine the evolution of the electron phase space density, we start with a power law distribution  $f_0(\gamma ,\alpha )=C\cdot \sin \alpha _\textrm {eq}\cdot (\gamma -1)^{-3}$ typical in the radiation belts, and fit this distribution by
 $2\times 10^7$ trajectories. There are
 $180\times 400$ pitch-angle/energy values, and
 $\sim 22600$ within the resonant area; for each value within the resonant area, we run
 $1000$ trajectories. Each trajectory is traced for 300 interactions with the map (3.11), and corresponding
 $\alpha _\textrm {eq}(k), \gamma (k)$ profiles transferred to time series. Then, we recalculate the distribution from
 $f_0$ using phase space density conservation along the trajectories. Figure 11 shows three snapshots of the distribution
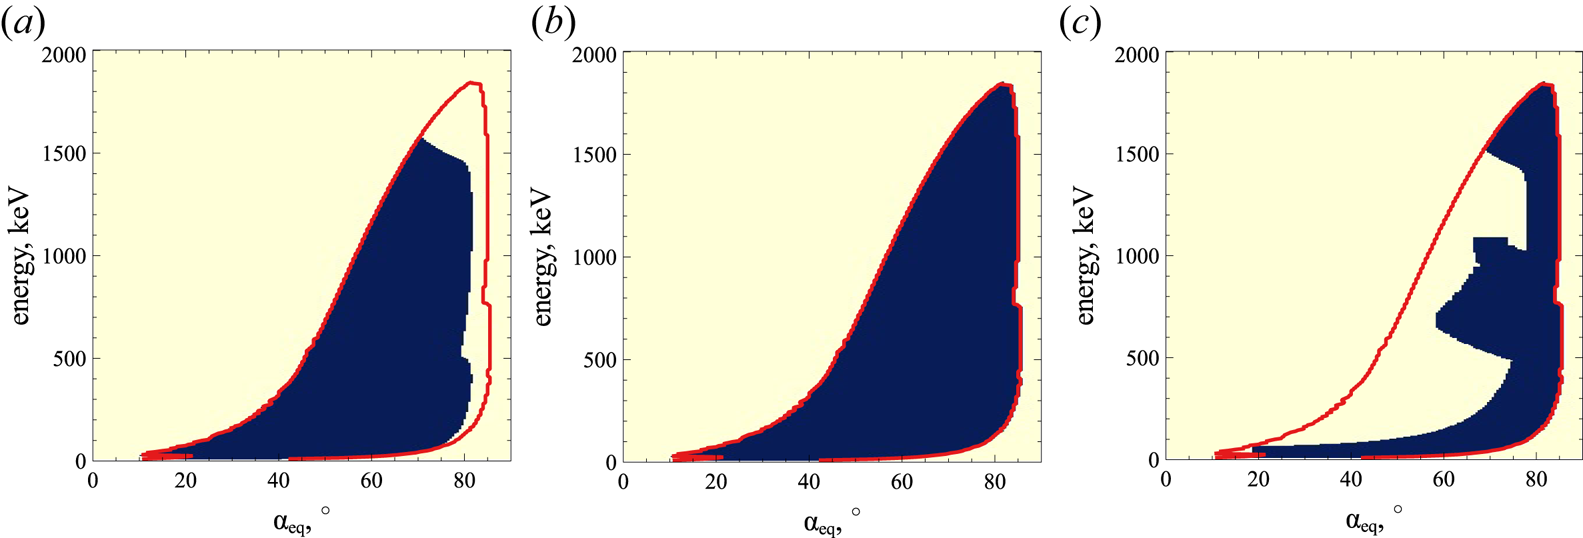
 $f(\alpha ,\gamma )$ at different times (inserted panels show the low energy subinterval). The rapid evolution of the distribution function results in phase space density flattening within the resonant region: there is an increase of high-energy/small pitch-angle phase space density and a decrease of low energy/large pitch-angle phase space density. During the simulation time, one electron can be trapped several times, i.e. most of particles circulate in the energy/pitch-angle space, because trappings bring them to the high energy region from which they then drift by bunching. Such a circulation also comprises successive trappings by two waves that bring electrons to the very high-energy region, whereas long periods of phase bunching without trappings can transport very energetic electrons to quite low energies. The last two phenomena are less frequent, and mixing of
 ${\sim }1$ MeV electrons with
 ${<}100$ keV electrons is slower than mixing within energy localized domains.
Evolution of electron distribution modelled with map (3.11). Three moments of time are shown:  $tc/R=0$ (a),
 $tc/R=300$ (b),
 $tc/R=1000$ (c). The initial distribution
 $f_0(\gamma ,\alpha )=C\cdot \sin \alpha _\textrm {eq}\cdot (\gamma -1)^{-3}$ in panel (a).

The general trend of the resonant electron transport in the energy/pitch-angle space is the reduction of phase space density gradients. In the presence of a single wave, such a gradient smoothing occurs along the resonant curves,  $\gamma -\omega _0I_0=\textrm {const.}$ (Artemyev et al. Reference Artemyev, Neishtadt and Vasiliev2020b). In systems with two waves, the intersection of resonant curves
 $\gamma -\omega _0I_0=\textrm {const.}$ and
 $\gamma -\omega _1I_1=\textrm {const.}$ results in 2-D gradient smoothing, i.e. we can expect a reduction of gradients in energy space after integration over pitch-angle. Figure 12 shows such electron acceleration: increase of high-energy population and decrease of low energy population that result in gradient smoothing. This is the typical evolution of the electron distribution due to resonant interaction with whistler-mode waves (see similar results for nonlinear (Vainchtein et al. Reference Vainchtein, Zhang, Artemyev, Mourenas, Angelopoulos and Thorne2018) and quasi-linear (Thorne et al. Reference Thorne, Li, Ni, Ma, Bortnik, Chen, Baker, Spence, Reeves and Henderson2013; Li et al. Reference Li, Thorne, Ma, Ni, Bortnik, Baker, Spence, Reeves, Kanekal and Green2014) simulations).
Pitch-angle integrated electron distribution,  $\int _0^{\pi }\sin \alpha _\textrm {eq}\cdot psd(E,\alpha _\textrm {eq})\, \textrm {d} \alpha _\textrm {eq}$, from figure 11.

4. Discussion and conclusions
The proposed approach allows us to investigate the long-term evolution of the electron distribution function in a system with nonlinear wave–particle interaction. This approach is based on the mapping technique that significantly simplifies electron trajectory integration by excluding from the consideration the main, adiabatic part of electron orbits and by focusing only on small intervals of resonant electron phase bunching and trapping. This approach is somewhat analogous to the Green function method proposed by Furuya et al. (Reference Furuya, Omura and Summers2008) and Omura et al. (Reference Omura, Miyashita, Yoshikawa, Summers, Hikishima, Ebihara and Kubota2015), and to the nonlinear kinetic equation proposed by Artemyev et al. (Reference Artemyev, Neishtadt, Vasiliev and Mourenas2016b) and Vainchtein et al. (Reference Vainchtein, Zhang, Artemyev, Mourenas, Angelopoulos and Thorne2018). However, contrary to these other methods, the mapping does not require a very fine discretization of energy/pitch-angle space and it can easily be generalized to multiwave systems. Resonances with different waves are very important for the destruction of the symmetry typical for the single wave system, where conservation of  $(\gamma -\omega I)$ results in a reduced mixing in energy/pitch-angle space. Already, two waves with different characteristics are sufficient to produce a total mixing in energy/pitch-angle space (see figure 10) and a smoothing (reduction) of electron phase space density gradients (see figure 12). The similar effect of fast mixing due to two independent resonances has been found in various dynamical systems with quite general properties (e.g. Gelfreich et al. Reference Gelfreich, Rom-Kedar, Shah and Turaev2011; Itin & Neishtadt Reference Itin and Neishtadt2012).
Moreover, note that our simulations shown in figures 9–12 are quite localized in time, since  $R/c\sim 1000$ is approximately 100 s in the outer radiation belt (
 $L\sim 5$), and that this time period is much smaller than the characteristic time of evolution of any process typically modelled by quasi-linear theory (Thorne et al. Reference Thorne, Li, Ni, Ma, Bortnik, Chen, Baker, Spence, Reeves and Henderson2013; Drozdov et al. Reference Drozdov, Shprits, Orlova, Kellerman, Subbotin, Baker, Spence and Reeves2015; Albert et al. Reference Albert, Starks, Horne, Meredith and Glauert2016; Ma et al. Reference Ma, Li, Thorne, Nishimura, Zhang, Reeves, Kletzing, Kurth, Hospodarsky and Henderson2016, Reference Ma, Li, Bortnik, Thorne, Chu, Ozeke, Reeves, Kletzing, Kurth and Hospodarsky2018). Therefore, we extend the simulation interval to
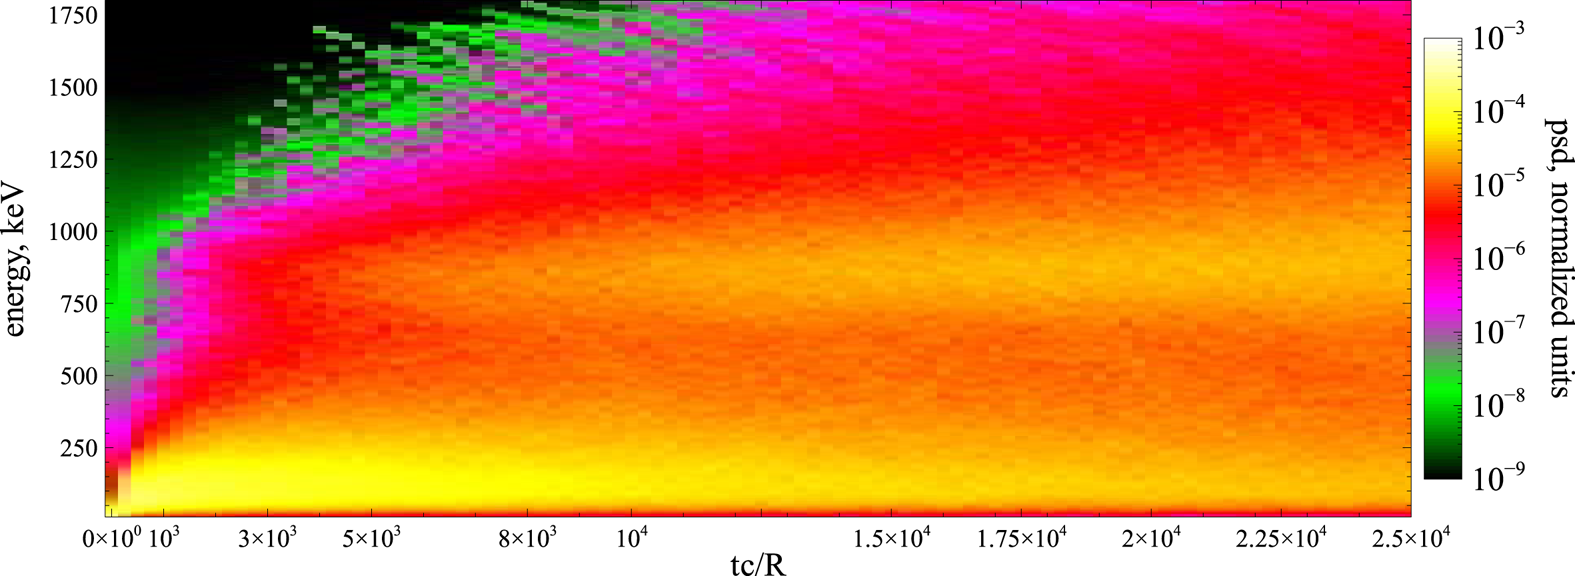
 $tc/R=2.5\times 10^4$ (
 ${\sim }40$ min) to show that this time scale is already sufficiently long to almost fully smooth gradients within
 ${<}1$ MeV, see figure 13. Generally, however, 40 minutes is a too long interval to keep whistler-mode wave activity at the same high level (although such long-living regions of intense waves are sometimes observed, see Cully, Bonnell & Ergun (Reference Cully, Bonnell and Ergun2008), Agapitov et al. (Reference Agapitov, Artemyev, Mourenas, Mozer and Krasnoselskikh2015b) and Cattell et al. (Reference Cattell, Breneman, Thaller, Wygant, Kletzing and Kurth2015)).
Evolution of pitch-angle integrated electron distribution,  $\int _0^{\pi }\sin \alpha _\textrm {eq}\cdot psd(E,\alpha _\textrm {eq})\, \textrm {d} \alpha _\textrm {eq}$ in a long-term simulation (psd is the electron phase space density).

Figure 8 shows energy/pitch-angle domains of nonlinear wave–particle interaction, and these domains are used for the simulation of the electron distribution function evolution (see figures 10–13 and Appendix B). For simplicity, we assume that the boundary of these domains is impenetrable. However, additionally to nonlinear wave–particle interactions (phase bunching and phase trapping), there is also in reality some electron diffusion. This diffusion is finite everywhere in the energy/pitch-angle plane where there is an electron resonance with the whistler-mode wave. Thus, this diffusion would transport electrons across the boundary of the domains of nonlinear wave–particle interaction. The direction of this transport depends on the phase space density gradients. At low energies, the nonlinear wave–particle interaction results in phase space density decrease (see figure 13), and thus pitch-angle diffusion will bring new small-energy particles into these domains. At high energies, the nonlinear wave–particle interaction results in phase space density increase (see figure 13), and thus both energy and pitch-angle diffusion will try to spread this phase space density maximum. Such diffusion can be included into the map (3.11) as random energy and pitch-angle jumps with zero mean values and amplitudes given by the quasi-linear model (e.g. Albert Reference Albert2010). However, the diffusion is generally much weaker than nonlinear phase bunching and trapping, and the diffusion-driven evolution of the phase space density should mostly appear after nonlinear wave–particle interaction has already partly smoothed the initial phase space density gradients (Artemyev et al. Reference Artemyev, Neishtadt and Vasiliev2019a).
The map (3.11) has been constructed for electron interaction with monochromatic waves (see (2.1)), whereas spacecraft observations in the Earth's radiation belts often report about more complex wave field distributions, e.g. significant wave amplitude modulation (Tao et al. Reference Tao, Bortnik, Albert, Thorne and Li2013; Santolık et al. Reference Santolık, Kletzing, Kurth, Hospodarsky and Bounds2014; Zhang et al. Reference Zhang, Thorne, Artemyev, Mourenas, Angelopoulos, Bortnik, Kletzing, Kurth and Hospodarsky2018, Reference Zhang, Mourenas, Artemyev, Angelopoulos, Bortnik, Thorne, Kurth, Kletzing and Hospodarsky2019), accompanied by fast, strong and random variations of wave frequency and phase (Zhang et al. Reference Zhang, Agapitov, Artemyev, Mourenas, Angelopoulos, Kurth, Bonnell and Hospodarsky2020a,Reference Zhang, Mourenas, Artemyev, Angelopoulos, Kurth, Kletzing and Hospodarskyb), often resulting in the formation of almost independent short wave packets or subpackets (Mourenas et al. Reference Mourenas, Zhang, Artemyev, Angelopoulos, Thorne, Bortnik, Neishtadt and Vasiliev2018; Zhang et al. Reference Zhang, Agapitov, Artemyev, Mourenas, Angelopoulos, Kurth, Bonnell and Hospodarsky2020a). Such a chaotization of wave fields is likely partly driven by currents of resonant electrons (Nunn et al. Reference Nunn, Santolik, Rycroft and Trakhtengerts2009; Demekhov Reference Demekhov2011; Katoh & Omura Reference Katoh and Omura2011, Reference Katoh and Omura2016; Tao, Zonca & Chen Reference Tao, Zonca and Chen2017; Tao et al. Reference Tao, Zonca, Chen and Wu2020) and sideband instability (Nunn Reference Nunn1986), as well as by the simultaneous excitation of at least two different waves with a significant frequency difference (Katoh & Omura Reference Katoh and Omura2013; Crabtree et al. Reference Crabtree, Tejero, Ganguli, Hospodarsky and Kletzing2017; Zhang et al. Reference Zhang, Mourenas, Artemyev, Angelopoulos, Kurth, Kletzing and Hospodarsky2020b). Since phase bunching is a local process, wave modulation cannot affect the theoretical model of energy and pitch-angle jumps due to bunching, but the inclusion of such a modulation into the two-wave model map would require some probabilistic distribution of wave amplitudes within short wave packets. The situation is more complicated for phase trapping, which is non-local and depends on wave packet size and amplitude modulation within the packets (Mourenas et al. Reference Mourenas, Zhang, Artemyev, Angelopoulos, Thorne, Bortnik, Neishtadt and Vasiliev2018). Test particle simulations demonstrate that wave modulation alone makes phase trapping less efficient for electron acceleration, but increases the probability of phase trapping (Kubota & Omura Reference Kubota and Omura2018; Gan et al. Reference Gan, Li, Ma, Albert, Artemyev and Bortnik2020a; Zhang et al. Reference Zhang, Agapitov, Artemyev, Mourenas, Angelopoulos, Kurth, Bonnell and Hospodarsky2020a). Thus, an important further development of the mapping technique for nonlinear wave–particle interaction would require modifications of the phase trapping model.
Another important constraint for trapping efficiency is related to the resonance overlapping in the multiwave system. We restrict our consideration to the case of well separated resonances; however, spacecraft observations often report the presence of quite broad-band whistler-mode emission where resonances of two neighbouring waves can overlap (see discussion in, e.g. Summers et al. (Reference Summers, Omura, Nakamura and Kletzing2014) and Tong et al. (Reference Tong, Vasko, Artemyev, Bale and Mozer2019)). Such resonance overlapping should enhance the electron diffusion, but destroy the phase trapping (e.g. Karimabadi et al. Reference Karimabadi, Akimoto, Omidi and Menyuk1990; Artemyev et al. Reference Artemyev, Neishtadt, Zelenyi and Vainchtein2010; Shklyar & Zimbardo Reference Shklyar and Zimbardo2014). In the absence of trapping resonant systems can be described by the simple Fokker–Plank equation (Lichtenberg & Lieberman Reference Lichtenberg and Lieberman1983; Sagdeev et al. Reference Sagdeev, Usikov and Zaslavsky1988), i.e. the mapping technique described within this study can be reduced to a standard map. The most natural partial overlapping would result in a quite complex situation where the assumption of the resonant phase randomization (the basic assumption of the described map) could be violated. Such systems would be described by fractional Fokker–Plank equations (e.g. Zelenyi & Milovanov Reference Zelenyi and Milovanov2004; Zaslavsky Reference Zaslavsky2005; Isliker, Vlahos & Constantinescu Reference Isliker, Vlahos and Constantinescu2017), and this is a poorly investigated topic in application to the physics of resonant wave–particle interaction.
To conclude, we have demonstrated the usefulness of the mapping technique for Hamiltonian systems describing nonlinear resonant interaction of charged particles and intense electromagnetic waves. We have shown that in systems with two (and more) waves, the resonant interaction destroys the symmetries of the single wave resonance and drives a rapid smoothing of particle phase space density gradients. The proposed approach appears very promising for the investigation of relativistic electron interaction with various intense whistler-mode waves and EMIC waves in the Earth's radiation belts (Katoh & Omura Reference Katoh and Omura2013; Mourenas et al. Reference Mourenas, Artemyev, Agapitov, Mozer and Krasnoselskikh2016a,Reference Mourenas, Artemyev, Ma, Agapitov and Lib; Ma et al. Reference Ma, Mourenas, Li, Artemyev and Thorne2017; He et al. Reference He, Yan, Zhang, Yu, Ma, Cao and Cui2020; Yu et al. Reference Yu, Wang, Li, Cui, Cao and He2020; Zhang et al. Reference Zhang, Mourenas, Artemyev, Angelopoulos, Kurth, Kletzing and Hospodarsky2020b) or in the solar wind (Wilson et al. Reference Wilson, Cattell, Kellogg, Goetz, Kersten, Hanson, MacGregor and Kasper2007, Reference Wilson, Koval, Szabo, Breneman, Cattell, Goetz, Kellogg, Kersten, Kasper and Maruca2013; Krafft, Volokitin & Krasnoselskikh Reference Krafft, Volokitin and Krasnoselskikh2013; Krafft & Volokitin Reference Krafft and Volokitin2016; Roberg-Clark et al. Reference Roberg-Clark, Agapitov, Drake and Swisdak2019; Tong et al. Reference Tong, Vasko, Artemyev, Bale and Mozer2019). It could be useful also for studying electron acceleration by simultaneous laser-driven plasma waves (Modena et al. Reference Modena, Najmudin, Dangor, Clayton, Marsh, Joshi, Malka, Darrow, Danson and Neely1995; Tikhonchuk Reference Tikhonchuk2019), and electron precipitation driven by VLF waves generated by electron beams or antennas in space (Carlsten et al. Reference Carlsten, Colestock, Cunningham, Delzanno, Dors, Holloway, Jeffery, Lewellen, Marksteiner and Nguyen2019; Borovsky et al. Reference Borovsky, Delzanno, Dors, Thomsen, Sanchez, Henderson, Marshall, Gilchrist, Miars and Carlsten2020).
Editor Hong Qin thanks the referees for their advice in evaluating this article.
Funding
The work of A.V.A., A.I.N. and A.A.V. was supported by Russian Scientific Foundation (project no. 19-12-00313). The work of A.V.A and X.J.Z. was also supported in part by NSF grant 2021749 and NASA grant 80NSSC20K1270. The work of X.J.Z. and D.L.V. was supported by NASA grants 80NSSC20K1578 and 80NSSC19K0266. The work of A.I.N. was supported in part by the Leverhulme Trust grant RPG-2018-143.
Declaration of interests
The authors report no conflict of interest.
Appendix A
Equation (3.6) describes energy decrease due to phase bunching, and natural limitation of this equation is that  $\gamma +\varDelta \gamma$ should be larger than one; or, alternatively,
 $I_x+(m_ec^2/\omega ) \varDelta \gamma$ should be larger than zero. This effect of drift asymmetry, i.e. the absence of electron drift to negative
 $I_x$, has been noticed by Lundin & Shkliar (Reference Lundin and Shkliar1977) who showed that for very small
 $I_x$ the phase bunching changes the drift direction. This effect is called anomalous phase bunching (Kitahara & Katoh Reference Kitahara and Katoh2019; Gan et al. Reference Gan, Li, Ma, Albert, Artemyev and Bortnik2020a; Grach & Demekhov Reference Grach and Demekhov2020) and basically consists in positive
 $I_x$ (and
 $\gamma$) changes due to bunching at very small
 $I_x$. Theoretically, the parametrical boundary of anomalous bunching in energy/pitch-angle space is determined by
 $I_x < I_x^*$ with
 $I_x^*$ scaling as
 $(B_w/B_0)^{2/3}$. Let us derive this scaling, but leave the more detailed consideration of small
 $I_x$ phase bunching to further consideration. We start with (2.5) written for a single wave
 \begin{equation} H_I ={-} \omega I + m_e c^2 \gamma + \sqrt {\frac{{2I\varOmega_\textrm{ce} }}{{m_e c^2 }}} \frac{e}{\gamma }\frac{{B_{w} }}{{k}}\sin \varphi ,\quad \gamma = \sqrt {1 + \frac{{\left( {P + kI } \right)^2 }}{{m_e^2 c^2 }} + \frac{{2I\varOmega_\textrm{ce} }}{{m_e c^2 }}}. \end{equation}
Hamiltonian equations for  $I$ and
 $\varphi$ take the form
 \begin{equation} \dot I ={-} \sqrt {\frac{{2I\varOmega_\textrm{ce} }}{{m_e c^2 }}} \frac{{eB_w }}{{k\gamma }}\sin \varphi ,\quad \dot \varphi = \frac{{k^2 }}{{\gamma m_e }}\left( {I - I_R } \right) + \sqrt {\frac{{\varOmega_\textrm{ce} }}{{2Im_e c^2 }}} \frac{{eB_w }}{{k\gamma }}\sin \varphi,\end{equation}
where  $I_R=(\gamma \omega m_e-P)/k$ is the solution of
 $\partial H/\partial I=0$ equation for
 $B_w=0$. Equation (A 2a,b) describes fast phase rotation (with frequency
 $k^2(I-I_R)/\gamma m_e$) and
 $I,\varphi$ evolution driven by much weaker wave force
 $\sim B_w/B_0$. Until
 $I$ (and
 $I_R$) is sufficiently large to keep this time separation, we can apply the theory of phase bunching resulting in (3.6). However, let us consider small
 $I, I_R$ values. We introduce a small parameter
 $\varepsilon =B_w/B_0$ and normalized
 $(\tilde {I},\tilde {I}_R)=(I,I_R)/\varepsilon ^\beta$
 \begin{equation} \frac{{\textrm{d} \tilde I}}{{\textrm{d} t}} ={-} \sqrt {\frac{{2\tilde I\varOmega_\textrm{ce} }}{{m_e c^2 }}} \frac{{eB_0 }}{{k\gamma }}\varepsilon ^{1 - \beta /2} \sin \varphi ,\quad \frac{{\textrm{d} \varphi }}{{\textrm{d} t}} = \frac{{k^2 \varepsilon ^\beta}}{{\gamma m_e }}( {\tilde I - \tilde I_R } ) + \sqrt {\frac{{\varOmega_\textrm{ce} }}{{2\tilde Im_e c^2 }}} \frac{{eB_0 }}{{k\gamma }}\varepsilon ^{1 - \beta /2} \sin \varphi.\end{equation}
Introducing slow time  $\tau =t\varepsilon ^{1-\beta /2}$, we obtain
 \begin{equation} \frac{{\textrm{d} \tilde I}}{{\textrm{d} \tau }} ={-} \sqrt {\frac{{2\tilde I\varOmega_\textrm{ce} }}{{m_e c^2 }}} \frac{{eB_0 }}{{k\gamma }}\sin \varphi ,\quad \frac{{\textrm{d} \varphi }}{{\textrm{d} \tau }} = \frac{{k^2 }}{{\gamma m_e }}( {\tilde I - \tilde I_R } )\varepsilon ^{3\beta /2 - 1} + \sqrt {\frac{{\varOmega_\textrm{ce} }}{{2\tilde Im_e c^2 }}} \frac{{eB_0 }}{{k\gamma }}\sin \varphi.\end{equation}
Thus, for  $\beta =2/3$ (A 4a,b) lose the small parameter, and
 $\tilde {I},\varphi$ would change with the same rate. Then the applicability of equations of the phase bunching theory breaks, and a new model for
 $\varDelta I$ (or
 $\varDelta \gamma , \varDelta I_x$) is required. Here
 $\beta =2/3$ gives the threshold value for
 $I_x\sim I\sim (B_w/B_0)^{\beta }$.
Appendix B
Figure 8 shows that there are certain domains in the energy/pitch-angle space where electrons resonate with whistler wave nonlinearly. Thus, simulation of resonant electron dynamics should be within these domains. Figure 14(b) shows the largest domain that cover all energies and pitch-angles where electrons experience phase bunching. The phase bunching results in energy/pitch-angle change and electron drifts within the domain. An important property of the domain boundary is that  $\varDelta _\textrm {scat}\gamma$ tends there to zero as
 $\sim (I-I_{boundary})^{4/3}$ where
 $I$ and
 $I_{boundary}$ are values of moment and its boundary value (Artemyev et al. Reference Artemyev, Neishtadt and Vasiliev2019a), i.e.
 $\varDelta \gamma$ drops to zero at the domain boundary and no particles should leave this domain (in absence of diffusion that is characterized by a finite diffusion coefficient within the entire energy/pitch-angle space). As
 $\varDelta _\textrm {scat}\gamma$ has been derived numerically, there are possible fluctuations making
 $\varDelta _\textrm {scat}\gamma$ finite at the boundary. Thus, distribution
 $\varDelta \gamma (E,\alpha _\textrm {eq})$ should be corrected to set
 $\varDelta _\textrm {scat}\gamma =0$ at the domain boundary. Moreover, if during the simulation resonant electrons escape from the domain of phase bunching (e.g. because of numerical effects), these electrons should be returned into the domain (e.g. reflecting them back from the boundary on the same
 $\varDelta _\textrm {scat}\gamma$). Note that this procedure is required only in the absence of particle diffusion.Footnote 1
Domains in energy/pitch-angle space with: positive probability of trapping (a), a finite phase bunching energy/pitch-angle change (b), positions of release from the trapping (c). Red curve shows boundary of panel (b) domain.

The domain of a finite trapping probability is smaller than the bunching domain (see figure 14a). Again, the probability of trapping tends to zero at the phase bunching domain boundary as  $\varPi \sim (I-I_{boundary})^{1/3}$ (Artemyev et al. Reference Artemyev, Neishtadt and Vasiliev2019a), and
 $\varPi$ should be set equal to zero on this boundary even if numerical fluctuations of
 $\varPi$ evaluation give some finite value. Of course, there are no regions with
 $\varPi >0$ outside the phase bunching domain.
Release of trapped electrons from the resonance also should be within the phase bunching domain (see figure 14c). Numerical errors put some release locations outside this domain; the trapping variation  $\varDelta _\textrm {trap}\gamma$ should be corrected to move the release locations within the domain. This guarantees that for each energy/pitch-angle within the phase bunching domain we would have incoming and outgoing phase space flows.