Implications
An accurate profile of a livestock breeding sector is important in informing decision making regarding the potential for adoption of new genetic technologies and the monitoring of genetic resources. The structure described in this study provides previously unknown data for use in modelling the effects of, for example, the implementation of genomic selection in the UK beef breeding industry. This paper also suggests a protocol for interpretation of existing cattle information sources and proposes adjustments to the national cattle recording database to further increase its value as a research and monitoring tool.
Introduction
The United Kingdom has a long-standing tradition of beef breeding. Once considered ‘the stock yard of the world’ (Gibbs et al., Reference Gibbs, Holloway, Gilna and Morris2009) and a leading exporter of seedstock cattle during the first half of the 20th century (Hall and Clutton-Brock, Reference Hall and Clutton-Brock1989), the UK's beef breeding sector has recently undergone much upheaval. Serious disease epidemics such as bovine spongiform encephalopathy (BSE), volatile meat prices and the introduction of the single farm payment have made for a turbulent period for British beef cattle breeders (Lowman, Reference Lowman1998; Riddell, Reference Riddell2005). On the positive side, the 1990s also saw the introduction of bet linear unbiased prediction (BLUP)-based genetic evaluation, which has given breeders a powerful and objective tool to aid genetic improvement (Amer et al., Reference Amer, Crump and Simm1998). Correspondingly, the rate of genetic gain in key traits has seen an increase since the implementation of BLUP (Amer et al., Reference Amer, Niewhof, Pollott, Roughsedge, Connington and Simm2007). Nevertheless, in 2010, beef production remains a secondary enterprise on many farm holdings (Lowman, Reference Lowman1998; Defra, 2008a), with an average herd size of just 28, and profitability is largely dependant on subsidy support (Riddell, Reference Riddell2005; Defra, 2008b).
The UK beef industry now has the possibility of implementing new technologies in cattle breeding, such as genomic selection, which could have the potential to increase the commercial viability of the sector (Bishop and Woolliams, Reference Bishop and Woolliams2004). Investigating the breeding structure of the industry is therefore an important part of evaluating the possible merits of such new breeding tools in a UK context.
Pedigree breeding
Elite beef cattle breeding in the United Kingdom has historically been the domain of pedigree breeders, who registered cattle within the appropriate breed herdbooks. This breeding model has remained relatively constant over time, with a small number of ‘bull breeding’ herds driving much of the selection within particular breeds (Ozkutuk and Bichard, Reference Ozkutuk and Bichard1977; Allen, Reference Allen1990). Artificial insemination (AI) has more recently facilitated the wider dissemination of genes from the most popular bulls within these herds (Keeble, Reference Keeble2004).
In contrast, breed use has changed dramatically in recent decades. The 1960s and 1970s saw the importation of European beef breeds such as Charolais, Limousin and Simmental (Hall and Clutton-Brock, Reference Hall and Clutton-Brock1989). Up until then, only native British beef breeds were in use. In 1968/1969, Hereford and Aberdeen Angus bulls accounted for 61% and 18%, respectively, of beef breeding bull licenses issued by the Ministry of Agriculture (a practice no longer undertaken), with the Charolais (the only non-native breed in use) accounting for less than 1% of bull licenses at this time (Craven and Kilkenny, Reference Craven and Kilkenny1976). These breeds were targeted in the search for new genetics that could produce faster-growing and later-maturing cattle, in order to meet consumer demand for leaner beef (Allen, Reference Allen1990); their introduction effectively constituted the onset of an industry-wide breed substitution event. Their importation was subject to the formation of UK herdbooks, and thus these new breeds were assimilated into the traditional breeding framework (Edwards et al., Reference Edwards, Jobst, Hodges, Leyburn, O'Connor, Macdonald, Smith and Wood1966; MAFF, 1977). Such was their popularity that, by the 1980s, they had largely usurped the traditional British breeds in UK beef production systems (Allen, Reference Allen1990; Meat and Livestock Corporation (MLC), 1990; Pullar, Reference Pullar1998).
Commercial cross-breeding
Bulls from pedigree herds have traditionally been used to mate with cross-bred ‘suckler’ females (Lowman, Reference Lowman1997) to produce slaughter animals. Suckler females are those that rear their calf through to weaning, compared with dairy cows that have their calf removed within 48 h for artificial rearing.
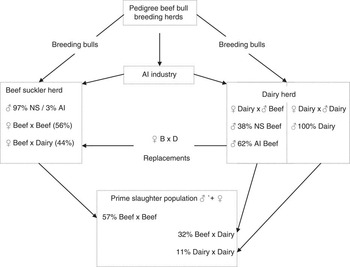
The UK suckler herd has, by international standards, an uncommon breeding structure, with large numbers of replacement suckler females sourced from beef cross-breds born in dairy herds (Lowman, Reference Lowman1997). These cross-breds are mostly a by-product of dairy farmers making matings in excess of replacement needs to beef bulls in order to increase the value of by-product calves (Southgate et al., Reference Southgate, Cook and Kempster1982; Simm, Reference Simm1998). This beef × dairy mating strategy was seen as a complementary mating of a dairy cow with reasonable beefing qualities to a more specialised beef terminal sire (Southgate et al., Reference Southgate, Cook and Kempster1982). Thus, the adoption of cross-breeding in the suckler herd was born as much by opportunism over the availability of dairy cross-breds with advantageous additive genetic qualities as any particular drive to impart hybrid vigour into suckler beef breeding systems (Lowman, B.G., personal communication, 2010). The quantitative map of the gene flow of genetics from the dairy herd into the beef herd is summarised in Figure 1 (this figure also contains results that will be discussed later in the paper), demonstrating the interplay between the dairy and beef herds in UK prime beef production. Throughout the following text, genetic groups such as beef, dairy and their crosses will make use of abbreviations B, D and combinations such as B × D. Here B × D refers to an animal that has a beef sire and a dairy maternal grand sire (MGS) and other crosses are defined analogously. In this context, the suckler herd is defined as a B × B and B × D breeding females, and the dairy herd as D × D breeding females.
Overview of the gene flow in the UK beef population highlighting proportions of natural service (NS) and artificial insemination (AI), as well as proportions of beef (B) × dairy (D) suckler females, and proportions of beef and dairy in the prime slaughter population (based on sire and maternal grandsire from 2007/2008 British Cattle Movement Service/Scottish Agricultural College).

Prime beef
The main aim of the UK beef industry is to produce the ‘prime’ animal. Traditionally, this referred to an animal slaughtered at approximately less than 3 years of age. However, the UK BSE epidemic of the 1990s saw the introduction of a specific age at slaughter restriction of 30 months or less, with meat from cattle aged over 30 months at slaughter banned from entering the human food chain between 1996 and 2006 (Defra, 2006). The prime animal thus became rigidly defined as one aged up to 30 months of age at slaughter. Even after the removal of over 30-month restrictions, a significant market premium remains for carcasses from under 31-month cattle.
Genetic evaluation
In the absence of dedicated large-scale beef cattle breeding companies, a partnership between breed societies and MLC/Signet facilitated the implementation of a BLUP-based genetic evaluation in pedigree herds. Agricultural Business Research Institute (ABRI) from Australia now also provides this service to some UK-based breed societies. Genetic links from common ancestors across pedigree herds have allowed the calculation of BLUP-estimated breeding values (EBV) that are comparable across the whole breed. These links were largely achieved through the relatively high use of AI in pedigree herds (compared with commercial suckler herds), which remains at around 25% in the Limousin breed, for example (Keeble, Reference Keeble2004). Selection of terminal sires is driven largely by lean meat yield traits, such as growth rate, muscling and fat depth. Although the Signet Beef Value selection index is a good predictor of grading under the European Union beef carcass classification system (EUROP; Simm, Reference Simm1998), genetic correlations with calving and maternal traits tend to be negative. Eriksson et al. (Reference Eriksson, Nasholm, Johansson and Philipson2004) found higher EUROP carcass conformation to be negatively correlated with calving ease, whereas Roughsedge et al. (Reference Roughsedge, Amer, Thompson and Simm2005) found that higher 400-day weight was negatively correlated with age at first calving.
Furthermore, every major UK beef breed has seen a deterioration in genetic trends for calving ease since evaluation of this trait was first introduced in 1997 (BASCO, 2010; Breedplan, 2010). This evidence for terminal and maternal/calving selection goals being antagonistic in beef cattle breeding makes selection for dual-purpose goals more problematic without careful use of economic selection index methodology. Therefore, the preferential selection for terminal beef traits has seen deterioration in calving traits in all recorded pedigree beef breeds. In order to address this issue, certain breeds have incorporated calving traits into global selection indices. The genetic gain in growth and carcass traits has, however, been modest in comparison with other livestock species with more intensive production systems (Simm et al., Reference Simm, Bünger, Villanueva and Hill2004).
Although the introduction of EBV technology in the United Kingdom in the mid-1990s has seen an improvement in the rate of gain in certain traits in elite pedigree populations, there has been no objective study on the influence of improved genetics on commercial bull-buying decisions.
The combination of a somewhat marginalised, economically volatile sector with a traditional structure is also reflected in the low volume of research that has taken place, resulting in relatively poor knowledge of basic industry statistics. Application of new technologies such as genomic selection will rely on accurate predictions of potential benefits in order to gain acceptance and funding for their implementation. The uncommon breeding structure described above infers that the pathway to implementation will be different from that of other beef breeding countries. The objective of this study was therefore to produce an extensive profile of the UK's beef breeding sector using existing information sources, in terms of breed composition, genetic resource use and commercial uptake of EBV technology. Such a profile could provide the groundwork for evaluation of the potential benefits of genomic selection.
Method
An important source of data, the British Cattle Movement Service (BCMS), was established in 1996, in the wake of the BSE crisis, to trace cattle births, deaths and movements using CTS (the Cattle Tracing System). In this study, the data were obtained from the Scottish Agricultural College's (SAC) restricted version, which will be referred to as BCMS/SAC in this report. This study used all BCMS/SAC records for cattle in Great Britain (GB; comprising England, Wales and Scotland), whose death was recorded by BCMS between 1996 and 2008 inclusive, and extracted the following data for each animal: UK registration number, sex, year of birth, age at death in months, breed code, dam identification and maternal breed code.
Defra farm surveys and slaughter censuses
Information from Defra censuses and slaughter surveys was used to triangulate with the BCMS/SAC records so as to enable a cross-referenced UK breed composition profile to be established. The Defra cattle census was collated annually from UK regional agricultural surveys until 2004. After this date, English and Welsh data were obtained from the BCMS records, but Scottish and Northern Irish data continued to be based on their respective agricultural surveys. As such, pre- and post-2004 survey results were not necessarily directly comparable. Furthermore, the level of detail in English and Welsh surveys was reduced; for example, mature bull numbers were omitted, which are important to this study. Therefore, only pre-2004 cattle survey numbers were used in this study.
Reconciliation of BCMS/SAC and Defra farm surveys and slaughter censuses
Owing to the nature of the BCMS/SAC data and the availability of Defra slaughter records, the most reliable starting point for the industry profile was the prime slaughter population, which yielded a relatively representative data set to establish breed proportions. As BCMS/SAC records were of dead animals, the GB slaughter population was completely represented in this data set.
Defra slaughter surveys, compiled monthly from UK slaughterhouses, recorded prime cattle in three categories only – bulls, steers or heifers – and recorded adult cattle in two categories only – cows and bulls. Thus, no breed information was included in these statistics, and in order to establish the genetic make-up of these cattle the BCMS/SAC records were analysed to determine breed composition. As BCMS/SAC covers only GB, and Defra surveys cover the entire United Kingdom, which is GB plus Northern Ireland (NI), and the proportions of beef and dairy cattle differs between GB and NI, an adjustment was necessary to reconcile these data. According to the 2003 Defra census, 50.7% of NI breeding cattle were in the beef herd compared with 43.6% in GB. Given that 15% of the total 2003 UK breeding cattle population was in NI, the UK total beef proportion was 44.6%. The BCMS/SAC proportion of prime cattle with dairy dams was therefore reduced by a factor of 0.98 (43.6/44.6).
A further adjustment to the BCMS/SAC proportion of prime cattle with dairy dams was needed, owing to the fact that a prime animal record including breed of dam would only appear if the dam's death had also been recorded by 2008. BCMS/SAC only included records of animals registered as dead in BCMS and each individual animal record only included the animal identification number of its dam and no other information such as breed code. Therefore, only 755 000 (out of a total of 1.7 million) animals whose dam was also recorded as dead in BCMS were included in the prime slaughter analysis. It was therefore important to adjust any bias in this sample, which could have led to an overrepresentation of a particular breed or group of breeds. Given that the most critical longevity differences are between cows producing in dairy or beef herds, rather than between breeds in the beef herd, there was a need for adjustment between beef and dairy but not between individual beef breeds. This was achieved by a further search of BCMS/SAC, identifying the subset of records that included the dam. These records were scaled to the Defra slaughter totals, using BCMS/SAC to provide breed proportions, and to estimate the number of prime cattle originating from the national beef and dairy herds, respectively. A conditional probability calculation, using animals registered as dead in 2008 at in BCMS/SAC, showed that dairy breed-coded females of calving age were 1.29 times as likely to be dead within the lifespan of an average prime animal as beef breed-coded females of calving age (see Appendix 1). The proportion of prime cattle records with dairy dams was reduced accordingly.
Interpretation of breed coding in BCMS
For the purposes of this study, it was assumed that an animal's breed code, as it appeared in BCMS/SAC, referred to the breed of its sire. The Cattle Book (Defra, 2008b), for example, describes the cattle breed field in BCMS as ‘usually based on the breed of sire’. However, this protocol was not explicitly stated in BCMS literature (Cattle Keepers Handbook, 2009). If the animals’ breed code contained an X (denoting a cross-breed), it was assumed that this referred to the animal itself being cross-bred, rather than its sire. Therefore, an LIMX-coded animal was presumed to be the product of the mating between a pure-bred Limousin bull and any dam other than a pure-bred Limousin. Breed coding was inconsistent before 2000, and to a lesser extent post 2000, in BCMS. For example, Limousin cattle appear to have been coded in six different ways (excluding crosses) up until 2000 (Lim, Lm, Li, L, LimB and LimR). As such, pure-breed numbers in pre-2000-born animals in this study reflect the amalgamation of such codes for each breed. As this was primarily a beef breed study, all Holstein or Friesian cattle (and variants such as British Friesian) were classed as Holstein/Friesian. It was also assumed that dairy-sired females were not used as suckler cows in the beef breeding herd. Blonde d'Aquitaine and Belgian Blue breed societies have now renamed themselves as British Blonde and British Blue, respectively. For the purposes of this paper, the original names will be used as the majority of animals of these breeds in the data set were born before these changes.
Breed codes were also not necessarily a good indicator of pure- or cross-bred status. For instance, only 38% of animals coded AA (Angus pure-breed code) in the data born since 2000 and dead by 2008 actually had dams coded AA; 11% were coded AAX (Angus cross-breed code) with 51% of dams having a variety of other (non-angus) breed codes. This was not an issue exclusive to AA, with only 43% of animals coded CH having dams also coded CH, 8% coded CHX and the remaining having a variety of other codes. This coding pattern confirms the assertion that animals are coded by sire breed rather than the breed make-up of the animal itself.
The approximate genetic make-up of animals was therefore calculated by using their sire and MGS breed codes. These sires were assumed to be pure-bred, as per the literature (Penny et al., Reference Penny, Faulkner, Boreland, Doyle, Wilson, Gibson and Ballard2001; Todd, Reference Todd2007). For example, an animal coded CH or CHX, with a dam coded LIM or LIMX was interpreted as being 50% Charolais and 25% Limousin, with the other 25% unknown. This remaining 25%, effectively the genetic make-up of the maternal grand dam (MGD), could not be calculated from BCMS/SAC because of very low numbers of animal records in BCMS/SAC with maternal great grand sire breed codes. In summary, BCMS/SAC provided an extensive profile of the sire and MGS breeds for the prime slaughter and adult breeding populations, constituting 75% of the animal's genetic make-up. To overcome this problem, the remaining 25% was estimated according to Appendix 2, which calculated the overall proportion of beef and dairy genetics in the respective populations.
Suckler cows
In estimating the breed proportions of suckler cows, no correction was made for survival of dairy-sired dams being less than beef-sired dams. Although Appendix 1 did show that beef dams live longer than their dairy counterparts, the average lifespan of the progeny in this case (the suckler cow) was much older (98 months in 2007 BCMS/SAC) and the pattern of death suggested that it was not necessary to correct for dairy dam survival.
The most common suckler cow genotypes (in terms of the animal and its dam's breed codes) were estimated from females with a beef sire aged over 30 months at death in 2007 in BCMS/SAC. No edit was carried out regarding pure-bred (and potentially pedigree) females as these could not be reliably separated in the data set, but will make up less than 5% of cows defined in this way. Again, similar breed codes were combined, including cross-breed codes (e.g. a LIMX × AAX was categorised with LIM × AA and referred to as a Limousin cross Angus). This search again yielded a reduced data sample in BCMS/SAC, with the same issue as in the prime slaughter animal study of the dam having to be recorded as dead in BCMS/SAC for the animal's record to appear. The assumption nevertheless was that this would still be a representative sample of suckler cows in 2007. These results were scaled to the beef breeding female population estimate from the 2006 Defra survey of 1.9 million head.
AI and NS (natural service)
Estimating the numbers of AI-sired animals in the beef and dairy herds was achieved using information from a commercial AI company (Genus PLC) and a UK Office of Fair Trading (OFT) report (Genus PLC, Crewe, UK, personal communication; OFT, 2004). OFT estimated that 3% of females in the beef herd were bred to AI. Given that the 2008 B × B prime slaughter population numbers 1.16 million (Table 1), around 35 000 of these would therefore have been AI sired, assuming that 1 calf is born from every 2.5 straws of semen sold (Genus PLC, Crewe, UK, personal communication). This would have required approximately 90 000 straws of beef semen, and from the total estimated annual beef semen market in the United Kingdom of 1.1 million straws this would have left 1 010 000 straws for use in the dairy, resulting in 404 000 beef AI-sired calves in that sector.
The 2008 prime slaughter population, categorized by beef (B) or dairy (D) type

GB = Great Britain; BCMS = British Cattle Movement Service; SAC = Scottish Agricultural College.
B×B ♂ represent males with a beef breed sire and a beef breed maternal grand sire.
D×D ♀ represent females with a dairy sire and a dairy maternal grand sire.
Prime animals were defined as those aged between 10 and 30 months inclusive at death.
aUnadjusted 2008 BCMS/SAC data.
b2008 BCMS/SAC data adjusted for Northern Ireland and dairy dams.
NS breeding bull numbers and breed proportions were estimated from a combination of: the Defra slaughter census, Defra farm surveys, AI statistics and BCMS/SAC males aged over 47 months at death, with identical sire and MGS breed codes (e.g. CH animal and CH dam or SM animal and SM dam). All cross-breds (23% of records) were removed from the data, as it was considered that the proportion of cross-bred breeding males in the national cattle herd was less than 1% (Penny et al., Reference Penny, Faulkner, Boreland, Doyle, Wilson, Gibson and Ballard2001; Todd, Reference Todd2007). The over 47 months criteria, rather than over 30 months, were used to estimate breed proportions, because of the phenomenon of a small percentage of animals intended for beef (almost certainly male castrates) being culled at over 30 months of age, probably in error rather than by design. Although these over 30-month culls represent a small proportion of prime culls, they are enough to confound the relatively small numbers of adult breeding bulls dying each year. To triangulate and provide additional information, these BCMS/SAC over 47-month breed proportions were also compared with BCMS annual registration data (published for the top five breeds by the British Limousin Cattle Society, BLCS) and estimates of AI-sired calves from industry statistics (Genus PLC, personal communication) to estimate total breeding bull numbers according to varying cow to bull mating ratios. Estimating numbers of breeding bulls aged under 31 months at death was not feasible using BCMS/SAC, given that not all males with identical sire and MGS pure-breed codes would necessarily have been destined for breeding purposes. As mentioned above, in order to estimate breeding bull numbers, a survival probability was calculated from bulls aged over 30 months at death, from the top seven beef breeds with deaths recorded in 2008. This provided a lifespan pattern for breeding bulls with which to estimate the numbers of bulls alive in the population at any one time, and importantly the numbers entering service annually. The survival probabilities for breeding bulls aged between 18 and 42 months were obtained from McGowan (Reference McGowan2006) and Todd (Reference Todd2007), as breeding bulls and male castrates in this age range could not be reliably separated in BCMS/SAC.
Pedigree
In order to establish whether potential breeding males within BCMS/SAC were pedigree, the BCMS records of Belgian Blue, Charolais and Limousin males were cross-checked against information in the publically accessible genetic evaluation databases, BASCO and Breedplan. Estimates of pedigree cattle numbers were based on records of cattle born after 2000, because in 2000 all UK registration numbers were standardised and changed to a numeric format (BCMS, 2009). Cross-referencing registration numbers of cattle born before 2000 was found to be unreliable because of differences in formatting between BCMS and BASCO/Breedplan records, as well as inconsistency in formatting within BCMS itself.
Relationship between sale prices and terminal selection index of breeding bulls
As an indication of the use of selection indices by bull buyers, the sale price of pedigree bulls of the four top breeds numerically sold at official 2009/2010 breed sales was correlated with the Limousin Beef Value index (for Limousin) and the Terminal Sire Index for Angus, Charolais and Simmental.
Results and discussion
Prime slaughter population
In total, 2 018 563 cattle aged under 31 months at death were recorded as having died in Great Britain in 2008 BCMS/SAC. Of these, 89% or 1.80 million died between 10 and 30 months of age, reflective of prime slaughter ages. This compares with 1.72 million animals in the collated Defra GB slaughter statistics for 2008, which is 4.3% lower and consistent with expected mortality levels in beef rearing systems (SAC, 2009), as slaughter statistics do not include on-farm deaths. Given that Defra slaughter statistics suggests that 18% of the total UK prime slaughter cattle are born in NI, scaling for this, the estimated UK prime slaughter population total would have been 2.12 million (2 018 563 × 0.89 × 1.18).
Table 1 shows a breakdown of this 2008 prime slaughter population by herd of origin. Here, beef × beef animals were born in the suckler herd, whereas beef × dairy and dairy × dairy were born in the dairy herd. Holstein/Friesian accounted for 95% of dairy breed codes in BCMS/SAC. From this information, the proportions of genetics coming from NS beef bulls, AI beef bulls and dairy bulls in the prime beef population was estimated using Appendix 2. Assuming equal use of NS- and AI-sired beef × dairy replacement females, the relative genetic proportions were estimated as: 47.8% NS beef, 16.6% AI beef and 35.6% dairy. Therefore, the prime slaughter population was composed of 64% beef and 36% dairy genetics.
It should be noted that the proportion of dairy genetics in this population is heavily reliant on the numbers of dairy-sired bull calves actually reared to prime slaughter, given the high rates of slaughter of these calves at birth. Typically, only 50% of dairy-sired calves have been reared beyond birth in the last 5 years (Beyond Calf Exports Stakeholders, 2010).
Prime breed composition
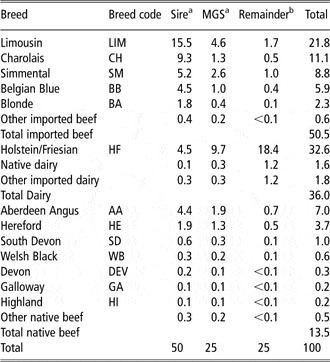
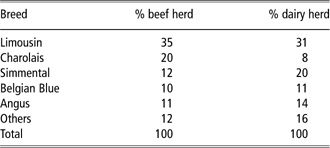
Recently imported European breeds contribute the majority (around 50.5%) of all the genetics in this prime slaughter population, with ‘native’ British breeds contributing less than 14% (Table 2). Limousin is the most influential beef breed in the United Kingdom with just over a fifth of the genetic contribution to the prime slaughter population. The top seven beef breeds include two British breeds and combined account for 61% of the total genetics and 94% of the beef contribution. These are the only breeds that are used on a nationwide basis in the United Kingdom, and are also those beef breeds with significant sales for UK AI companies (Genus PLC, 2010, personal communication). The relative use of the most popular beef sire breeds in the beef and dairy sectors is shown in Table 3, with Limousin, Belgian Blue and Angus being equally popular across beef and dairy herds. Charolais, by contrast, is much more heavily used in the beef herd.
Breed genetic contribution to the 2008 prime slaughter population

BCMS = British Cattle Movement Service; SAC = Scottish Agricultural College; MGD = maternal grand dam; MGS = maternal grand sire.
aFigures calculated from BCMS/SAC. Contributions were adjusted according to beef or dairy dam survival probability.
bEstimated remaining 25% of genes, made up of the MGD. This could not be calculated from BCMS/SAC. The Holstein/Friesian proportion was therefore estimated according to Appendix 2, which calculated that 36% of the genes in this population were from dairy breeds, and that Holstein/Friesian makes up 95% of the dairy contribution. The remaining MGD contribution was then assigned pro rata to the beef breeds as per their MGS proportions.
A comparison of the beef breed sire use (natural service plus artificial insemination) in beef and dairy herds (estimated from the 2008 prime slaughter population)
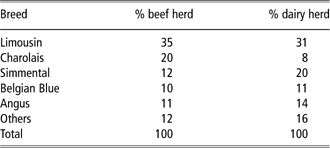
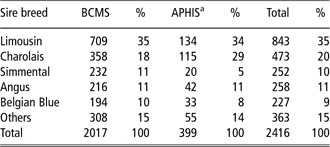
The differences between breed contributions in GB and NI are shown in Table 4, with notably greater use of Charolais in this latter region. However, as shown in Table 4, combining NI with the GB data set only increases the overall sire contribution of Charolais by 2% whilst increasing Simmental and reducing Belgian Blue by 1% each. Therefore, in terms of breed use, BCMS was reasonably representative of the United Kingdom as a whole, and introduced only a small bias. The BCMS annual registration data shown in Table 4 can also be used to assess trends in breed use. Sensitivity over years was tested by extracting 2005, 2006 and 2007 BCMS/SAC data, with no major differences found in breed proportions. Similarly, 2008 BCMS birth registration data suggest only minor changes from 2005, with Limousin, Simmental and Belgian Blue identical and with Charolais 16% (down 2%) and Angus 13% (up 2%), (BLCS, 2006 and 2009).
Births registered by beef sire breed in 2005 in BCMS (Great Britain) and APHIS (Northern Ireland) reproduced the 2006 BLCS studbook and factfinder (BLCS, 2006; '000s)

BCMS = British Cattle Movement Service; APHIS = Animal and Public Health Information System; BLCS = British Limousin Cattle Society.
aAPHIS is the Northern Ireland equivalent of the Cattle Tracing Scheme.
In the last 40 years, breed use in the UK beef herd has therefore changed dramatically, to the extent that around 75% of beef genes in the prime slaughter population are non-native. The Aberdeen Angus is the one native breed to have maintained a significant market share of beef genetics, in comparison with 1970s bull license data (Craven and Kilkenny, Reference Craven and Kilkenny1976), yet even the influence of this breed has halved within the above timescale.
Suckler female population
Overall estimates of the total UK female breeding herd in 2006 were provided by Defra census information. These suggested that there were 1.9 million beef females (cows plus in calf heifers) and 2.4 million dairy females (cows plus in calf heifers). The estimated numbers of B × B males and females slaughtered (Table 1) indicated that approximately 134 000 (647 000 minus 513 000) females were retained within the suckler herd for breeding in 2008. Similarly, the numbers of B × D males and females suggested that 106 000 beef-sired females from the dairy herd were kept as replacement suckler cows in 2008. Therefore, 44% of replacement suckler breeding females came from the dairy herd in 2008.
Breed composition of suckler females
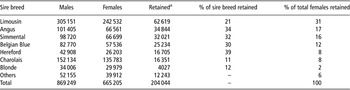
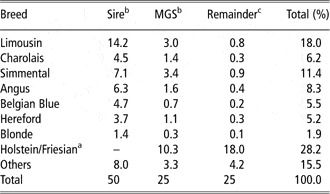
Females retained within the suckler herd per breed of sire are shown in Table 5, with 94% of these sired by the top seven breeds identified previously. The breed contributions to replacement suckler females (Table 6) show a similar pattern to the prime slaughter animals, with slightly more Angus and Hereford influence. Commonly regarded as the most extreme terminal beef breed, the Belgian Blue actually has similar contributions to both prime slaughter and replacements. In contrast, the Charolais influence is halved in the suckler female group. This is reflective of the high use of Belgian Blue AI in the dairy herd, and consequent availability of Belgian Blue × dairy females, as well as the positive contribution to suckler carcass traits of the Belgian Blue. Indeed, these two breeds were at opposite extremes in terms of their pattern of use, with Belgian Blue being largely an AI breed with relatively low levels of NS, and Charolais being largely an NS breed with low AI use. The 10.3% Holstein/Friesian MGS contribution to suckler females is consistent (10.3/25/0.95 = 43.4%) with approximately 44% of suckler cows being born in the dairy herd in Table 1. Altogether, 94.3% of these 2007 suckler females were cross-bred (as defined by those without two matching sire and grand sire pure-breed codes).
Estimated numbers of females retained for suckler breeding, by sire breed from the 2008 prime slaughter population in BCMS/SAC, percentages retained of each sire breed and of total females

BCMS = British Cattle Movement Service; SAC = Scottish Agricultural College.
aRetained = males minus females and assumes a 50 : 50 ratio of males to females reared to slaughter age.
Breed genetic contributions to the 2007 suckler female population

MGS = maternal grand sire; BCMS = British Cattle Movement Service; SAC = Scottish Agricultural College; MGD = maternal grand dam.
aIt was assumed that no Holstein/Friesian sired (or other dairy breed) females were used as suckler cows.
bFigures calculated from beef-sired females aged >30 months at death in 2007 BCMS/SAC.
cEstimated remaining 25% of genes, made up of the MGDs which could not be calculated from BCMS/SAC. The Holstein/Friesian proportion was therefore estimated according to Appendix 2, which calculated that 29.7% of the genes in this population were from dairy breeds, and that Holstein/Friesian makes up 95% of the dairy contribution. The remaining MGD contribution was then assigned pro rata to the beef breeds as per their MGS proportions.
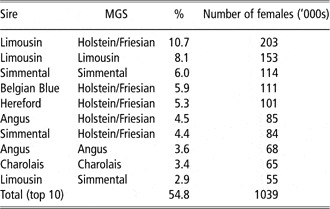
The most popular suckler cow genotypes are shown in Table 7, with a very diverse range of breed combinations present. Interestingly, the two most popular genotype groupings appear to be either first-generation crosses from the dairy herd or ‘three-quarter’-bred suckler beef replacements (with the same breed of sire and MGS). Although this table only includes 54% of sucklers, if there was wide-scale rotational cross-breeding in UK suckler herds, it would be expected to feature among the most popular genotypes. However, the most common rotational breed mix, Limousin × Simmental (which was the most common female with different beef breed sire and MGS) breed only accounts for 2.9% of total sucklers.
The 10 most common suckler cow genotypes in the United Kingdom estimated from 2007 BCMS/SAC

BCMS = British Cattle Movement Service; SAC = Scottish Agricultural College; MGS = maternal grand sire.
Breeding bulls
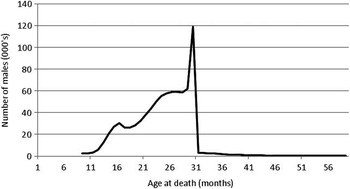
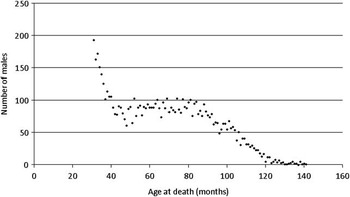
The assumption that very few cross-bred breeding bulls were in use and that cross-bred males aged over 30 months at death were actually castrates is supported by Figure 2, which shows a ‘spill over’ from the huge drop off in male slaughtering around the 30-month age limit. A more detailed view of male deaths, for animals with identical beef sire and MGD breed codes, in Figure 3, shows a dip in deaths around 47 months before resuming a temporary upward trend, which is consistent with the hypothesis that this profile is a mix of the distributions of slaughter and breeding males.
The pattern of male deaths for beef-sired males aged between 8 and 58 months at death inclusive in 2008.

The age at death profile of males aged over 30 months of age at death in 2008 with pure-bred sire and maternal grandsire from the top seven beef breeds.

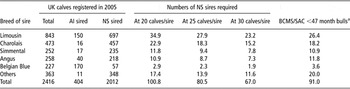
The 2004 Defra census reported 101 000 total breeding bulls in the United Kingdom (the last year for which this total is available; Defra, 2004). From dairy AI statistics (Genus PLC, personal communication), it was estimated that there were around 200 000 NS dairy calves in 2005. Assuming a conservative mating ratio of 20 calves per bull would suggest that around 10 000 NS dairy bulls were included in the Defra census total. Thus, the estimated NS beef bull population in 2006 was 91 000, and this figure was used in Tables 8 and 9 to further estimate numbers of bulls by breed. Table 8 shows the estimated numbers of NS bulls required to sire the approximate number of NS bred calves born in 2005. Three different calves/bull ratios are shown, depicting likely breeding ratios.
Numbers of beef-sired calves born in 2006 by AI and NS, and NS sires required to father them and estimated number of bulls in BCMS/SAC aged over 47 months at death (BLCS, 2006; 000's)

AI = artificial insemination; NS = natural service; BCMS = British Cattle Movement Service; SAC = Scottish Agricultural College.
aThis column gives an estimate of the numbers of the NS beef bulls present in 2006 by breed in the national cattle herd from an estimated total of 91 000 bulls in use, using breed proportions from males aged over 47 months at death in 2005 BCMS/SAC.
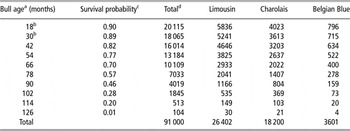
Age profile of NS beef breeding bulls in use in the national herd in 2006

NS = natural service; BCMS = British Cattle Movement Service; SAC = Scottish Agricultural College.
aBulls were assumed to enter breeding service in herds at an average age of 18 months.
bNumbers in years 1 and 2 have been adjusted to remove castrates according to literature estimates of breeding bull deaths in these years (McGowan, Reference McGowan2006; Todd, Reference Todd2007).
cSurvival probability derived from 2008 BCMS/SAC data for bulls aged <30 months at death, and refers to the probability of a bull surviving the following 12 months.
dIt was assumed that 91 000 bulls were in service in 2006.
Table 9 uses a survival pattern from beef bulls aged over 30 months at death, from the top seven breeds with two identical sire and MGS pure-breed codes recorded in BCMS/SAC as having died in 2008. The estimated average herd life of these bulls was 4.5 years with only minor between-breed differences. Therefore, assuming a total of 91 000 NS beef breeding bulls total translates to approximately 20 000 breeding bulls entering service each year. This is similar to the study by Amer et al. (Reference Amer, Niewhof, Pollott, Roughsedge, Connington and Simm2007), which estimated 19 346 beef sires purchased by commercial farmers each year. Further support for these estimates comes from Defra slaughter statistics that recorded 17 800 adult bull culls in 2008 and 19 600 in 2009 (Defra, 2010). Survival probabilities for 10 years of service are shown, as well as calculations for three individual breeds. Estimates of breeding bulls entering service each year (row 1) are in reasonable agreement with approximate annual pedigree registrations for 2008. For example, there were approximately 4000 Charolais males registered in 2008 (BCCS, 2009) and approximately 900 Belgian Blue (BBCS, 2009). Limousin registrations were somewhat higher than the figure in Table 9 at approximately 8000 (BLCS, 2009). The pedigree registration of a bull is not a guarantee that it will become a breeding animal. It is also likely that Limousins are popular with breeders maintaining closed beef production systems. Therefore, in the same way that large numbers of Holstein dairy cows are pedigreed without necessarily being elite breeding animals, a similar system may be used in some Limousin herds.
Sire identification
The proportion of prime animals with UK registration number sire identifications (id) included in their BCMS records varied from just 9% of Belgian Blue-sired animals up to 37% of Angus-sired animals, among the top seven beef breeds. The other five of the top seven beef breeds were all in the range between 21% and 28%. Approximately 1% of animals had other sire id variants such as breed, name of sire or tattoo numbers. No individual sire had more than 100 progeny in this data set, suggesting an absence of AI sire recording. As such, BCMS does not provide an unbiased sample of sire identification numbers. The lack of AI sire recording also explains the particularly low figure for Belgian Blue sire id, given that the vast majority of calves from this breed are AI bred (Table 8).
Influence of pedigree breeding
The extent to which the historical practice of registering pure-bred breeding males in pedigree herdbooks still exists was of major interest in characterising the UK breeding industry. This analysis again focused on males aged over 47 months at death as these were seen as the group that could most reliably be interpreted as breeding males. Sampling the first 100 Charolais males by date of birth (with CH sire and MGS breed codes), born in 2000 and aged over 47 months at death in BCMS/SAC, 84% were registered as pedigree males in the ABRI database. Similarly, 90% of the first 100 Belgian Blue coded BB (sire and MGS) males born in 2000 and aged over 47 months at death were recorded in the ABRI database as pedigree. Limousin numbers were slightly lower, with 76% of the first 100 Limousin coded LM (sire and MGS) males born in 2000 and aged over 47 months at death were recorded in the BASCO database as pedigree. These figures constitute a lower estimate given the formatting differences between BCMS and the pedigree databases. Cross-referencing BCMS/SAC with ABRI and BASCO therefore suggested that the majority of animals that could be reasonably expected to be breeding bulls (i.e. aged over 47months at death) were pedigree. It did appear, however, that there may be significant numbers of non-registered pure-bred bulls in use, perhaps as high as 24% in Limousin.
Investigation of males aged just over 30 months of age at death highlighted the problem of males reared for slaughter confounding the identification in BCMS/SAC of breeding males culled early in their reproductive careers. Taking all of the 2002-born Belgian Blue (coded BB; 39) and CH (75) males in BCMS/SAC aged 31 to 33 months at death, 49% of BB and 47% of CH were registered in the ABRI database as being pedigree, or had an imported identification number (suggesting imported breeding bulls). This adds further evidence to the suggestion that males culled at just over 30 months of age are a mixture of beef steers and breeding bulls (see also Figure 3).
Relationship between sale prices and terminal selection indices of breeding bulls
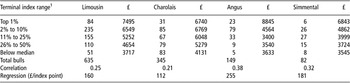
Correlations between sale prices of breeding bulls and terminal selection indices were significant (P < 0.01), but of a moderate strength (Table 10). Terminal index ranges in this table are presented in the standard industry format, although there are minor differences between the trait composition of the Signet Limousin Beef Value index and the ABRI Terminal indices of the other three breeds. The regressions suggest that there is greater value attached to bulls with higher index values. This analysis would suggest that genetic breeding values and recorded weights do play a part in purchasing decisions, although phenotypic selection remains a key element in bull-buying strategy in practice. Unlike the dairy sector, there are no formal structural soundness evaluations of pedigree beef cattle in the United Kingdom. It is therefore left to the judgement of the purchaser as to whether an animal is sufficiently sound to carry out its breeding roles, and deliver its genetic merit effectively.
Relationship between sale price and terminal index of young breeding bulls sold at official breed society sales in 2009/2010

1Terminal index refers to Limousin Beef Value and Charolais, Angus and Simmental terminal selection indices.
Utility of BCMS as a data source
The BCMS database provided valuable information regarding breed use in the national beef herd. Records of dead animals were particularly useful in investigating the prime slaughter population, and it was possible to make estimates of breeding animal numbers, which triangulated reasonably well with other information sources. Greater recording of sire identification numbers by BCMS users would considerably enhance the commercial and research potential of this information source. In addition, tighter adherence to breed-coding protocol would greatly improve the data quality, removing the need for user interpretation of actual breed. This issue can be overcome, at the cost of effort and accuracy, by taking into account the breed codes in the animals’ ancestry. In doing this, it is possible to interpret the data, and produce a more valid estimate of breed proportions and genetic influence. However, BCMS has the potential to become the database of choice for monitoring of UK cattle genetic resources, with only minor adjustments to animal-recording protocol.
Conclusion
This study has provided the first population-wide evidence of the breed composition of UK beef cattle. Cross-breeding has been shown to be the overwhelming approach in suckler herds, in sharp contrast to the dominance of pure-bred pedigree breeding in the selection of NS sires. Importantly, it has been established that dairy genes continue to play a large role in the beef herd. The opportunity now exists to use the information provided in this study to effectively inform decision making regarding the make-up of genomic training populations.
Acknowledgements
Funding for this study was provided by BBSRC and KTN Biosciences. The authors acknowledge BCMS for allowing access to data, and the staff of EGENES for help with data management. The authors also thank Arwell Owen and Nicola McDougall of Genus PLC and Dawn Teverson of EBLEX for provision of AI statistics and bull sale price/EBV information, respectively. They further thank Basil Lowman MBE, for advice on the UK beef industry, and Huw Jones and Peter Amer for constructive discussions.
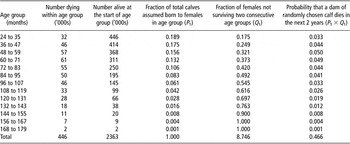
Appendix 1: Predicting the survival of beef- and dairy-sired dams
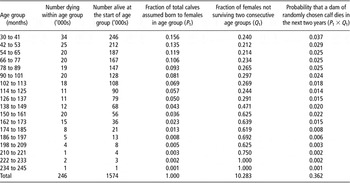
The objective is to calculate the probability that a randomly chosen calf has a dam that dies in the next 2 years. This calculation uses females recorded in British Cattle Movement Service (BCMS)/Scottish Agricultural College (SAC) as dying in 2008 and estimates the probability that a female will die within the average lifespan (24 months) of her prime slaughter progeny. It is assumed that a typical dairy-sired female first calves at 24 months of age and that the average beef-sired female at 30 months of age, and that there is a stable age distribution.
Example calculation from Table A1. The total dying from 24 to 179 months of age (2 363 000) equates to an estimate of the size of the breeding population, which is similar to the national dairy breeding female herd estimate (Defra, 2008b). All these will be assumed to first breed in the period 24 to 35 months of age, and therefore the number of breeding females in row 1 is equivalent to the annual replacement rate. Of these replacements, 32 000 die before the end of the age period, leaving 414 000 females to enter the next age. Therefore, the fraction of calves born in a population from 36- to 47-month-old females, P 1, is 414/2363 = 0.175. For a calf born to a 36- to 47-month-old female, the probability its dam dying in the next two periods, Q 1, is (46 + 57)/414 = 0.249.
Probability of a dairy-sired dam dying within the lifespan of her prime slaughter progeny, using dairy-sired females recorded as dying in 2008 in BCMS/SAC. A full description of this calculation is described below

BCMS = British Cattle Movement Service; SAC = Scottish Agricultural College.
Therefore, the sum of the product of (P 1 × Q 1) across all age periods is the probability that among calves born to dairy-sired cows, a dam of a randomly chosen calf dies in the next 2 years (0.466). The calculation in Table A2 follows a similar pattern to arrive at a probability among calves born to beef-sired cows, the probability that the dam of a randomly chosen calf dies in the next 2 years is 0.362.
Probability of a beef-sired dam dying within the lifespan of her prime slaughter progeny, using beef-sired females recorded as dying in 2008 in BCMS/SAC. A full description of this calculation is described in the text

BCMS = British Cattle Movement Service; SAC = Scottish Agricultural College.
Therefore, the dairy-sired dams were 1.29 (0.466/0.362) times as likely to die in the lifetime of their prime slaughter progeny as beef-sired dams.
Appendix 2: Genetic composition of the prime beef population
The breeding notation used in the following refers to the origin of the sire and the maternal grand sire (MGS), so that B × D is an animal with a beef sire and a dairy MGS. The prime slaughter population comprises offspring from B × B, B × D and D × D breeding females sired by beef and dairy bulls. It is assumed that dairy bulls are only used on D × D females. The term suckler herd refers to all the B × B and B × D females. Although BCMS/SAC provided breed information on the sire and MGS, the remaining 25% of the breed composition determined by the maternal grand dam (MGD) was required to be estimated. This was done using the gene flow diagram shown in Figure 1 and is explained below. The fraction of the genome deriving from beef bulls by natural service (NS) and artificial insemination (AI) was also considered, as this is related to the intensity of selection that is being practiced in the beef herd. This fraction was defined by tracing back the pedigree to male ancestors, so that a NS beef sire contributes 0.5 to the NS beef fraction, a NS beef MGS contributes 0.25 to the NS beef fraction, a NS beef sire to the MGD contributes 0.125 to the NS beef fraction and so on.
The calculation requires the following parameters that were obtained from BCMS/SAC, Office of Fair Trading (OFT, 2004) and Genus PLC (personal communication): S B = proportion of beef-sired calves from NS within the suckler herd = 0.97; S D = proportion of beef-sired calves from NS within the dairy herd = 0.38; P BB = proportion of breeding females in suckler herd that is B × B = 0.56; P BD = proportion of breeding females in suckler herd that is B × D = 1−P BB = 0.44; Q BB = proportion of prime slaughter population that are B × B = 0.57; Q BD = proportion of prime slaughter population that are B × D = 0.32; Q DD = proportion of prime slaughter population that are D × D = 1−Q BB−Q BD = 0.11. This is summarised by the gene flow in Figure 1.
Then the gene flow of beef genes via NS in the B × B female (P 1) is calculated by considering such a female as an offspring of a B × (B × B) mating and then as an offspring of a B × (B × D) mating to give  Solving for P 1 gives P 1=0.7316.
Similarly, the gene flow of beef genes via AI in the B × B female (P 2) is

Solving for P 2 gives P 2 = 0.1155.
The remaining fraction is 1−0.7316−0.1155 = 0.1529 and is gene flow from dairy breeds.
The gene flow of beef genes via NS to the prime slaughter population is then given by

where the first two terms concern the flow of beef NS genes via the sires and the second two terms concern the flow from the dams. Note that prime slaughter animals that are B × D only have gene flow via NS of beef sires from their sire only, whereas D × D animals have no gene flow from beef sires. Substituting the values gives 0.4776.
Similarly, the gene flow of beef genes via AI is given by

and substituting values shows this to be 0.1658. Consequently, in total beef breeds contribute 0.643 and dairy breeds 0.357 of the genes in the prime slaughter population.
The dairy MGD fraction is obtained by subtracting the fractions accounted for by dairy sires and dairy MGS. Dairy sires account for 0.5Q DD = 0.055 and dairy MGS account for 0.25 (Q BD + Q DD) = 0.108, leaving 0.194 of gene flow from dairy through MGD. Of this gene flow, a fraction 0.95 will be from Holstein/Friesian (the proportion of dairy breed codes that are Holstein/Friesian in BCMS/SAC), that is, a total gene flow of 0.184 from this breed to the prime slaughter population through MGD. The remaining dairy contribution of 0.010 through MGD will be from other dairy breeds and in Table A2 is included in ‘Other’ breeds, whereas the remaining contribution through MGD of 0.25−0.194 = 0.056 was then assigned pro rata to the beef breeds according to their MGS proportions.