

DISCUSSION POINTS
-
• If one agrees with the Brundtland definition of sustainable development that states that it is “development that meets the needs of the present without compromising the ability of future generations to meet their own needs,” how far into the future should we project?
-
• The Anthropocene is often defined as an “epoch that begins when human activities started to have a significant global impact on Earth's ecosystems.” With 7 billion people (October 2012) and growing, the changes in designation of our epoch to Anthropocene become inevitable and humans will officially become a dominant part of the “natural environment” with “verification and falsification” of any theory requiring full consideration of human behavior, no matter from which academic discipline we approach the issue. The investigators will become not only observers but part of the observed system. How will these changes affect the nature of scientific enquiry?
-
• What is the role of materials science in the mitigation and adaptation to anthropogenic climate change that results from our present energy use?
Background—physics & sustainability
The terms sustainability and environmental physics that appear in the title of this review need some explanation:
What is known as the Brundtland definition of sustainable development states that it is “development that meets the needs of the present without compromising the ability of future generations to meet their own needs”. Reference Johnston, Everard, Santillo and Robèrt1 In the two years that followed the Brundtland definition 140 alternative or modified definitions followed. Reference Johnston, Everard, Santillo and Robèrt1 The process is still ongoing.
I define sustainability Reference Tomkiewicz2 for this review as the condition that needs to be developed globally for humanity to flourish until technology develops for extraterrestrial travel that will allow migration to another planet once conditions here deteriorate.
-
• How long it will take us to develop technology that will allow migration to another planet is not that important—it will take a very long time that will require constant adjustments.
-
• How to do it?—to achieve the sustainable objectives on this time scale, we will have to establish equilibrium with the physical environment and at the same time maximize individual opportunities for every human on this planet.
I will argue here that the interdisciplinary nature of material science needs now to be expanded to take the form of a connecting link between its traditional foundations in physics, chemistry, and engineering to become the link between relevant parts of these disciplines and the human environment in which we live. This journal is a testimony that this process is starting to take shape and I will try to add my contribution to this process.
It is obvious that the scope that I have outlined is too broad to be discussed in a professional journal dedicated to the study of materials. The focus of this study is to narrow the discussion to anthropogenic climate change and to try to outline the consequences for material science.
Before doing so, I have to describe a central controversial aspect of the title that will have major consequences on the rest of the discussions—the issue is the anthropogenic part of climate change.
Neither I nor any other physicists who write about the physics of sustainability or environmental physics Reference Monteich and Unsworth3 represent Physics or the physics community. At least in the United States, the American Physics Institute (AIP) has a reasonable claim to this honor. The Material Research Society (MRS) is an affiliated member of the AIP and the AIP is the parent organization of the American Physical Society (APS). To the embarrassment of many of us, the issue of the anthropogenic component of climate change was recently (starting in 2007 and still continuing) a focus of a heated debate within the APS. As a partial consequence of this debate, in 2010 a new topical group was created named “Topical Group on the Physics of Climate” abbreviated as GPC. The byline of the new group is given in the footnotes. 4 Complete separation between “natural science” and the socioeconomics of the anthropogenic parts.
Doing so we are running into series problems in physics:
Scientists are defined today in terms of abiding by the scientific method which can be summarized as:
“The scientific process relies on the collection of observational evidence and the development, verification, and falsification of predictive theories.”
This quote is taken from Reference Watts5 an active participant in the APS debate that strongly argued for the separation of human contributions in the debate. The problem arises when “officially” the present epoch will be likely to be declared an Anthropocene. A fully qualified group is now discussing the issue. 6 The charge of the group is quoted in the footnotes. 6
With 7 billion people (October 2012) and growing, the changes in designation become inevitable and humans will officially become a dominant part of the “natural environment” with “verification and falsification” of any theory requiring full consideration of human behavior no matter from which academic discipline we approach the issue. In addition, since we are part of the system and since cosmology describes that there is only a narrow window Reference Frank and Sullivan7 of physical conditions in which we can survive, our future critically depends on our interactions with the physical environment not only for the purpose of being able to refute or confirm our theories but for our own ability to survive until we find a way to move to an alternative location.
The framework—Kaya–IPAT
I see this review as an extension of an earlier study that was written by Green et al. Reference Green, Espinal, Traversa and Amis8 to introduce the special issue of the MRS Bulletin special issue on “Materials for Sustainable Development” (obviously, the authors of that study might see it differently). The Green's study was written mainly to outline the overlap between material science and sustainability and map it on the content of the special issue. In this review, I will try to extend the concept beyond the search for sustainable materials, sustainability of materials, and recycling of materials to materials scientists working toward society's achievement of a sustainable planet.
One of the ways Green et al. Reference Green, Espinal, Traversa and Amis8 have introduced sustainability was through the Kaya identity. Reference Yamaji, Nagata and Kaya9,Reference Raupach, Marland, Ciais, Le Quere, Canadell, Klepper and Field10
The identity was introduced in the following form:
 $$F = P\left( {{G \over P}} \right)\left( {{E \over G}} \right)\left( {{F \over E}} \right)\quad ,$$
where F is the global carbon dioxide emissions, P is the global population, G is the sum of global gross domestic products, and E is the global energy usage.
In view of the central role that this identity, in all its forms, plays in assessing and defining sustainability, I will discuss this expression in some depth.
The Kaya identity has its roots in an earlier and more general identity that correlates socioeconomic parameters with environmental impacts. In this form the identity is known as the IPAT equation where I stands for impact, P stands for population, A stands for affluence, and T stands for technology. Reference Commoner and Ridker11,Reference Ehrlich and Holdren12 This identity takes the following form:
 $${\rm{I\ }} = {\rm{\ P\ }} \times {\rm{\ A\ }} \times {\rm{\ T}}\quad .$$
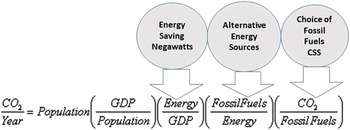
I am going to combine the two identities in Fig. 1 to clearly highlight the application to emission of carbon dioxide from burning of fossil fuels and the impact of energy intensive mitigation strategies.
The Kaya–IPAT expanded identity for carbon dioxide emission out of burning of fossil fuels (for details see main text).

The first two terms on the right quantify the socioeconomic terms while the last three terms describe aspects of energy use. The only two terms not self-evident in Fig. 1 are negawatts and CSS. Negawatts is an attractive term that indicates energy saving through the lowering of the energy intensity or “Negawatt power” is a theoretical unit of power representing an amount of energy (measured in watts) saved. 13 CSS stands for “Carbon Capture and Storage” that indicates that to keep the atmosphere clean of excess carbon dioxide one can use as much fossil fuels as one wishes as long as one captures the carbon dioxide and not let it be emitted to the atmosphere to act as greenhouse gas (GHG).
As was mentioned in Green's paper, Reference Green, Espinal, Traversa and Amis8 one of the essential features of this identity is that the predictions over a time span of the rest of this century are that the two socioeconomic terms continue to grow, with the affluence term to show more aggressive growth than the population term, so the only compensating strategy to keep the carbon dioxide from further growth is to reduce the three energy terms.
The Intergovernmental Panel on Climate Change (IPCC) 14 was created by the United Nations to review and assess the most recent scientific, technical, and socioeconomic information produced worldwide relevant to the understanding of climate change.
To achieve its charge, the IPCC does not conduct any research nor does it monitor climate related data or parameters. The IPCC is supposed to coordinate the data together with mitigation strategies and adaptation strategies that will protect us and future generations from the consequences of damage that humans inflict on the physical environment with focus on climate change. To accomplish its charge, the IPCC has to coordinate projections of future socioeconomic conditions and the climate sensitivity that will affect global climate change. The IPCC admits that they cannot do it. Instead, they coordinate scenario buildings and try to determine the likely impact of the various scenarios. The anchor to this methodology is the Kaya–IPAT identity.
The scenario building process is central to the understanding of the impact of climate change. It coordinates global climate modeling. The climate modeling efforts are not designed to try to predict future climate, they are designed to estimate the consequences of various socioeconomic scenarios. Prior to the last report 15 the details of the socioeconomic scenarios were part of the scenarios. 16 These include about 40 scenarios divided into four groups of which the impacts were calculated. The various scenarios were passive scenarios that did not include any policy actions that were designed to minimize the impact of GHGs. Impacts of policy initiatives such as carbon pricing, subsidies for alternative energy sources, or technological innovations that lead to higher efficiencies in energy use and energy conversions, were not included in the scenario building. Prior to the last report the methodology of constructing future scenarios that outlined the future climate change predictions has changed and the new scenario family is now called RCP (Representative Concentration Pathways). 17 A simple description of the history of scenario building is provided in the blog Skeptical Science. Reference Wayne18 The RCP scenario building separates the socioeconomic developments and the policy initiatives that are being taken to minimize GHG emissions from the emission scenarios that include four scenarios starting with “Business as Usual” scenario (RCP8.5) to “environmentally friendly” scenario that keeps the temperature rise at the end of the century to below 2 °C (RCP2.6). In the section “The goal” I will limit my discussion to the transitions from the “Business as Usual” to the “Environmentally Friendly” scenarios. The transition constitutes the required “Energy Transition” that needs to be achieved between now and the end of the century.
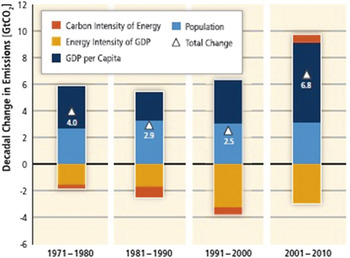
Figure 2, taken from the latest IPCC reports, shows the relative contributions of the four terms with the carbon intensity of energy defined as CO2/energy summarizing the last two energy terms. The balancing act of the socioeconomic terms with the energy terms is clearly visible, resulting in increased emission with the increased contributions from the socio–economic terms, dominated by the increased affluence of developing countries. The increase in emission associated with the first two terms of the equality is only partially compensated by the energy terms.
Decomposition of the change in total global CO2 emissions from fossil fuel combustion by decade through the four driving factors: population, income (GDP) per capita, energy intensity of GDP, and carbon intensity of energy (for explanation of the terms see the main text). 15

The goal
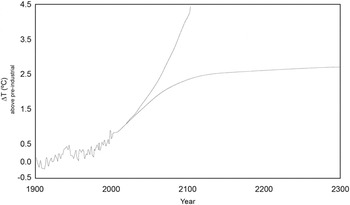
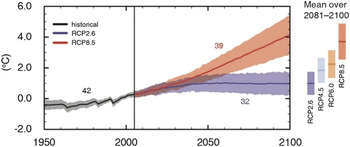
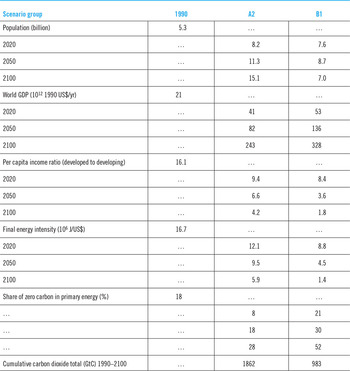
Figure 2 in the section “The framework—Kaya–IPAT”, emphasizes historic contributions to the global emission and energy use. According to most estimates, extrapolation from the past to the future will not work. The world needs a transition to noncarbon energy sources. The transition to the future is being quantified by the IPCC through scenario building—“what will happen if…? Figs. 3 and 4 and Table 1 show the details of the future projections based on two scenarios taken from the two groups of scenarios that were described in the section “The framework—Kaya–IPAT”.

Projected global temperature changes based on the most recent RCP8.5 (business as usual) and RCP2.6 (environmentally stable) scenarios. 15

Details of the SRES (Special report on emission scenarios) A2 (business as usual) and B1 (stabilization) scenarios. 16

The socioeconomic details that characterize the A2 and B1 scenarios shown in Fig. 3 are shown in Table 1 below.
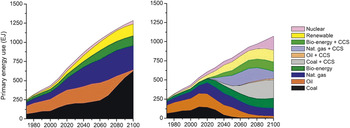
An example of the needed global effort in energy management designed to achieve stable atmospheric chemistry that will not change the sun–earth energy balance and thus require, major, irreversible climate change is shown in Fig. 5, with Carbon Capture and Sequestration (CCS) needed for what is considered to be a sustainable energy source such as bioenergy:
Possible trends in global energy use based on baseline and RCP2.6 scenarios. Reference Van Vuuren, Stehfest, den Elzen, Kram, van Vlient, Deetman, Isaac, Goldewijk, Hof, Beltran, Oostenrijk and van Ruijven20 (left figure shows baseline energy use scenario (RCP8.5—business as usual), figure on the right shows energy use scenario that will keep the rise in global temperature to below 2 °C (RCP2.6—stabilization).

As was mentioned in the section “The framework—Kaya–IPAT”, the changes from the SRES to the RCP scenarios were introduced mainly for the benefits of scientists, to make “reviewing and assessing” easier. In the process, SRES scenarios' close connections with socio–economic changes got lost in favor of a focus on the net impact on GHG emissions. Meanwhile, the number of evaluated scenarios changed: in both the SRES and the RCPs, there were four families, but the SRES included 40 scenarios, whereas the RCPs are defined in terms of only four different emission scenarios.
In terms of the above RCP8.5 scenario, which depicts an everlasting increase in temperature, the new focus makes very little difference. It basically shows the “business as usual” scenario or, using the new terminology: the “background scenario.” In all presentations, this is the scenario that we all start with; one extrapolated from the present with no change in the rates of growth, or the associated emissions.
The big difference is in showing how we are trying to get to where we want to be—the “environmentally stable” RCP2.6 scenario. Van Vuuren et al. Reference Van Vuuren, Stehfest, den Elzen, Kram, van Vlient, Deetman, Isaac, Goldewijk, Hof, Beltran, Oostenrijk and van Ruijven20 give a detailed account of the considerations behind this scenario. The SRES and RCP scenario families are both “what ifs” scenarios that are based on plugging possible socio–economic inputs into computers to calculate GHG emission consequences. The SRES scenario family represents passive scenarios, while the RCP family is constructed to include mitigation policies. It is obvious that the RCP2.6 requires much stronger mitigation policies compared to RCP8.5, which describes what will happen if we continue what we are doing now. To have any effect, mitigation policies require global agreement, and such an agreement is very hard to come by. In spite of the difficulties, there is a continuing global progress to close the gap between the two scenarios.
For this review I chose to compare the “business as usual” scenario with the RCP2.6—the most environmentally friendly scenario. The other two scenarios in this family, RCP4.5 and RCP6 also lead to stabilizations of the carbon dioxide levels but at higher levels that will lead to higher temperatures and considerably less opportunity for successful adaptation. Whichever scenario the world will choose to follow, the basic issue remains the same—how to achieve a zero net anthropogenic chemical changes of the atmosphere from our present practice of energy use that leads to the “business as usual” impact. Specifically, in terms of this review, what should be the role of material science in this transition?
Impact
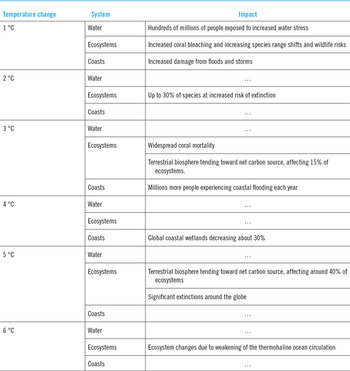
A possible impact of business as usual energy use scenario was shown in the body of Fig. 3 and in Table 2 that was taken from the same IPCC report. It shows clearly that the major impact of the various degrees of climate change comes through the changes inflicted on the global water cycle.
Examples of impacts associated with global temperature changes. 19 (Impact continuous increases with temperature; temperature change relative to 1980–1999).

To summarize the last few sections—most of the damage to the atmospheric chemistry that results in climate change is being inflicted through energy use while most of the impact is being inflicted through the water cycle. Mitigation of the damage requires energy transition to noncarbon sources while adaptation to the changes requires major changes in temperature management and water management. To put the challenge in Shakespearean terms—to do or not to do. The doing refers to efforts to mitigate the impact through minimization of the damage to the physical environment. If we don't do or don't do enough to mitigate the damage we will have to learn how to adapt to the damage.
Material Science has a major role both in our efforts to mitigate the impact of climate change and to adapt to the impact. The role of material science in adaptation to climate change should be a topic for a separate review. Here I will focus on mitigation through facilitation of the energy transition to noncarbonated sources.
Mitigation
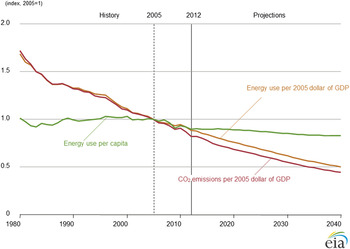
Figure 1, shows the IPAT identity for the CO2 impact with the needed mitigation steps that are required to minimize the energy use terms. The first term includes energy saving in the energy needed to generate the Gross Domestic Product (GDP) or reduction of the energy intensity. Lubomirsky and Cahen Reference Lubomirsky and Cahen21 have addressed the connection between energy use and material availability. Energy use is part of the Life Cycle Assessment (LCA) of materials and is one of the two main anchors of the Life Cycle Inventory (LCI) of this process (the other one is water). As a trend in both developed and developing countries, the energy intensity is improving. The US picture is shown in Fig. 6 with projections to mid-century.
Energy use per capita, energy use per dollar of GDP and emission per dollar of GDP, 1980–2040 (all three figures are normalized to 2005). 22

The reasons for the sharp drop over the years are a mixture of improved energy efficiencies and shift in the components of the GDP to less energy intensive activities. Material science had and is continuing to have central role in improving the efficiency of solar cell and much smaller role in improving the efficiency of other sustainable energy sources such as wind, nuclear, hydro, and biogas.
The second mitigation component is a global shift of energy sources away from fossil fuels.
All the RCP, aside from the business as usual, scenarios assume stabilization of GHG concentrations. The question is only at what level and at what degree of warming. Stabilization of the concentration requires that all the energy sources will not emit new GHG to the atmosphere. This requires zero emission by the energy sources or capture of the emission of energy sources that do emit. We do have the technologies to adopt both alternatives but there is general agreement that the transition will exceed the length of time of a human generation and be often painful (expensive and controversial). As was mentioned in the section “Impact”, the IPCC scenarios that were explored are global scenarios and are tightly connected to the global socio–economic development. The globalization of the efforts to stabilize the emission in a world strongly differentiated in its socioeconomics has major consequences.
For as long as I can remember, the main objective in the development of sustainable energy sources was always to make the energy sources economically competitive with fossil fuels. This requires constant improvements in efficiency and price competitiveness. This aspect of sustainable energy is missing from the IPAT identity in its various forms but it was a holy grail among scientists that were working on the issue. An additional aspect that is missing from the IPAT identities and did not play any factor in the work to develop sustainable energy sources is affordability of implementation in developing countries.
Energy prices in developing countries
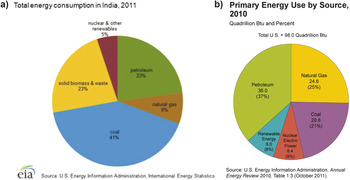
Ex tax and subsidy, the global price of energy is approximately uniform. Energy is an internationalized commodity. The purchasing power is not internationalized. India's 2013 GDP/Capita 23 in current US$ is $1,499, the GDP/Capita of the US for the same year is about $53,100. The primary energy use per capita in India (2011) is 7141 kW h per capita (614 kg oil equivalent in the original document). The US equivalent for the same year is 81,782 kW h (7032 kg oil equivalent in the original document). The volume of 1 kg oil (petroleum) is about 1.1 liter. The international, ex tax, price of liter petroleum is about $0.8/liter. 24 Based on these numbers and assuming all the primary energy of both India and the US is made of petroleum. India is paying for its primary energy 36% of its GDP/Capita while the US is spending 11%. The price of alternative energy sources such as solar and wind are also internationalized. The present primary energy distributions of India and the US are shown in Fig. 7. The solid biomass & waste in India can be, in principle, renewable. In practice most of it is not. It includes cattle manure, wood residues, agricultural residues, and waste stream that are used in India because the resources to acquire more expensive energy sources are beyond the means of large parts of the population. As they become richer, these sources, for variety of reasons, will be replaced by similar mix that is used in more developed countries. One of the most critical questions in addressing climate change is what it will take for India and other developing countries to move to the target energy distribution of Fig. 5. The first sources that will have to go are the biomass & waste and coal. These are the lowest cost available sources and the sources that need not be imported.
Comparison of primary consumption in India (2011) (a) and the US (2010) (b). 22

Competitiveness in developed countries does not mean necessarily competiveness in developing countries. The issue of how to make sustainable energy sources competitive in developing countries was not, to my knowledge, addressed in a major way.
The lack of resources for an energy transition in developing countries has some similarities to the lack of resources to develop drugs to be used, mostly, by developing countries—it is not profitable. The recent Ebola epidemic is a lesson to be learned that the planet is small and viruses have a way to move around to affect citizens in the developed countries. Atmospheric pollutants can move much faster and affect global climate.
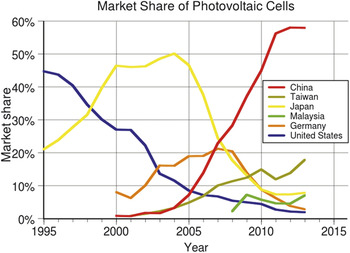
To have a global energy transition, affordability for developing countries should be a high priority. One way that this can be achieved is to identify processing steps that are labor intensive and assign them to be performed in developing countries. Industry is already practicing this kind of analysis to achieve a different objective. Presently the analysis is directed at lowering manufacturing cost and increase in profit through the shift of these manufacturing steps to developing countries with lower labor cost. These shifts are important factors in alleviating poverty in developing countries but they are not directly related to facilitating energy transition in these countries. Developed countries are not the only one interested in making use of the low labor cost in developing countries. Not surprisingly, developing countries are working hard to use their internationally competitive labor force to serve their own economic development. Recent trends in manufacturing of photovoltaic cells are shown in Fig. 8. The figure shows an abrupt shift in manufacturing from developed countries such as United States, Germany, and Japan to China. The shift is synchronized with drastic reduction in cost. Not surprisingly, the shift is causing major dislocations in the developed countries that result in trade wars between China and developed countries that accuse the Chinese of illegal state support for the export of the photovoltaic panels and retaliate through tariffs and quota. Future global attempts at a climate change agreements will have to address the issue and try to resolve it. The economic conflicts between developed and developing countries that are focused on where the new manufacturing capabilities of the new sustainable energy resources will be located are only one front that confronts the transition. Transition of such magnitude invariably involved winners and losers everywhere. Wherever they can, losers are trying to stall the transition with every possible weapon that they can master and conflicts are becoming highly political. The section “Obstacles” will explore this conflict further.
Recent international market share of photovoltaic cells. 25

Obstacles
To keep climate change at a reasonable level that will ensure global temperature increase at a level that will make adaptation feasible (somewhat arbitrarily was agreed to be temperature increase below 2 °C), there is an agreement that significant fraction of fossil fuels needs to stay in the ground and never be used. This fraction is being named unburnable fuels and will result in significant economic losses to the companies and the individuals who own the rights for these resources. Most of them are unhappy about it and try to use their significant economic and political power to block, or at least slow down the economic transition to more sustainable energy sources. Many of us are actively involved in this conflict and my introductory descriptions of the conflicts in the APS are part of this conflict. My blog Reference Tomkiewicz26 is my canvas to try to contribute to this discussion in a language understandable by the voting general public. I am obviously not alone and the blogosphere is full of such attempts on both sides of the debate. In a somewhat non complimentary way, many scientists and others label skeptics of climate change as deniers. On one of my blogs Reference Tomkiewicz27 I tried to classify deniers into three different groups that mostly do not communicate with each other. My classification takes the following form:
-
(1) Deniers of the science. This group basically states that the science is wrong, so there is no need to do anything to counter the impact that scientists predict. Their general tactic is to disagree with some specific piece of the data and then use that as “proof” that the science is wrong in its entirety.
-
(2) The fatalists. This group fully agrees with both the science and its predicted impact, but believes that since the task of preventing it is so enormous as to be practically undoable, they might as well enjoy life for as long as it lasts. Unfortunately, many in this group are good scientists.
-
(3) The NIMBY (Not In My Back Yard) group. This group believes the science and the predicted impact, but does not want to take responsibility for the steps necessary to mitigate the problem, preferring to pass the task off onto others.
The common denominator in all three groups is the unwillingness to do anything to reduce the likelihood of the predicted impact. Among all the deniers that I am familiar with, the emphasis is not on the science but on the action necessary to mitigate the consequences, and the time frame in which that must happen (i.e., never, it's already too late, or now, as long as someone else does it).
I will demonstrate the conflicts and parts of the ongoing discussion that currently takes place within the reviewed scientific literature and has a rich history almost as long as the public discussion on anthropogenic climate change. The argument is focused on the issue of EROI (Energy Return on Investment).
Energy return on investment
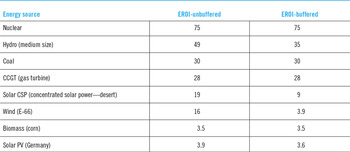
I got recently involved in the EROI debate through a request to comment on a new article by MacKay, Reference MacKay28 where he discussed the storage requirements of a global energy transition with a focus on England. The issue that was raised by MacKay was the totality of storage requirement that will be needed upon complete transition of energy sources in England to sustainable energy sources that are dominated by intermittent solar energy. One of the most critical comments that was voiced over the public communication channels Reference Tomkiewicz29 was that EROI of solar based renewals are degraded below viable levels by the requirements of storage. The argument was based on an article by a group of scientists who are affiliated to The Institute for Solid-State Nuclear Physics in Germany Reference Weißbach, Ruprecht, Huke, Czerski, Gottlieb and Hussein30 that calculated the EROI of various energy sources with and without storage. Table 3 summarizes their results:
EROI of buffered (storage included) and unbuffered (storage not included) energy sources. Reference Weißbach, Ruprecht, Huke, Czerski, Gottlieb and Hussein30

Buffered in Table 3 refers to the storage requirements of the energy sources. The all-important threshold below which it is just a waist of energy was estimated to be around 7, so all the alternatives beside nuclear and hydro should not be pursued. The direct quote states Reference Weißbach, Ruprecht, Huke, Czerski, Gottlieb and Hussein30 “Therefore, an EROI threshold can be roughly estimated by the ratio of the GDP to the unweighted final energy consumption”. To rephrase it—it is being determined by the energy intensity of the country.
The data for calculating the EROI came mainly from estimates of the LCA of the energy sources. LCA is being discussed widely in the MRS journals and other journals. It is recognized of being case specific with most widely acceptable applications to identify “hot spots” in particular facilities that are designed either to improve the economics or to minimize adverse environmental impact. It is almost never used to determine across the board feasibility of technological approach. It cannot be applied uniformly across the board in developing and developed countries with a uniform set of rules.
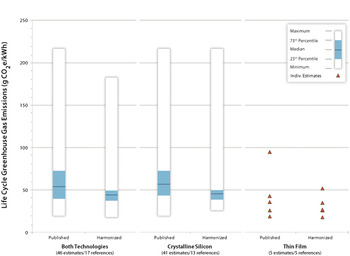
The US Department of Energy has recognized the resulting confusions that emerge out of selective application of the methodologies to energy sources and has asked the US National Renewable Energy Laboratory (NREL) to “harmonize” the literature results. The process of harmonization requires meta-analysis of sets of publications with statistical statements as to ranges of agreements and disagreements of the individual publications. Figure 9 shows the results.
Life cycle GHG emissions for selected solar photovoltaic electricity generation technologies. 31

At least for me, the EROI centered debate on the role of sustainable energy sources did not start recently but can be traced back to the role of fermented ethanol in the sustainable energy mix. Burning of ethanol generates similar energy to the burning of natural gas (3,709 Cal/kg of emitted carbon dioxide, while the burning of natural gas generates 4813 Cal for the same amount of emitted gas). However, it is sustainable because it is being produced from an annual crop (corn in the US) that sequesters the same amount of carbon dioxide while growing. In essence, we are growing energy crops and reducing our dependence on sequestrations that took place hundreds of million years ago. However, by doing so we directly affect the global prices of food with major consequences for countries that are much more dependent on the price of food for existence.
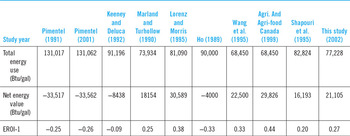
The debate of the real EROI of ethanol from corn in the US started in the beginning of 1990 but started to have a wider audience after Congress passed the Renewable Fuel Standard (RFS) law in 2005 (see Table 4 for a summary). The law requires that transportation fuel sold in the United States to contain minimum volume of renewable fuel. The original version (RFS1) requires 7.5 billion gallons of renewable fuel to be blended into gasoline by 2012 33 :
Summary of EROI of corn-ethanol based on US department of agriculture report. Reference Shapouri, Duffield and Wang32

Shortly after the law was passed (January 2006) a detailed article appeared in Science Magazine on the issue. Reference Farrell, Plevin, Turner, Jones, O’Hare and Kammen34
A few months later (June 23, 2006—Vol. 312) an extensive comments section which focused on the article appeared in the magazine. The comments included both the issue of the competition with the food supply, that I mentioned earlier, and the validity of the EROI calculations.
Conclusions and opportunities
I will finish the paper by returning to my definition of sustainability “The condition that needs to be developed globally for humanity to flourish until technology develops for extraterrestrial travel that will allow migration to another planet once conditions here deteriorate” and the role of material scientists in helping to achieve it.
I will start again with the Kaya–IPAT identity that was described earlier. An additional element that is missing from the identity and is central to my definition of sustainability is time. I will again confine my discussion to climate change. One of the main distinctions between “natural” climate variability and anthropogenic climate variability is that major “natural” variability is being driven by cosmological and geological driving forces. The more recent (last million years or so) result from the planets orbital movements around the sun. “Major” in this description refers to average global temperature changes of around 5 °C and “natural” means that the changes are being driven by nonanthropogenic forces. The recent changes are known to us as the ice ages and the astronomical driving forces that give rise to this variability were quantified as the Milankovitch cycles with periods that range between 30,000–100,000 years. Major anthropogenic climate variability, under business as usual scenario, is estimated to take effect in 2–4 human generations and is not predicted to be cyclical. The anthropogenic contributions come always superimpose on the natural variability. There is nothing that humans can do to mitigate the natural variability except to evolve for better adaptation to the changes. This adaptation is a major driving force in the evolution of life on earth over the last 3.5 billion years.
There is plenty that human can do to mitigate anthropogenic climate variability and try to adapt to changes that cannot be mitigated. Some of it was discussed in the previous sections. Here, I would broaden the discussion with an emphasis on material science.
Material scientists, like most other scientists, need resources to carry on their work. Often scientists are not only the researchers and the teachers but also often serve as the decision makers or the intermediaries between the scientists and the decision makers that decide on the allocation of resources between the various claimants. For researchers in the private sector needs are usually related to profitability. In the public sector, needs are often associated with conviction of the decision makers as to the societal needs and translation of these needs to votes.
Mitigating anthropogenic climate change requires an energy transition to noncarbon based energy sources. Since the present mix of energy sources relies on fossil fuels, a transition to noncarbon based energy sources requires major expansion of nonfossil sources such as the one shown in Fig. 5. Sources that rely on use of solar energy that includes wind and hydroelectric are presently the dominant contributors. Unlike fossil fuels these sources are intermittent. Major pending new challenge in the energy transition is the need to synchronize between energy production and energy consumption. The infrastructure for that synchronization, in the form of smart grids, major upscaling of storage devices, and changing patterns of consumer use, does not yet exist and needs to be designed and implemented.
The major dictum of material science is that structure of materials is key to the properties of materials. Structural properties that material scientists are focused on are crystal structure, microstructures, defects, dislocations, voids, homogeneity, and dimensionality. Measurable properties that are influenced by the structure include conduction (particles and energy), lifetime, stability, etc. Winning strategies almost always include control over increasingly smaller scales down to molecular level. Good example for this trend is the evolution of the computer industry. Focusing on smaller scales necessarily implied narrowing the field of vision. Adaptation of the intermittency of sustainable energy sources to the needs of consumers on global scale is in need of raising the sights away from the microscopes toward the horizon with considerable broadening of the field of vision. The fear that such expansion of scope will blur the separating lines from Engineering should not be a deterrent but will probably involve adjustments of who is doing what and adjustment of the educational requirements to master the jobs. Such an adjustment necessarily will take time and adjustment of the departmental structures of colleges and universities. It will take time (on human scale) and also create winners and losers. The adjustment will be a necessary part of the energy transition. Material science will have to redefine itself to be able to contribute its interdisciplinary focus and expand it up to global scale.
On the adaptation side opportunities to contribute will be a bit closer to the traditional ways that material scientists operate. As shown in Figs. 3 and 4, the timeline for anthropogenic climate variability in a business as usual scenario to become “major” is about 100 years (end of the century or so). Such a timeline is not much different than the estimated timeline of the infrastructure that we live in (again, like in almost everything else, there are major differences between urban infrastructure in developed countries and rural infrastructure in developing countries). With such a rapid change in the two most important external parameters of the natural environment being temperature and water, building codes will have to change everywhere. The present practice is to wait until disaster strikes, look for weak spots and change the codes to prevent repetition of next identical disaster. A transition will have to start soon to construct infrastructure with smart materials that will be able to probe the temperature changes and, if possible, adjust properties to preserve stability with the changing conditions or, if that is impossible, to issue warnings that the structure are becoming fragile and require immediate attention. Application of self-healing materials to adapt to the changing conditions will probably be some of the first things to try.
Probably the first focus in adaptation to the changing climate will focus on water management, ensuring that humans are being incorporated into the water cycle and that the synchronization between the water cycle and the changing climate is maintained. Efforts in this direction are currently making progress in few locations and the technologies to achieve the synchronization exist. Expanding these efforts globally will require political will.