1. INTRODUCTION
High-harmonic generation in intense short-pulse laser interaction with solid targets contains rich information of the instantaneous dynamics that are deeply rooted in the highly nonlinear process. It thus has led to diverse applications such as measuring the hole-boring speed for fast ignition researches (Zepf et al., Reference Zepf, Castro-Colin, Chambers, Preston, Wark, Zhang, Danson, Neely, Norreys, Dangor, Dyson, Lee, Fews, Gibbon, Moustaizis and Key1996; Weng et al., Reference Weng, Murakami and Sheng2015) and sensing megagauss (MG) magnetic fields in solids heated by intense lasers (Tatarakis et al., Reference Tatarakis, Watts, Beg, Clark, Dangor, Gopal, Haines, Norreys, Wagner, Wei, Zepf and Krushelnick2002). Another major application is to produce extremely short light pulses down to attoseconds (Földes et al., Reference Földes, Kocsis, Racz, Szatmari and Veres2003; Mairesse et al., Reference Mairesse, De Bohan, Frasinski, Merdji, Dinu, Monchicourt, Breger, Kovac̆ev, Taeb, Carré, Muller, Agostini and Salières2003). Solid surface harmonics can provide intense enough attosecond pulses for probing ultrafast dynamics within the atomic timescale (Tsakiris et al., Reference Tsakiris, Eidmann, Meyer-ter Vehn and Krausz2006). Polarization gating is used as a control of surface oscillations of solid targets to produce isolate attosecond pulses (Yeung et al., Reference Yeung, Bierbach, Eckner, Rykovanov, Kuschel, Sävert, Förster, Rödel, Paulus, Cousens, Coughlan, Dromey and Zepf2015).
In surface high-harmonic generation (SHHG), an intense laser pulse is reflected by relativistically oscillating layers of surface electrons driven by the laser pulse itself (Bulanov et al., Reference Bulanov, Naumova and Pegoraro1994; Lichters et al., Reference Lichters, Meyer-ter Vehn and Pukhov1996). Under normal incidence, the reflected pulses contain only odd harmonics polarized in parallel to the drive pulse, which have been modeled using a sharp vacuum–plasma interface and follows the well-known selection rules (Lichters et al., Reference Lichters, Meyer-ter Vehn and Pukhov1996). In practice, additional conditions will also contribute, the first being preplasma expansion attributed to electron preheating arising from either the rising edge of incident pulses, prepulses, or a second pulse sent prior to the main pulse (Macphee et al., Reference MacPhee, Divol, Kemp, Akli, Beg, Chen, Chen, Hey, Fedosejevs, Freeman, Henesian, Key, Le Pape, Link, Ma, Mackinnon, Ovchinnikov, Patel, Phillips, Stephens, Tabak, Town, Tsui, Van Woerkom, Wei and Wilks2010; Ma et al., Reference Ma, Sawada, Patel, Chen, Divol, Higginson, Kemp, Key, Larson, Le Pape, Link, MacPhee, McLean, Ping, Stephens, Wilks and Beg2012). The efficiency of SHHG was found to be sensitive to the preplasma scale length (Ozaki et al., Reference Ozaki, Elouga Bom, Ganeev, Kieffer, Suzuki and Kuroda2007), dramatically enhanced in certain range because of a lower density involved and deteriorated again for longer expansion (Dollar et al., Reference Dollar, Cummings, Chvykov, Willingale, Vargas, Yanovsky, Zulick, Maksimchuk, Thomas and Krushelnick2013; Kahaly et al., Reference Kahaly, Monchocé, Vincenti, Dzelzainis, Dromey, Zepf, Martin and Quéré2013). The density gradient also plays a key role in the harmonic generation mechanism of coherent wake emission (Sheng et al., Reference Sheng, Mima, Zhang and Sanuki2005; Quéré et al., Reference Quéré, Thaury, Monot, Dobosz, Martin, Geindre and Audebert2006). The fine control of preplasma expansion has become a critical step toward efficient SHHG.
Additional complexity of SHHG may also come from self-generated magnetic fields. Quasi-static magnetic fields of 100 MG are shown to exist in the near-critical density region of solids via laser ponderomotive heating (Sudan, Reference Sudan1993; Mason & Tabak, Reference Mason and Tabak1998) as well as fast electron current. Typically these fields are along the azimuthal direction for laser normal incidence and are important to a number of processes such as laser absorption, laser-driven ion acceleration, and fast electron transport (Stambulchik et al., Reference Stambulchik, Tsigutkin and Maron2007). Potentially, such quasi-static magnetic fields can also affect SHHG, which has not been clarified completely. In magnetized plasmas, the conversion of a fraction of a laser beam to its phase-mismatch second and third harmonics was analyzed with single-particle model (Ghorbanalilu, Reference Ghorbanalilu2012). It was also suggested that the coupling between the laser-driven oscillations and electron cyclotron motion in such magnetic fields can generate sidebands in the vicinity of harmonics (Zheng et al., Reference Zheng, Tanaka, Sentoku, Offenberger, Kitagawa, Kodama, Kurahashi, Mima and Yamanaka2002).
In this paper, we explore the effect of high transverse magnetic fields on SHHG using particle-in-cell (PIC) simulations. The full process should incorporate target expansion and magnetic field generation due to pre-heating in picoseconds and subsequent high-harmonic generation through femtosecond main pulse interactions. Here, we simplify the treatment by combining a clean femtosecond drive pulse, an external magnetic field of over 10 MG transverse to the laser direction and a pre-defined preplasma region. This can be used to mimic some conditions of relativistic laser–solid interaction under which high quasi-static magnetic fields at tens of MG might exist, even though such high fields are currently not possible in laboratory with conventional technologies. As we shall see, the presence of transverse magnetic fields alters appreciably the electron dynamics near the target surface due to the cyclotron motion. Coupling with surface longitudinal oscillations, they lead to even-order harmonics for simple normal-incidence geometry. In particular, when the magnetic field is parallel to the direction of the laser electric field, the intensity of these even harmonics shows well-behaved dependence with the magnitude of the exerted magnetic field strength, readily observable in experiments. Thus, these results may not only allow the dynamic evolution of self-generated magnetic fields in the relativistic laser–solid interaction to be diagnosed via a pump–probe scheme, but also provide an active monitoring of surface dynamics by exerting a transverse magnetic field even if just at a few Tesla.
2. THEORY MODEL
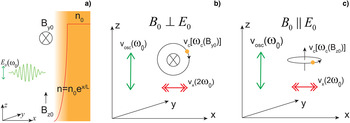
Qualitatively, the effect of a transverse magnetic field on the surface motion of electrons and subsequent SHHG can be sketched with Figure 1. Assume a linearly polarized short intense laser pulse propagates along x-direction and normally irradiates onto a foil target, which is placed under a uniform transverse magnetic field
 ${\bi B}_0 = B_{0y}\hat y + B_{0z}\hat z,$
as shown in Figure 1a. It is well known that electrons under the laser interaction will experience transverse oscillation along the laser electric field along the z-direction at the laser frequency ω0 and the longitudinal oscillation along the x-direction at 2ω0, which form the xz-plane. The coupling of longitudinal and transverse oscillations only leads to odd harmonics with the same polarization of the driving laser. When there is a transverse magnetic field B
0, these oscillations will couple with the cyclotron motion. In the case when this magnetic field is perpendicular to the laser electric field as shown in Figure 1b, the cyclotron motion will be within the xz-plane. Therefore a new surface current component along the z-direction at 2ω0 will appear. As a result, both odd and even harmonics will be produced with the same polarization of the driving laser, which is different from the case without the magnetic field. On the other hand, when this magnetic field is parallel to the laser electric field as shown in Figure 1c, the cyclotron motion will be in a plane perpendicular to the xz-plane. Therefore a new surface current component along the y-direction at 2ω0 will appear. As a result, even harmonics polarized long the y-direction will be produced, while only odd harmonics with the same polarization of the driving laser.
(a) Sketch of the interaction configuration with the incident laser along the x-direction and polarized along the z-direction. (b, c) illustrate electron motion near the target surface under the interaction of incident laser and the transverse magnetic field either perpendicular or parallel to the laser electric field, respectively.

Mathematically, the above scenario can be described by the equation of electron motion coupled with the Maxwell's equations. Under both the laser and magnetic fields, the equation of motion reads
 $$\displaystyle{{d{\bi p}} \over {dt}} = - e[{\bi E} + {\bi v} \times ({\bf B} + {\bi B}_0)],$$
where
p, v
, and –e are, respectively, the electron momentum, velocity, and charge of electrons,
 ${\bf E} = - \partial {\bf A}/\partial t - \nabla {\rm \phi} $
,
 ${\bf B} = \nabla \times {\bf A}$
, ϕ is the electrostatic potential and a = eA/m
e
c is the normalized laser vector potential with m
e and c being the electron mass and light speed in the vacuum. By combining Eq. (1) and the Maxwell's equations, the polarized vector potentials a
y
(p-polarized) and a
z
(s-polarized) satisfy the following wave equations:
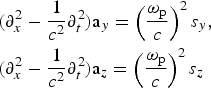 $$\eqalign{& (\partial _x^2 - \displaystyle{1 \over {c^2}}\partial _t^2 ){\rm a}_y = \left(\displaystyle{{{\rm \omega} _{\rm p}} \over c}\right)^2s_y, \cr & (\partial _x^2 - \displaystyle{1 \over {c^2}}\partial _t^2 ){\rm a}_z = \left(\displaystyle{{{\rm \omega} _{\rm p}} \over c}\right)^2s_z} $$
with the source terms
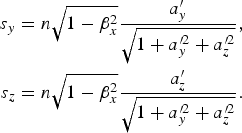 $$\eqalign{s_y & = n\sqrt {1 - {\rm \beta} _x^2 } \displaystyle{{a_y^{\prime} } \over {\sqrt {1 + a_y^{{\prime}2} + a_z^{{\prime}2} } }}, \cr s_z & = n\sqrt {1 - {\rm \beta}_x^2 } \displaystyle{{a_z^{\prime} } \over {\sqrt {1 + a_y^{{\prime}2} + a_z^{{\prime}2} } }}.} $$
Here
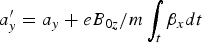 ${a}^{\prime}_y = a_y + eB_{0z}/m\int_t {\rm \beta} _xdt$
and
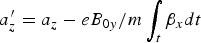 ${a}^{\prime}_z = a_z - eB_{0y}/m\int_t {\rm \beta} _xdt$
with β
x
being the longitudinal electron velocity normalized by c,
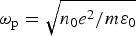 ${\rm \omega} _{\rm p} = \sqrt {n_0e^2/m{\rm \varepsilon} _0} $
is the plasma frequency defined by the maximum initial electron density n
0, n is the electron density normalized by n
0, and ɛ0 is the vacuum permittivity.
The above equations reduce to that derived in (Lichters et al., Reference Lichters, Meyer-ter Vehn and Pukhov1996) for B
0y
= B
0z
= 0. For example, for an s-polarized drive laser pulse, both the density fluctuation n and longitudinal velocity β
x
contain only even-order harmonics of the laser frequency ωL. Coupling with transverse laser oscillations, they lead to only odd harmonics polarized in the same plane as the drive pulse. While for nonzero B
0, the presence of the magnetic field modifies the vector potentials in the source terms with an additional terms
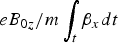 $eB_{0z}/m\int_t {\rm \beta} _xdt$
and
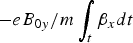 $ - eB_{0y}/m\int_t {\rm \beta} _xdt$
. Obviously, the additional terms are due to the cyclotron motion exerted by the magnetic field and the surface longitudinal oscillations β
x
. In particular, additional even harmonics polarized orthogonal to the magnetic field, apart from the typical odd harmonics polarized in parallel to the drive pulse. Despite this simple qualitative analysis, the dependence of the even harmonic generation with laser–target and magnetic field parameters are quite complicated as the cyclotron motion and longitudinal oscillation are strongly coupled with each other. The cyclotron motion spreads over the entire region, while density oscillation is most efficient only near the critical density surface. Under sufficient strong magnetic field, the cyclotron motion can also modify the surface oscillations. In the following, we adopt PIC simulations to elucidate the details and provide parametric studies of this phenomenon.
3. NUMERICAL SIMULATION RESULTS
3.1. One-dimensional (1D) PIC simulation
We start with 1D PIC simulations using the OSIRIS code (Fonseca et al., Reference Fonseca, Silva, Tsung, Decyk, Lu, Ren, Mori, Deng, Lee, Katsouleas and Adam2002). The simulation box is initialized as 40λL long, divided into 4000 cells with 100 micro-particles per cell, where λL is the incident laser wavelength. The solid target is uniform in x ∈ [0, 2λL], with a preplasma attached in the front varying as
 $n = n_0\exp (x/L),$
where n
0 = 40 n
c is the peak density, n
c = 1.1 × 1021 cm−3 is the critical density for λL = 1 μm, and L = 0.2 is the preplasma scale length. A linearly polarized laser pulse with normalized vector potential
 $a = a_0\mathop {\sin} \nolimits^2 ({\rm \pi} t/T_{\rm L})$
impinges from the left onto the target, where a
0 = 0.5 corresponds to a peak intensity of 3.4 × 10¹⁷ W/cm2, τ = 9T
L is the full pulse duration, and T
L = 2π/ω0 is the laser period. For clarity, we assume it is polarized along the z-direction and call it s-polarized. Ions are treated to be stationary background as they have little effect in this ultrafast process (An der Brügge et al., Reference An der Brügge, Kumar, Pukhov and Rödel2012).
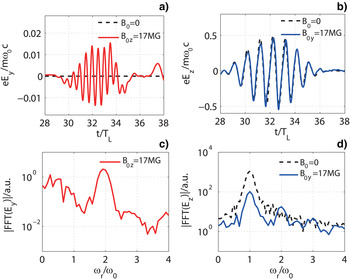
The reflected pulses are traced at x = −4 and the results (both time and frequency domains) are shown in Figure 2 for different runs with or without external magnetic field in different directions. In the case without external magnetic field, only odd harmonics show up in s-polarization and no harmonics is observed in p-polarization, as shown by the black dashed lines in Figure 2a, 2b, 2d, as expected in accordance with the selection rules (Lichters et al., Reference Lichters, Meyer-ter Vehn and Pukhov1996). The prominent new feature occurs for B 0z = 17 MG, where a well-defined reflected pulse containing even-order laser harmonics now emerges in p-polarization as shown in Figure 2c. The even-order harmonics occur in s-polarization for B 0y = 17 MG, as shown in Figure 2d. The parity of these even harmonics changes with the direction of the external magnetic field and they are always perpendicular to the magnetic field, a clear evidence of electron cyclotron motion as theoretically discussed above. The merit of employing parallel magnetic field and incident laser field is that the even harmonics can be well separated from the reflection of the drive pulse due to their different polarizations.
An s-polarized laser pulse is reflected by a solid target in different runs without and with a homogeneous magnetic field applied either in y- or z-directions. The p- and s-polarized components of the reflected electric field without the effect of magnetic field are plotted in black dashed lines in (a) and (b). The p-polarized component of the reflected electric field E y in B 0z = 17 MG and its Fourier transformed spectra are shown in red solid lines in (a) and (c). The s-polarized component of the reflected electric field E z in B 0y = 17 MG and its Fourier transformed spectra are shown in blue solid lines in (b) and (d).

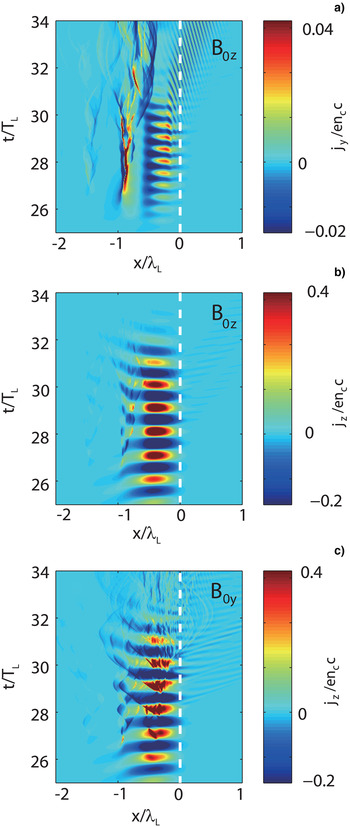
The harmonics generation due to the magnetic field is also reflected in the transverse currents, which are actually the source terms give in Eq. (2). In Figure 3, the electric current components j
y
and j
z
in different simulations run with the transverse magnetic field either perpendicular or parallel to the laser electric field are shown in the space-time plots. With the presence of magnetic field
 $B_{0z} = 17{\kern 1pt} \;{\rm MG}$
, a new surface current j
y
at 2ω0 appears as shown in Figure 3a, resulting in the even harmonics in
 $\vert{\rm FFT}(E_y)\vert$
shown in Figure 2c. Note that there is a low-frequency current component near x/λL ~ −1 in Figure 3a, which can be attributed to the zero-frequency component of the laser ponderomotive force and the charge separation fields at the front surface. The latter can drive longitudinal motion of electrons, which, when bended by B
0z
, leads to low-frequency transverse currents j
y
finally. The electric current component j
z
shown in Figure 3b is dominated by oscillations at ω0, even though it contains odd harmonic components. Also note that the amplitude of j
z
is an order of magnitude higher than the amplitude of j
y
. With the presence of magnetic field
 $B_{0y} = 1{\kern 1pt} \;{\rm MG}$
, there is simply j
y
= 0. The electric current component j
z
shown in Figure 3c is a kind of superposition of Figure 3a and b and is dominated by the oscillation at ω0 as expected.
Space-time plots of electric current components j
y
and j
z
vs coordinate x and time t in units of λL and T
L with a magnetic field applied either in z- or y-directions. (a, b) are for j
y
and j
z
respectively with
 $B_{0z} = 17\;{\kern 1pt} {\rm MG}$
, and (c) is for j
z
with
 $B_{0y} = 17\;{\kern 1pt} {\rm MG}$
. The dashed line shows the initial position of the critical plasma density.

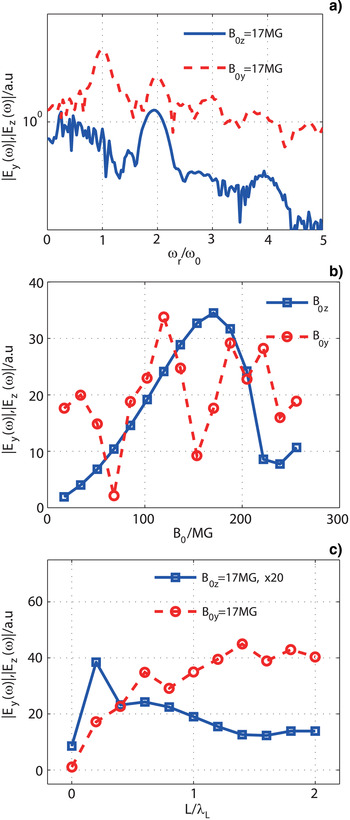
Next we look into the dependence of this magnetic field induced even harmonic generation on the magnetic field strength and plasma density scale length. Figure 4a shows a comparison of spectra for s- and p-polarized reflected light. At the magnetic field strength of 17 MG, the second harmonic due to
 $B_{0y}$
is much weaker than that due to B
0z
. However, with the increase of the magnetic field strength, it changes. As shown in Figure 4b, in a certain range (<160 MG), the spectral intensity of the second harmonic E
y
depends linearly on the external magnetic field B
0z
. It reaches the maximum at
 $B_{0z} = 160{\kern 1pt} \;{\rm MG}$
and weakens with stronger magnetic field. On the other hand, when applied with B
0y
, there are several peaks in the second harmonic E
z
as shown by the red circles in Figure 4b. This may be attributed to the much complicated coupling of cyclotron motion with both the longitudinal and transverse oscillations shown in Figure 1b. The almost linear scaling of the second harmonic E
y
with the magnetic field B
0z
can be used to measure the magnetic field by detecting the emission of the second harmonics or higher even harmonics. A drive pulse can be used to generate the magnetic field near the critical density region and a probe pulse can be used to measure the field (Kahaly et al., Reference Kahaly, Mondal, Kumar, Sengupta, Das and Kaw2009). By changing the focusing positions and delay of the probe pulse, the distribution and temporal evolution of the magnetic field can be measured.
(a) The Fourier transformed spectra of E
y
with the magnetic field
 $B_{0z} = 17{\kern 1pt} \;{\rm MG}$
(blue solid) and E
z
with
 $B_{0y} = 17{\kern 1pt} \;{\rm MG}$
(red dashed) with L = 0.2 λL. (b) Scalings of the second-harmonic spectra
 $\vert{\rm FFT}(E_y)\vert$
(blue square) and
 $\vert{\rm FFT}(E_z)\vert$
(red circle) with the strength of the magnetic field B
0z
and B
0y
, respectively, with L = 0.2 λL. (c) Scalings of the second-harmonic spectra
 $\vert{\rm FFT}(E_z)\vert$
(red circle) either with
 $B_{0y} = 17\;{\kern 1pt} {\rm MG}$
and
 $\vert{\rm FFT}(E_y)\vert$
(blue square, multiplied by 20) or with
 $B_{0z} = 17{\kern 1pt} \;{\rm MG}$
with the preplasma length.

So far we have fixed the preplasma scale length to be L = 0.2 λL. The coupling efficiency also depends on the L employed. Figure 4c shows the correlation for the magnetic field strengths in both transverse directions with
 $B_{0z} = 17{\kern 1pt} \;{\rm MG}$
(blue) and
 $B_{0y} = 17{\kern 1pt} \;{\rm MG}$
(red). The preplasma scale of the target plays a crucial role in the surface oscillations. With the parallel magnetic field B
0z
, the even harmonic intensity increases with the density scale length L when L < 0.2 λL and then decrease with the further increase of L. This is similar to the odd harmonics produced without the effect of magnetic field (Dollar et al., Reference Dollar, Cummings, Chvykov, Willingale, Vargas, Yanovsky, Zulick, Maksimchuk, Thomas and Krushelnick2013). With the perpendicular magnetic field B
0y
, longer preplasma with L > 0.2 λL can produce even harmonics more efficiently. This suggests that the perpendicular magnetic field leads to higher coupling at long density scale length.
3.2. Multi-dimensional effects
We also run 3D PIC simulations to check possible multi-dimensional effects on this process. The simulation box is set to be
 $20 \times 20 \times 20\;{\rm \lambda} _{\rm L}^3 $
in the x × y × z-directions, with 64 × 8 × 8 cells per wavelength. The plasma occupies a volume of
 $2 \times 18 \times 18\;{\rm \lambda} _{\rm L}^{\rm 3} $
with a sharp density front. An incident laser with a Gaussian transverse profile
 $a = a_0\exp ( - r^2/{\rm \sigma} _0^2 )$
is sent to the target from left, where σ0 = 2 λLis the focal spot radius at waist. The other laser parameters are the same as in the 1D simulation with the laser field polarized along the z-direction. Despite much lower spatial resolutions compared with 1D simulation, they are fine enough to resolve the second harmonics.
A pair of comparison simulations are conducted, either with or without external magnetic field B
0z
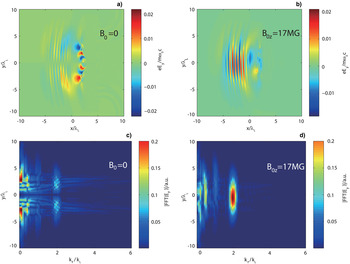
. Figure 5 shows the p-polarized reflected fields for each case and their corresponding Fourier spectra in the k–y space. It is seen that second-harmonic generation occurs for both cases. For B
0z
= 0, the harmonic is distributed in an annular pattern with a large divergence. This hollow harmonic is actually radial polarized and is probably caused by the transverse gradient of the incident laser pulse and plasma density as demonstrated in by Gizzi et al. (Reference Gizzi, Giulietti, Giulietti, Audebert, Bastiani, Geindre and Mysyrowicz1996). While for the case of
 $B_{0z} = 17{\kern 1pt} \;{\rm MG}$
, the even harmonics generally share the same Gaussian transverse profile as the drive pulse. This magnetic field induced even harmonic is much higher than that produced due to the transverse gradients of the incident laser pulse.
Results of 3D PIC simulations. The electric field E
y
of the horizontal section at z = 0 in the magnetic field B
0z
= 0 (a) and
 $B_{0z} = 17\;{\kern 1pt} {\rm MG}$
(b). Plots (c) and (d) show the wave vector spectra
 $\vert{\rm FFT}(E_y)\vert$
for the fields given in (a) and (b), respectively. The laser focal spot size is 2λL.

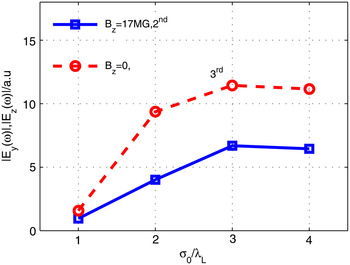
Laser spot size is a crucial parameter for routinely monitoring high-intensity performance (Dromey et al., Reference Dromey, Bellei, Carroll, Clarke, Green, Kar, Kneip, Markey, Nagel, Willingale, McKenna, Neely, Najmudin, Krushelnick, Norreys and Zepf2009). If the laser has a large spot size, the situation is similar to 1D simulation. When the laser spot size is smaller, multi-dimensional effects such as hole boring will play a significant role and results in decrease of even-order harmonics. To show this, we carry out 2D simulations, with similar laser and plasma parameters as in 3D simulations. The spectral intensity of the second harmonics with
 $B_{0z} = 17{\kern 1pt} \;{\rm MG}$
is shown to increase with the laser focal spot size, and reaches saturation at σ0 = 3 λL. Similar results are found with the third harmonics with B
0z
= 0, as shown in Figure 6. With a small laser spot size, the oscillating mirror is not a perfect planar mirror as usually found in 1D simulation, due to hole-boring effect. The reflected pulse also experiences diffraction spreading transversely, leading to decaying of the harmonic radiation quickly with the increase of distance away from the target surface. The second harmonic generated with B
0z
= 0 is distributed more diversely with increasing σ0, with the amplitude and spectral intensity increasing at first and reaching saturation at σ0 = 3 λL, beyond which it decreases.
Scaling of spectral intensity of the second harmonic
 $\vert{\rm FFT}(E_y)\vert$
(for
 $B_{0z} = 17{\kern 1pt} \;{\rm MG}$
) and third harmonic
 $\vert{\rm FFT}(E_z)\vert$
(for B
0z
= 0) with the laser focal spot size obtained in 2D simulations. The electron density is steep at the surface.

4. CONCLUSION
In conclusion, it is shown that external transverse magnetic field can change the parity of harmonics generated from laser-irradiated solid surface by modifying the coupling of the transverse and longitudinal oscillations of electrons at the solid surface. In particular, with even harmonics can be produced with different polarization from the driving laser pulse. The coupling of the electron cyclotron motion and the longitudinal oscillations at the second harmonic of the driving laser is responsible for the even harmonics generation. The results are confirmed by PIC simulations. The spectral intensity of the second harmonics depends linearly on the magnitude of the magnetic field parallel to the laser electric field, providing a way to measure the strong self-generated magnetic field during the laser–plasma interaction. The dependence of the second harmonic on the preplasma scale length is shown to increase with longer preplasma scale, in which may also be useful to evaluate the preplasma scale length. Finally, both the magnetic field-induced second harmonic and normal third harmonic tend to increase with the laser spot size. When the latter is larger than 3λL, the radiation fields become saturated. Additional even harmonic component generated due the transverse gradient of the incident laser pulse is found, which has radial polarization and emits with a conical distribution and is therefore distinctly different from the even harmonics induced by the magnetic field.
Acknowledgements
Z.M.S. would like to acknowledge the OSIRIS Consortium, consisting of UCLA and IST (Lisbon, Portugal) for the use of OSIRIS and the visXD framework. This work is supported by the National Science Foundation of China (grant numbers 11374210 and 11421064), a MOST international collaboration project (grant number 2014DFG02330), and a Leverhulme Trust Research Grant. Simulations were performed on the Π supercomputer at Shanghai Jiao Tong University and on the Magic Cube II supercomputer of Shanghai High Performance Computing Center. F.Y.L. and Z.M.S. acknowledge access to the ARCHER computing service through the Plasma HEC Consortium EPSRC grant number EP/L000237/1.