





1. Introduction
It is widely believed among faculty, researchers, and students (Hunter, Laursen & Seymour Reference Hunter, Laursen and Seymour2007) that undergraduate research experiences (UREs) greatly enhance science, technology, engineering, and mathematics (STEM) education by, for example, increasing interest in science careers (Russell, Hancock & McCullough Reference Russell, Hancock and McCullough2007) and helping students develop skills necessary for graduate school or professional service (Landrum & Nelsen Reference Landrum and Nelsen2002; Petrella & Jung Reference Petrella and Jung2008). But there is little quantitative evidence to support these broad claims of success. Expectations and gains for students vary widely, and gains can be constrained by prior expectations (Wilson et al. Reference Wilson, Howitt, Roberts, Åkerlind and Wilson2013). Poorly designed projects or those with a narrow scope may also limit student gains. Related work has further highlighted the importance of the mentor–mentee relationship, in particular suggesting that this relationship is the most important factor influencing future decisions regarding graduate school (Houser, Lemmons & Cahill Reference Houser, Lemmons and Cahill2013).
Conversely, many faculty view UREs as costly or as a burden, even though there is strong evidence that UREs benefit mentors greatly (Hill et al. Reference Hill, Ward, Seay and Buzenski2022; Sarabipour et al. Reference Sarabipour, Niemi, Burgess, Smith, Filho, Ibrahim and Clark2023). The perceived difficulty and workload of mentoring a URE (Eagan et al. Reference Eagan, Sharkness, Hurtado, Mosqueda and Chang2011) and misalignment of mentor–mentee goals (Sharma et al. Reference Sharma, Nair, Guo, Palea and Lee2022) appear to remain significant barriers in the wider implementation of UREs. Administrative barriers exist as well: faculty are generally not recognized or awarded for involving undergraduate students in research (Dolan & Johnson Reference Dolan and Johnson2010).
To improve student gains, UREs should promote integrated understanding (Linn et al. Reference Linn, Palmer, Baranger, Gerard and Stone2015) and set expectations early on. Broader definitions of research activities and different forms of research engagement can reduce barriers and lead to better outcomes (Brew & Mantai Reference Brew and Mantai2017). Careful preparation and structuring of UREs can lead to better outcomes for both the mentor and mentee (Shanahan et al. Reference Shanahan, Ackley-Holbrook, Hall, Stewart and Walkington2015). In short, mentors must work carefully to prepare and implement UREs to ensure students are well supported, and that the project aligns well with both faculty and student expectations. Mentors should commit to providing appropriate support for each URE to achieve positive learning and research outcomes.
We propose treating URE planning as a design problem under uncertainty, involving tradeoffs between student and mentor outcomes. The idea of “designing” a URE to meet specific learning and research goals has seen some success recently, especially in course-based UREs and similar frameworks. Perhaps unsurprisingly, some successful examples use approaches that are consistent with evidence-based and learner-centered teaching strategies (see Felder & Brent Reference Felder and Brent2024 for a comprehensive overview of learner-centered teaching strategies). For example, more structured approaches with well-defined learning objectives, syllabi, and grading rubrics have shown promise (Brown, Lewis & Bevan Reference Brown, Lewis and Bevan2016). Design iteration, or cyclic refinement over time, has also shown success in course-based UREs (Mordacq et al. Reference Mordacq, Drane, Swarat and Lo2017). While these recent developments have implemented some aspects of a design science, they have been limited to structured or course-based programs and their extension to traditional mentored UREs is unclear. They also fall short of providing an actionable methodology that can be adapted or extended to other contexts. Here, we present a methodology to analyze and design traditional apprenticeship-style UREs with a clear procedure, representation, and intended use that can be applied more broadly.
The methodology we propose is rooted strongly in design theory, and we argue that URE design, like many problems in education and beyond, should be treated as a design problem. Design broadly refers to the creation of artifacts such as services, products, or systems, and design science is the scientific discipline that studies this creative process and the knowledge it generates (Papalambros et al. Reference Papalambros, Gero, Maier, Cagan, Ahmed-Kristensen, Albers, April, Blessing, Boujut, Cantamessa, Cascini, Chakrabarti, Chen, Clarkson, Jiao, Eckert, Feinberg, Gericke, Hanna, Holtta-Otto, Jankovic, Jin, Kleinsmann, Knight, le Masson, Lewis, Linsey, Luo, McMahon, Nagai, Pigosso, Reich, Reid, Seepersad, Seifert, Shealy, Summers, Vermaas, Wartzack, Yang and Yannou2025). Education is naturally a design science in that it applies practical knowledge and heuristic principles to create instructional methods and teaching experiences that achieve the goal of student learning (Laurillard Reference Laurillard2013, ch. 1). Indeed, design principles are prevalent throughout the education literature, even when they are not explicitly labeled as such (Herrington & Reeves Reference Herrington and Reeves2011). However, broader recognition of educational practice as a design science problem, rather than merely a linear, systematic, task-oriented process, has only emerged relatively recently (Norton & Hathaway Reference Norton and Hathaway2015). A primary goal of design research is to support designers (in our case, research mentors) by transferring research results and design methods into practice (Gericke et al. Reference Gericke, Eckert, Felician Campean, Flening, Isaksson, Kipouros, Kokkolaras, Köhler, Panarotto and Wilmsen2020). This is achieved by developing local design principles into more complete design methods that are described with sufficient rigor to enable broader use and adaptation (Gericke, Eckert & Stacey Reference Gericke, Eckert and Stacey2022). As such, design science provides an ideal lens for analyzing UREs and other project-based mentorship experiences as design problems and for articulating transferable methods to improve them.
1.1. Aims and significance
In this work, we pursue two complementary goals. First, we aim to develop a rational, multi-criteria decision- making framework, grounded in possibility theory, for designing and iteratively adapting project-based mentoring experiences under uncertainty. Second, we aim to demonstrate how the framework can be used to inform design of UREs to improve both student and mentor outcomes. This framework directly addresses the issue of balancing competing research and learning outcomes, providing an actionable strategy to systematically tune individual experiences according to both mentor and mentee goals.
In the following, we detail a rational multi-criteria decision-making approach for planning project-based mentoring experiences under uncertainty to aid mentors in designing UREs that are better aligned with both the mentor’s and student’s goals. We develop six criteria on which a URE proposal is graded, derived from the preceding text, and detail the procedure for evaluating a URE proposal. We then apply the method to analyze and discuss three example projects that were recently conducted by the authors. The design approach requires the mentor to evaluate multiple criteria regarding both their relative importance and expected outcome for a specific project, and is thus a rational model for decision making. As such, the purpose of the tool is to require mentors to formally define and acknowledge their expectations for the URE, and reconcile their expectations with what they perceive to be important factors in URE outcomes.
The analysis uses possibility theory (Dubois & Prade Reference Dubois, Prade, Kacprzyk and Pedrycz2015), which is a subset of the theory of evidence (Gordon & Shortliffe Reference Gordon and Shortliffe1984), with the aim of injecting judgment values or belief into the decision-making process. This is in contrast to probability theory which assigns likelihood, and also contrasts with the Bayesian interpretation of the degree of belief (Smets Reference Smets1988). Notably, all possible outcomes are not complementary (Salicone Reference Salicone2007, ch. 3), leading to a different set of rules for combining multiple pieces of evidence. This approach has the benefit that the assessment not only accounts for uncertainty and ignorance in our judgment but also allows us to interpret the decision value as a measure of how strongly the mentor should believe the project will be successful. The use of possibility theory here is particularly important because it provides a means to directly account for the inherent uncertainty in assigning a “degree of belief” in an outcome based on intuition. We are hopeful that further development of this approach can yield greater benefits to both students and faculty, and encourage other faculty and researchers to more fully integrate undergraduate students in interdisciplinary, high-impact research projects. While this analysis focuses on UREs as an example case, the framework is intended to be more broadly useful in designing complex mentoring and project experiences.
2. Methods
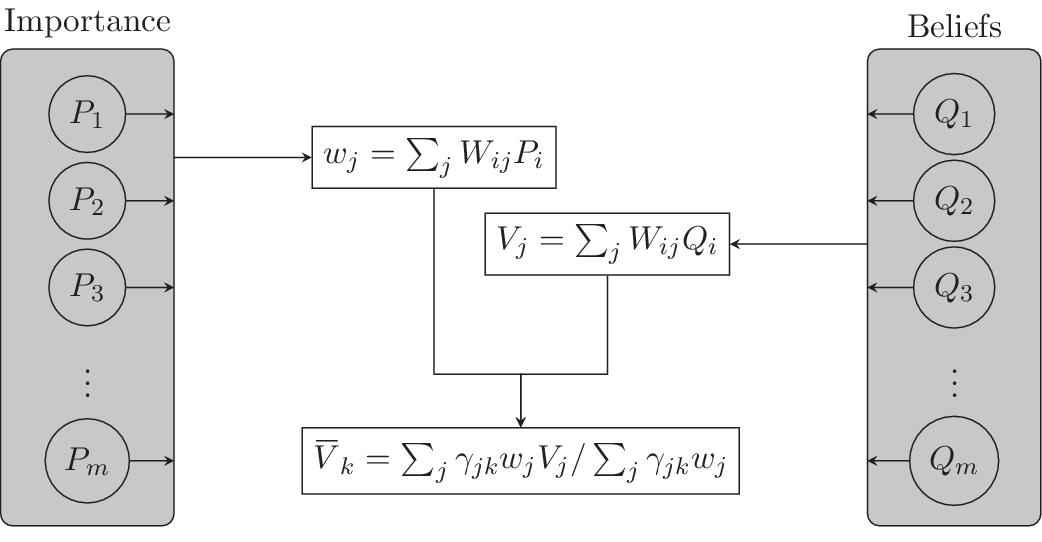
The decision-making tool is implemented as a survey, in which the user assigns a value representing the importance of a variety of statements as they relate to expected project success. Then, after describing their specific project proposal in detail, the user is asked to evaluate their expectations of the project using a corresponding set of prompts. Underlying these individual statements are six basic criteria that are each evaluated as a weighted average of the responses to several of the prompts. The process is shown schematically in Figure 1. The prompts, primary criteria for evaluation, and mathematical details are described in the following.
Illustration of the URE analysis method. The two shaded boxes, “Importance” and “Beliefs,” are the user-input relative importance and project belief values, respectively. From these, relative weights
$ {w}_j $
 and average belief values
$ {V}_j $
 are calculated for the six primary criteria using the same weight matrix
$ {W}_{ij} $
 . Then, aggregate belief values representing mentor and student outcomes (the
$ {\overline{V}}_k $
 ’s) are calculated from the intermediate values. The matrix elements
$ {\gamma}_{jk} $
 are further weightings that indicate whether criterion
$ j $
 is considered for outcome
$ k $
 .

2.1. Decision-making criteria
Creating guidelines to design a traditional apprenticeship-style URE is not straightforward, in part because of the wide range of mentoring styles, research methodologies, project scopes, and student expectations that occur throughout different STEM fields. However, there are a few factors that are widely agreed upon to be influential to URE success, which we focus on here. These factors include time management and commitment, goal-setting, motivation, and the student–mentor relationship (Mancha & Yoder Reference Mancha and Yoder2014). Similarly, longer-term, sustained UREs lasting more than one year are correlated with publications co-authored by mentor and student (Morales, Grineski & Collins Reference Morales, Grineski and Collins2017), so project length and scope also should be considered.
In total, six decision-analysis criteria were identified as factors that are commonly associated with URE success in the literature, as well as factors that are critical to project planning. The criteria are summarized in Table 1. The following paragraphs summarize our interpretation of these criteria as we view them for our UREs, and acknowledge that these descriptions will vary between researchers and universities.
Description of six primary criteria considered in the decision-making analysis procedure

Table 1. Long description
Six criteria labeled “Time,” “Scope,” “Research Impact,” “Learning,” “Alignment,” and “Communication” are listed next to their working definitions or interpretation for the analysis. The interpretations of each of the criteria are “Can the project be completed in an appropriate time frame?,” “Is the project suitable (and adaptable) for an undergraduate project?,” “Is the project setup appropriately to answer a suitable research question?,” “Are there suitable learning opportunities for an undergraduate student?,” “Do the mentor and student share similar expectations for the project direction?,” and “Are the mentor(s) and student able to communicate effectively?,” respectively.
The first two criteria, time and scope, are common indicators used in project management for project planning, and require little additional explanation. For any project to be successful, whether undergraduate research or large-scale engineering project, the timeline and scope must fit the project requirements. In this case, to facilitate learning outcomes, we expect the project scope is sufficiently broad to introduce the student to many aspects of academic research while being sufficient small and well-defined that it can be completed within the course or internship duration. Related to scope, the project time or duration should be appropriate to complete the project work while avoiding overly ambitious timelines that do not account for the time needed to learn new skills.
The next two criteria, learning and research impact, are direct indicators of the project impact. For the URE to be successful, the student should learn something about academic research. For our work, we generally aim to provide an opportunity for students to learn new skills that are of value in industry or academic jobs (e.g., in engineering, this could be programming experience, use of computational software, application of design methods, or novel analysis techniques) in addition to deeper knowledge and application of the topics that are taught in related classes. Regarding research impact, we similarly aim to outline projects that are a small but necessary portion of our ongoing research.
Finally, alignment and communication are indicators that both students and faculty have identified as being factors in the success of UREs. Alignment refers to the shared expectations, motivations, and interests between the student, mentor, and project focus. Similarly, student motivation or enthusiasm has similarly been identified as an important factor (Mancha & Yoder Reference Mancha and Yoder2014). We include student motivation and enthusiasm as part of alignment for simplicity. Likewise, communication refers to having established and open channels of communication, through scheduled meetings, training, and other forms of student support.
2.2. Survey prompts
The six criteria are evaluated by answering a series of 27 prompts twice. The first set of 27 prompts are evaluated by the mentor regarding their importance to project success. For the second set of prompts, the mentor assigns a belief value to each statement regarding their expectations for a specific project. The belief value assigned here is a stated and unsupported measure of how strongly they believe each outcome to be true or false, and is implicitly uncertain. These prompts were selected to probe factors relevant to URE success as documented in the literature, and to specifically relate to the six decision-analysis criteria outlined above. The prompts are shown in Table 2, and the relative weight matrix is shown in Table 3. The weights are selected to be either
$ 0 $
 ,
$ \pm 0.5 $
 , or
$ \pm 1 $
 , corresponding to no, partial, or perfect correlation between the question and underlying criteria.
Prompt text for belief statements and importance statements
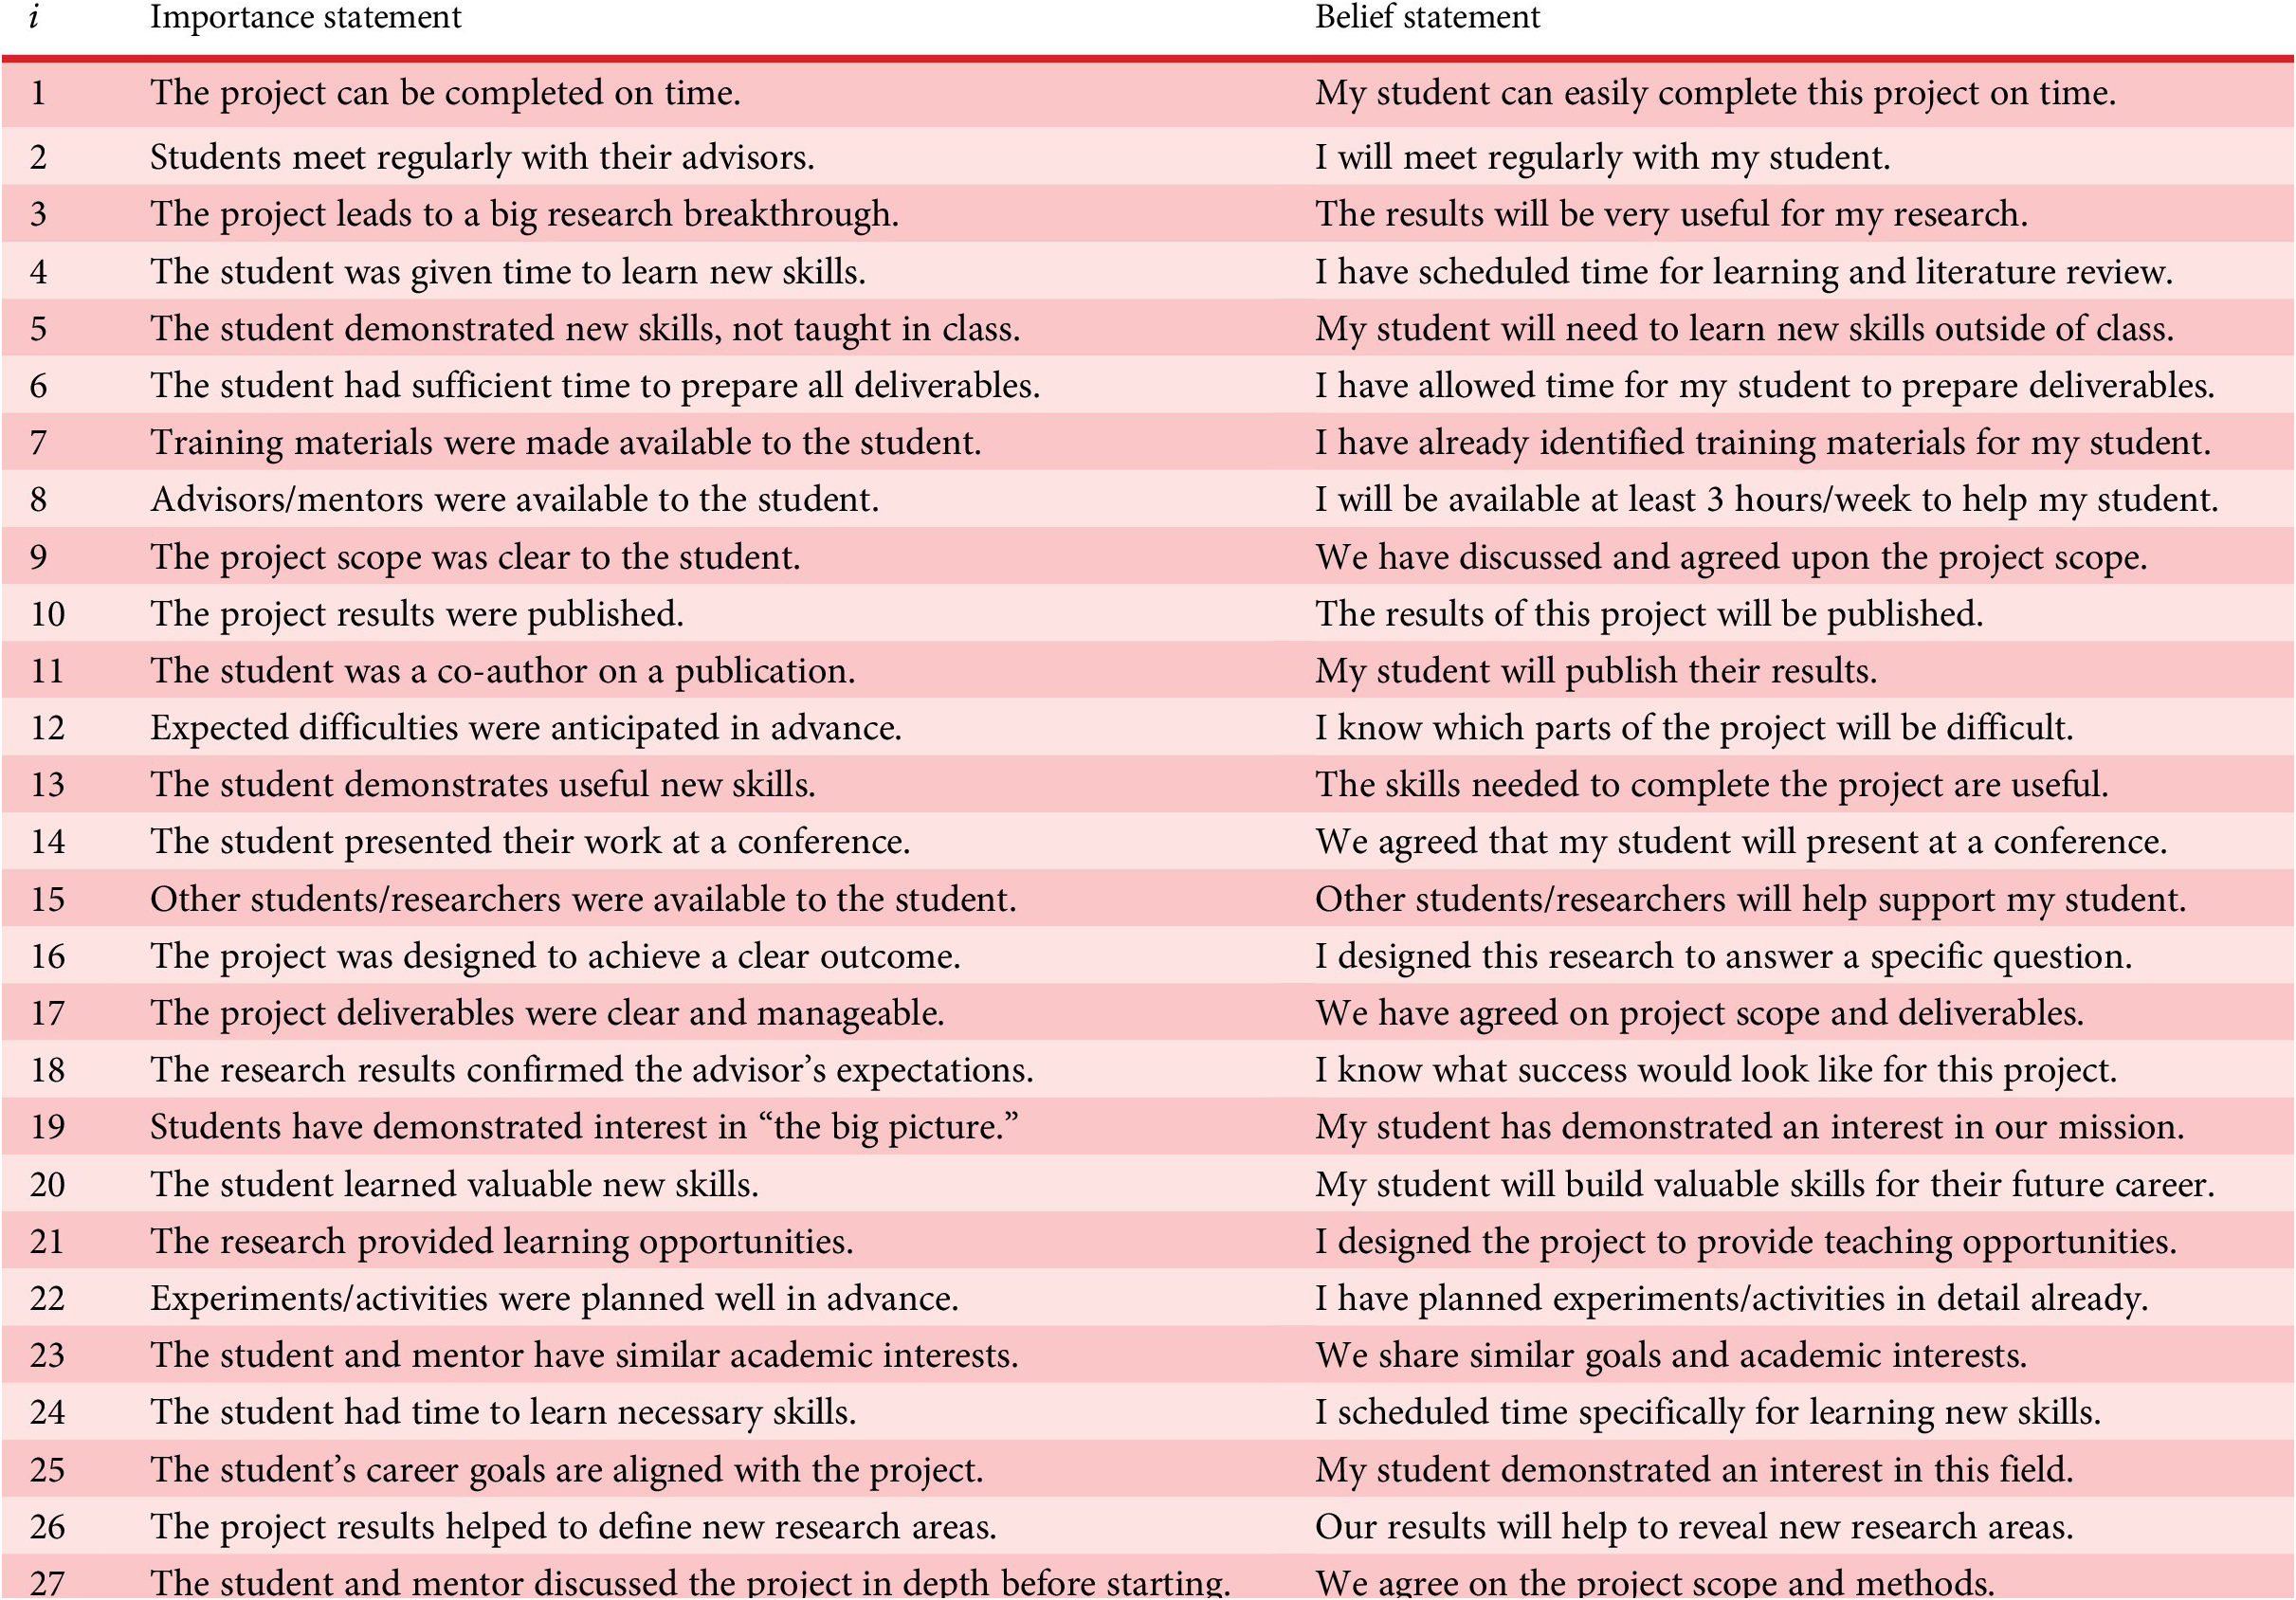
Table 2. Long description
Twenty-seven beliefe statements and twenty-seven importance statements are listed side-by-side, illustrating the parallelism between the belief and importance statements. The text of each statement is listed on the table itself and electronically in the linked dataset.
Relative weights for each prompt
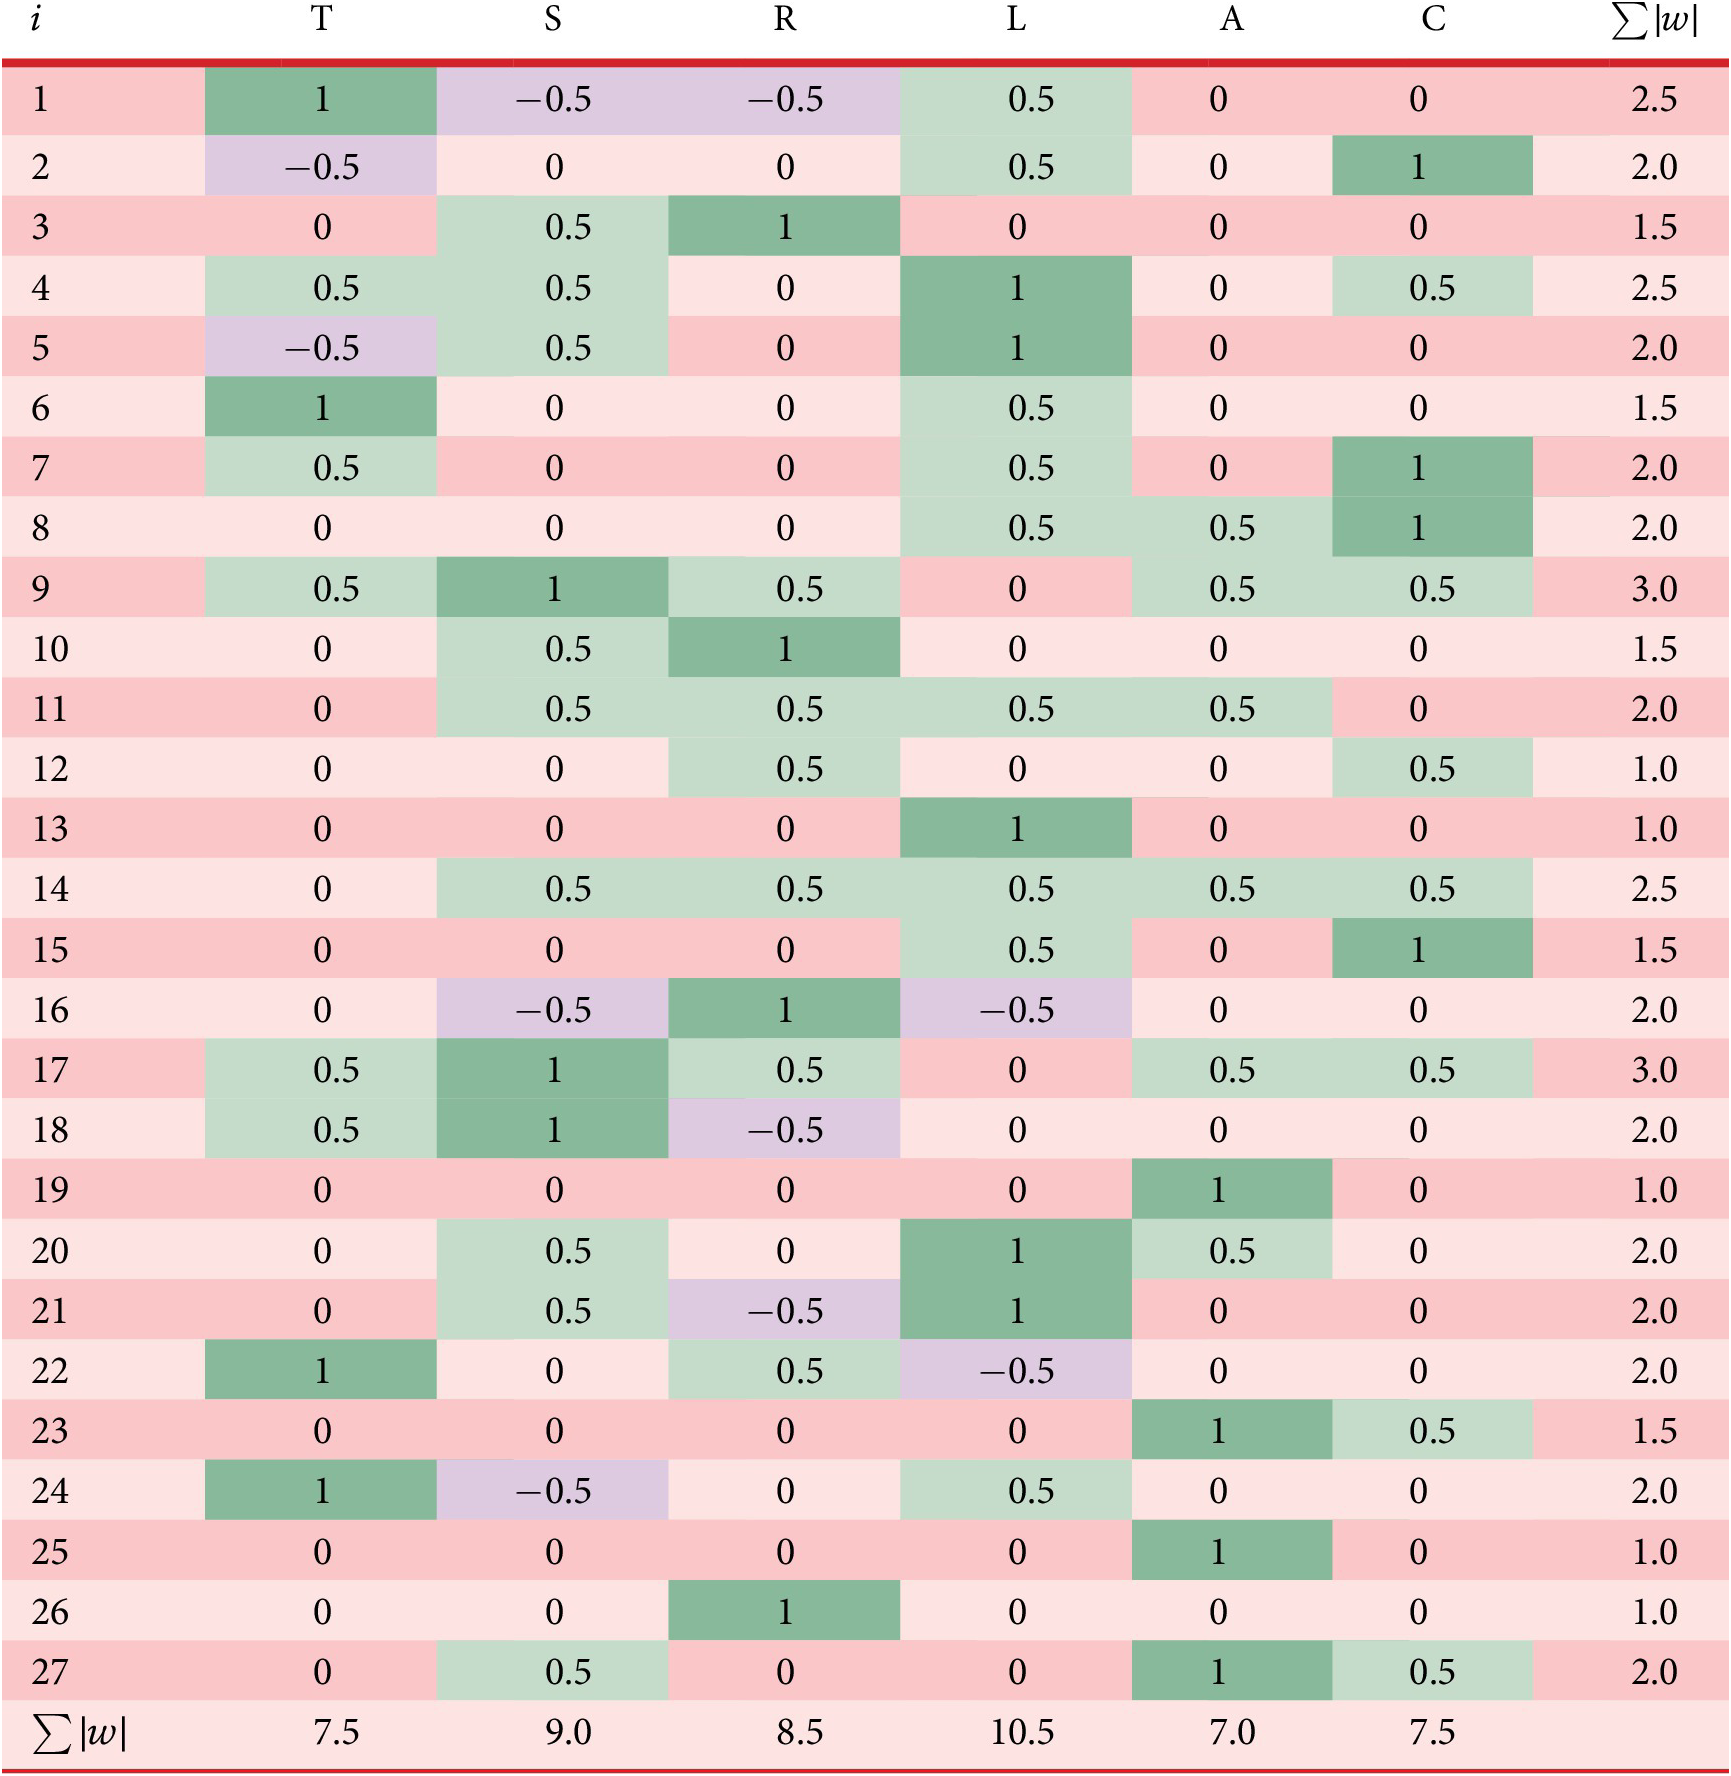
Table 3. Long description
A matrix with 27 rows (representing each prompt) and 6 columns (representing each criterion) is shown with values ranging from −1 to 1 indicating how strongly each prompt is weighted or correlated to each criterion. Along the right and bottom edges, the sum of the absolute values of the weightings for each prompt and criteria (respectively) are listed as an indicator of the overall influence on the analysis procedure. Specific values are listed in the table and electronically in the linked dataset.
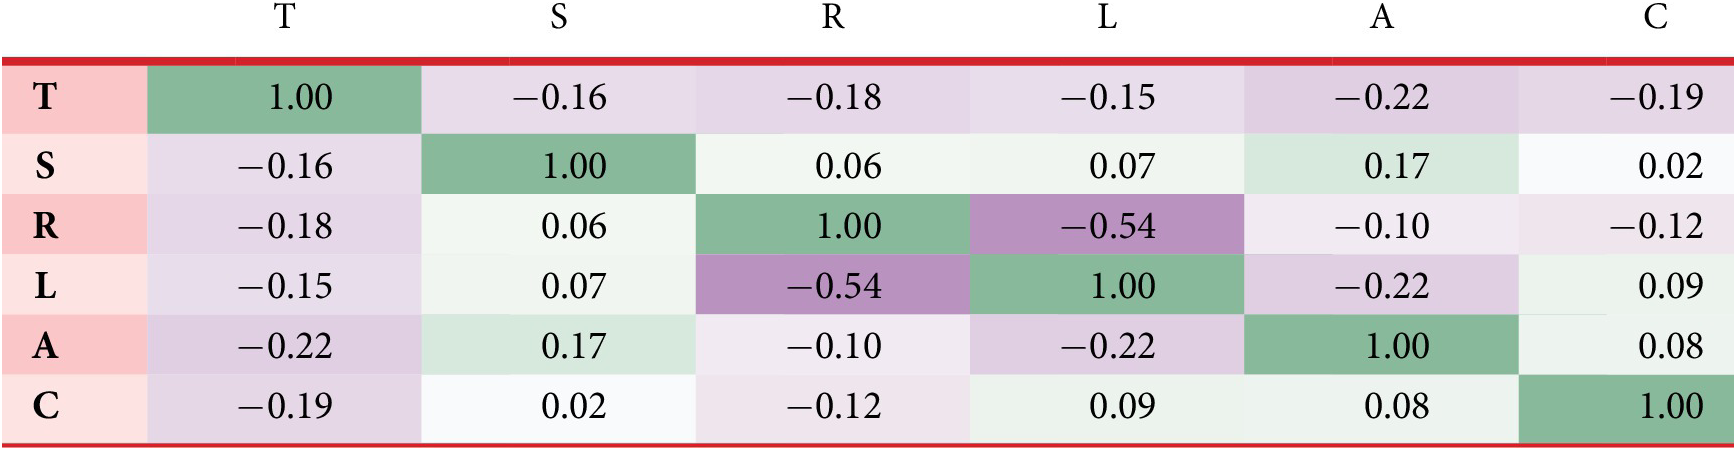
The column headers T, S, R, L, A, and C refer to the criteria time, scope, research impact, learning, alignment, and communication, respectively. The last column represents the sum of the absolute value of the weights, which indicate the relative importance of each prompt. The bottom row represents the sum over each column, and is the normalization factor used in the weighting scheme.
The scores presented in Table 3 were determined based on a combination of literature synthesis, pedagogical science, and our personal experience. Prompts suggesting a larger time commitment by the mentor are generally interpreted as benefiting research, learning, and communication but intrinsically also penalize time. We justify this by considering time as a fixed resource, so additional meetings and communication activities reduce the total amount of time remaining to complete the assigned research activities. This time penalty is particularly significant in academic research where long, uninterrupted periods of high-cognition work drive productivity. We generally interpret statements indicating that the project is easy or straightforward (e.g., prompt #1) also to be indicative of a lack of depth, or that the scope is too narrow or the research impact is only marginal. There are similar tensions between research and learning throughout the prompt list. We justify this tension as a competition for resources, such as time (e.g., if significant background learning is required, there is less time for novel experiments).
Tensions between criteria scores are quantified by the correlation coefficient
$ \rho $
 in Table 4. From the matrix, we note that most of the criteria are only weakly correlated, except as stated research impact and learning have a moderate negative correlation (
$ \rho \approx -0.54 $
 ). We also note that time has a small negative correlation with every other criterion. This is consistent with the idea that time management must compete with learning and research impacts, project scope, and effective communication.
Prompt weight correlation matrix

Table 4. Long description
A matrix with six rows and six columns (both representing the six primary criteria) is shown with each cell containing a number ranging from −1 to 1 indicating the correlation between primary criteria. Notably, “Research” and “Learning Outcome” have a modest negative correlation (−0.54) indicating the competition between these two criteria. Other criteria pairs have smaller correlations, both positive and negative, as described in the text.
We believe the weightings are largely self-explanatory and are a reasonable interpretation of the prompt statements, but we acknowledge that many researchers may not share our interpretation. We do not believe this is a significant limitation though. Since users must rank criteria they believe to be important using a corresponding set of prompts, the aggregated scores are necessarily reflective of the users’ interpretation of the prompts. However, the meta-analysis or introspection, that is, the interpretation of the six criteria scores, may not be perfectly reflective of the user’s interpretation of each criterion.
2.3. Importance and belief value determination
As described previously, the mentor first assigns an importance value to each of 27 statements as they relate to expected project success. These assigned importance values are given the label
$ {P}_i $
 , for each prompt
$ i\in \left[1..27\right] $
 , and
$ 0\le {P}_i\le 1 $
 . The importance values should not be answered with the specific project in mind but instead should be representative of the mentor’s expectation for a generic, successful URE. Next, the mentor assigns a belief value
$ {Q}_i $
 to each belief statement
$ i\in \left[1..27\right] $
 that indicates how strongly they believe the outcome to be true (
$ 0<{Q}_i\le 1 $
 ) or false (
$ -1\le {Q}_i<0 $
 ).
The individual belief values
$ {Q}_i $
 are used to evaluate the project proposal on the six primary criteria. We assume a triangular possibility distribution for each belief value with a peak at
$ {x}_{i0}={Q}_i $
 , and intercept points
$ {x}_{\pm } $
 . We use the triangular function because it is the simplest, non-trivial (or perhaps non-vacuous) possibility distribution we can define. We choose this in keeping with the spirit of “possibility” being a measure of intuition, rather than a formal mathematical statement regarding, for example, probability. The coordinates defining the possibility distributions are calculated as

and

which ensures the triangle distribution varies continuously with the input
$ {Q}_i $
 . As a result of this definition, the belief function is nonzero over the entire interval
$ \left[-1,1\right] $
 for
$ {Q}_i=0 $
 , representing a high uncertainty case. In contrast, highly believable outcomes
$ {Q}_i=\pm 1 $
 are represented by right triangles with a base width of unity. For the intermediate cases, the width of the triangle base shrinks and the peak skews toward
$ \pm 1 $
 as
$ {Q}_i\to \pm 1 $
 . Notably, since we use triangle functions, no value of
$ {Q}_i $
 represents a case of complete ignorance in which every outcome is equally believable. The case of complete ignorance would instead be represented by a square interval (Salicone Reference Salicone2007, ch. 3), which we do not permit intentionally. We choose these particular triangular distributions because they do not allow complete ignorance, and enforce a wide but smoothly varying confidence interval to temper over-interpretation of scores.
2.4. Criteria score determination
Scores for the six underlying criteria are evaluated as a weighted average using the predetermined weight matrix
$ {W}_{ij} $
 which is given in Table 3. Fuzzy variables or sets like the triangular functions we use here can be formulated as nested intervals of belief values (Nguyen & Kreinovich Reference Nguyen, Kreinovich, Kearfott and Kreinovich1996), which are described by
$ \alpha $
 -cuts, where
$ \alpha $
 represents the level of belief in the contained sub-interval. The
$ \alpha $
 -cut interval specifically corresponds to the sub-interval within which the true value lies with a necessity of
$ \left(1-\alpha \right) $
 . The necessity is a measure of how certain we are that the true value must lie inside this interval, and is a lower bound on the possibility. Since the
$ \alpha $
 -cuts are nested intervals, they follow the basic rules of interval arithmetic (Moore & Lodwick Reference Moore and Lodwick2003). It is sufficient here to only consider the points
$ {x}_{i\pm } $
 and
$ {x}_{i0} $
 , which correspond to the
$ \alpha =0 $
 and
$ \alpha =1 $
 . Since all fuzzy variables are described with triangle functions, the other
$ \alpha $
 -cut values lie on the line segments connecting
$ {x}_{\pm } $
 and
$ {x}_0 $
 . The outer (
$ \alpha =0 $
 ) interval for the variable
$ {V}_j $
 is given by

the interior (
$ \alpha =1 $
 ) interval by

and the intermediate
$ \alpha $
 -cut is given by

Note that some values of
$ {W}_{ij} $
 are negative (see Table 3). For these cases, the interval addition in Equations 2 should be replaced with interval subtraction. We mention this specifically because the algorithms for interval addition and subtraction are different (Moore & Lodwick Reference Moore and Lodwick2003).
2.5. Aggregate score determination
The importance values are used to determine relative weighting of the six criteria for an aggregate analysis. The weights
$ {w}_j $
 assigned to the six criteria are evaluated as

which uses the same weights as the scoring analysis. However, the absolute value is used here because the sign is unimportant. Whether a statement is positively or negatively correlated with an outcome does not impact the magnitude of the effect. The
$ {w}_j $
 are used to evaluate aggregate scores as described in the following.
The two aggregate scores
$ {\overline{V}}_k $
 are finally calculated from the individual scores
$ {V}_j $
 to represent measures of mentor and student outcomes. The mentor and student outcome weights are denoted
$ {\gamma}_{jk} $
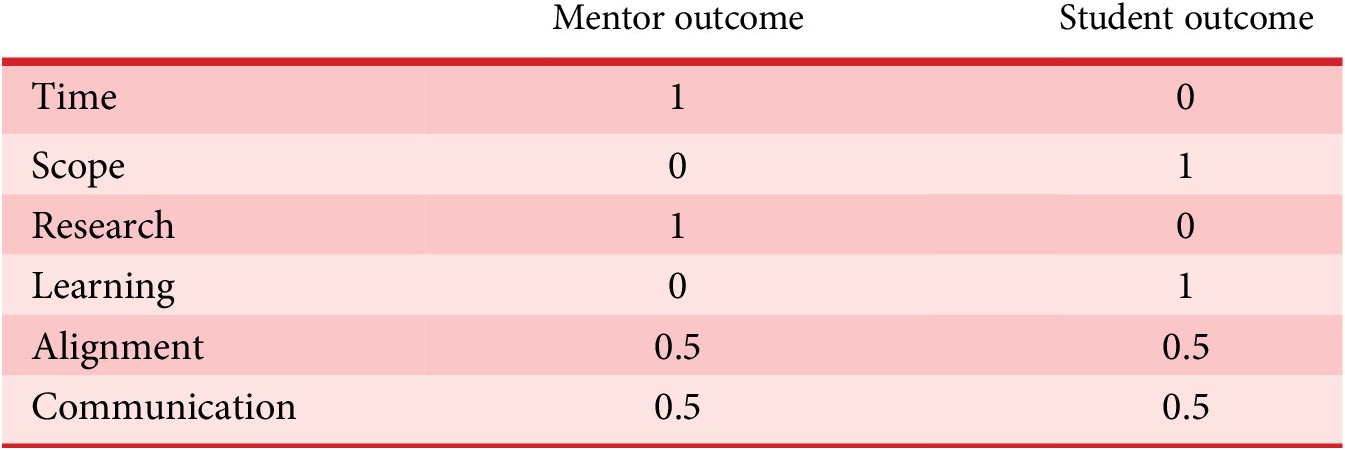
 and are listed in Table 5. In short, time and research impact determines mentor outcomes, while scope and learning dictate the student outcome score. The remaining factors communication and alignment are assumed to play a role in both outcomes, and so are included in both aggregates with reduced weights.
Weight factors
$ {\gamma}_{jk} $
 for aggregate mentor outcome and student outcome scores

Table 5. Long description
The six primary criteria scores are listed, each with two values indicating its relative contribution to the aggregate mentor and student outcome scores. The mentor outcome score is derived only from Time, Research, Alignment, and Communication with weight factors 1, 1, 0.5, and 0.5, respectively. The student outcome score is derived from Scope, Learning, Alignment, and Communication with weight factors 1, 1, 0.5, and 0.5, respectively. See the surrounding text for further discussion of these values.
The weightings for the “time” criterion specifically may seem counterintuitive but are consistent with our interpretation. Here, the “time” score is a measure of whether there is sufficient time to complete the research project. Naturally, if there is insufficient time to complete the project, the research outcomes are not realized and so “time” plays a primary role in the mentor outcome. In contrast, learning is expected to happen throughout the project period and is not necessarily contingent on completing the research project. Indeed, incomplete or inconsistent results are part of the scientific process and learning to adapt to failure is an important lesson. In contrast, “scope” refers to the variety of experiences provided by the project and more accurately characterizes opportunity for learning.
The
$ \alpha $
 -cuts of the aggregate mentor and student outcome fuzzy variables are calculated as

where
$ k\in \left[1..27\right] $
 and the
$ {\overline{V}}_k $
 correspond to the mentor outcomes and student outcomes aggregate variables, respectively. Both the individual criteria scores and aggregate values,
$ {V}_j $
 and
$ {\overline{V}}_k $
 , respectively, lie on the interval
$ \left[-1,1\right] $
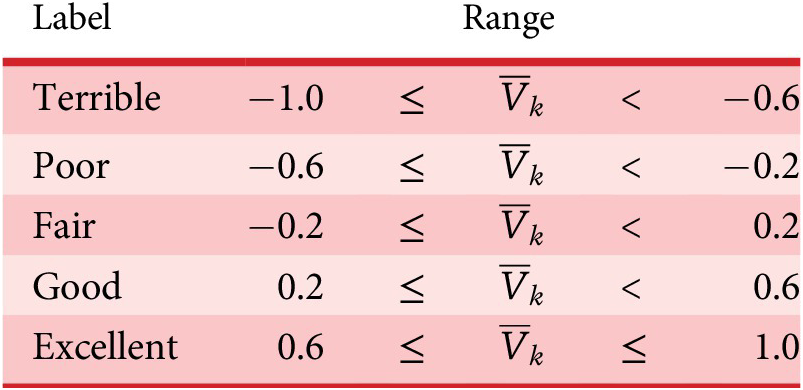
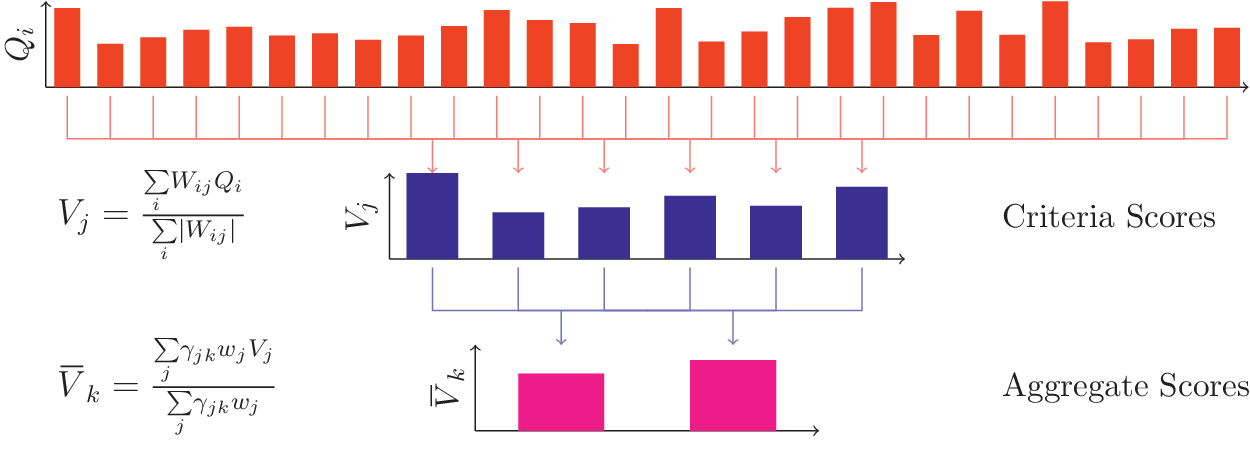
 . To aid in interpretation, we assign qualitative labels as listed in Table 6. A diagram summarizing the calculation is shown in Figure 2.
Interpretation of aggregate scores
$ {\overline{V}}_k $


Table 6. Long description
The range of scores from −1 to 1 (inclusive) is broken into five sub-ranges, each assigned an interpretive label. These labels are “Terrible” (−1 < = x < −0.6), “Poor” (−0.6 < = x < −0.2), “Fair” (−0.2 < = x < 0.2), “Good” (0.2 < = x < 0.6) and “Excellent” (0.6 < = x < = 1).
Illustration of the analysis method including two weighted-average calculations. The initial 27 prompt belief values
$ {Q}_i $
 are supplied by the user. These values are reduced to six criteria scores
$ {V}_j $
 via a weighted average. Finally, two aggregate scores
$ {\overline{V}}_k $
 are calculated as weighted averages of the six criteria scores.

3. Results
We demonstrate the rational decision-making and design approach using three example projects that were developed, implemented, and mentored by one of the authors (JMH). Two of these projects were completed successfully and are analyzed retrospectively. The third project has not yet been completed and is presented as a design exercise. For each project, we provide a brief description of the project, our score for each statement, and a brief justification for our scores. Then, we present the aggregate analysis and discuss the outcomes.
Unless otherwise specified, we will assume the importance value
$ {P}_i=1 $
 for each prompt
$ i $
 and thus
$ {w}_j=1 $
 for each criterion for the remainder of this manuscript. This is the natural choice for analysis of our own experiences, based on which the prompts were developed, and is consistent with our approach to URE mentoring. However, we include the importance weighting discussion here because we expect to observe different importance assignments across other mentors, departments, and disciplines in our future work. We also emphasize that uniform importance scores are not trivial, as they still require the user to justify the URE design with respect to each prompt.
3.1. Project descriptions
Each of the project scores
$ {Q}_i $
 is shown in Figure 3, and individual project descriptions and justifications are provided in the following paragraphs. In general, each project was designed to be conducted by a single undergraduate student over a fixed (project-dependent) duration, including necessary learning activities and preparation of deliverables.
Prompt belief values
$ {Q}_i $
 for sample projects #1, #2, and #3.

Figure 3. Long description
The values of the 27 prompt scores are plotted for each of the three sample projects from top to bottom. Most of the scores are positive, though for each case prompts #11 and #14 are −1. The actual scores are listed electronically in the linked dataset.
3.1.1. Project #1: Low-cost embedded timing generator
The first project focused on the development of an embedded timing generator to synchronize optical and electronic components for a low-cost, handheld biomedical imaging device. The project was conducted by a third-year electrical engineering student with basic skills in electronics, circuit analysis, and programming, and was scheduled to last for three months over the summer during which the student worked up to 20 hours per week. The student was responsible for meeting routinely with the research mentor, developing the software algorithm to enable independent and precise (10
$ \unicode{x03BC} $
 s) timing on four simultaneous channels. The project also required the student to construct and test the device, and write a short report detailing the development and performance.
To justify our responses, the mentor designed this project with the specific goal of designing, assembling, and testing a crucial hardware component needed for future studies. The project provided multiple hands-on learning opportunities for an electrical engineering student, including soldering, real-time computing constraints, and the Arduino platform. While this project itself is not a high-impact research study, it is a crucial component needed to enable development of a handheld biomedical imaging tool. The project scope, deliverables, and approximate timeline were developed and communicated to the student before the project was started.
3.1.2. Project #2: Biofilm radiative transfer experiments and simulation
The second project aimed to investigate radiative transfer, especially fluorescence, in bacterial biofilms. The project included experimental measurements of steady-state, en face fluorescence intensity in dense bacterial suspensions, combined with Monte Carlo simulations of radiative transfer in dense biofilms. This project was conducted by a third-year biological sciences student who had previously conducted a similar experimental project in the same lab. The student worked approximately 20 hours per week over a three-month period. During that time, the student conducted repeated experiments in the lab directly with the mentor and conducted initial simulations independently. The student also wrote a detailed report including both sets of results.
Radiative transfer theory is a broad and conceptually difficult topic to introduce at the undergraduate level, particularly in a context outside of the mathematical sciences, and within a constrained three-month timeline. However, in this case, the same student had conducted a similar project with the mentor over the previous nine months in preparation for this work. The project scope and deliverables were discussed and agreed upon with the student well in advance of the project start time.
3.1.3. Project #3: Theoretical/computational study of biomolecule fluorescence
The final project, which is ongoing, aims to use computational tools to investigate the optical properties of a range of biomolecules to design better optical detection strategies. This project will be conducted jointly by two first-year students over a nine-month period, and both students will work an average of 10 hours per week throughout that time. The first three months of the project time will focus on literature review and learning. The students will each summarize their accomplishments in a poster at the end of the project period. This project will also be supported by the undergraduate research opportunity program (UROP) at the University of Michigan which provides additional training and resources to the students outside of the laboratory.
In this case, the project is ambitious and requires significant learning. However, this is planned in advance and the student has additional support from an external undergraduate research organization (UROP). Additionally, the use of computational electronic structure tools in undergraduate chemistry courses has been reported previously to enhance learning of physical chemistry concepts (Esselman & Hill Reference Esselman and Hill2016; Snyder & Kucukkal Reference Snyder and Kucukkal2021), and significant progress has been made to minimize barriers to use these tools for teaching (William & Polik Reference William and Polik2022). We therefore expect the focus on computational methods to be beneficial to student learning and research outcomes in comparison with an experimental project. An added benefit of UROP and similar programs is that they allow potential students the opportunity to find and apply for projects that align well with their personal goals.
3.2. Project aggregate scores and outcomes
The aggregate scores are shown in Figure 4. From the figure, our possibility distributions peak with a rating of good for both mentor and student outcomes, but the confidence intervals cover a much broader range. Notably, since the possibility intervals obey interval arithmetic, averaging over multiple measures does not reduce the width of the confidence interval. Based on the analysis, we expect all of the projects are likely to succeed. Indeed, projects #1 and #2, which were completed recently, were successful by most measures. Project #1 was concluded with the development and release of a 10
$ \unicode{x03BC} $
 s precision Arduino timing generator, and Project #2 leads to the publication of a journal article after subsequent studies (Herzog, Agosta & Sick Reference Herzog, Agosta and Sick2024).
Aggregate scores and possibility intervals calculated for the three projects. The outer and inner error bars represent
$ \alpha =0 $
 and
$ 0.5 $
 , respectively, and the circles indicate
$ \alpha =1 $
 .

Figure 4. Long description
The three, two-dimensional possibility distributions produced by the analysis of the sample projects are plotted, showing the 0, 50%, and 100% possibility intervals. Each of the three variables lies in the upper right quadrant indicating fair to excellent scores. The actual scores are listed electronically in the linked dataset.
While the magnitude of the aggregate score is a useful, albeit subjective metric, the primary purpose and greater utility of this tool is to analyze and compare possible UREs. A simple ordering can be defined based on fuzzy arithmetic (Salicone Reference Salicone2007, Section 9.2) that assigns a credibility coefficient to the statement
$ A>B $
 for two fuzzy variables
$ A $
 and
$ B $
 . Note that we could also compare
$ A>x $
 where
$ x $
 is a scalar value, for example, to determine the credibility of an outcome being Good or Excellent, but this information is already evident graphically in the aggregate possibility distributions.
The three project scores were sorted according to the aggregate measures of mentor and student outcomes using this procedure, and the ordering and credibility factors are listed in Table 7. From the table, it is clear that there is significant overlap between the scores, as reflected in the credibility factors. However, despite the overlap, there is still a well-defined ordering. In particular, we find that Project #2 has the lowest measures of both mentor and student outcomes, while Project #3 has the highest scores for both mentor and student outcomes. Overall, we conclude that the proposed Project #3 has a greater student and mentor outcome score than both Projects #1 and #2.
Ordering of sample projects by aggregate mentor outcome and student outcome scores

Table 7. Long description
Each of the three projects are listed in order showing Project 3 > Project 1 > Project 2 for both student and mentor outcomes based on this analysis. Within each comparison, a credibility factor for the comparison (“>“) is shown with values of 0.24 and 0.13 for Project 3 > Project 1 and Project 1 > Project 2 (student outcome), respectively, and 0.15 and 0.35 for Project 3 > Project 1 and Project 1 > Project 2 (mentor outcome), respectively.
The value set above the ordering operator
$ > $
 is the credibility factor for the binary comparison.
4. Discussion
There are several aspects of our approach that are beneficial from a project design perspective. Since the importance factors or weightings are determined from a set of prompts that correspond directly to those on which a project proposal is evaluated, it is straightforward to perform an introspective analysis. That is, there is a mechanism through which the user can analyze their beliefs and perceptions within this framework, and identify areas that are in disagreement. Similarly, the capacity for introspective analysis and ordering operations between outcomes enable a simple and quantitative mechanism for design iteration and adaptation over time. These features are discussed in the following.
4.1. Introspection
Introspection generally refers to the process of looking inward to analyze or discover one’s beliefs and perceptions, which, in many cases, are neither transparent nor consistent (Byrne & University of Arkansas Press Reference Byrne2005). A primary utility of a multi-criteria decision-making tool, like the one presented here, is that it can objectively answer the question as to why one might expect a certain outcome. When evaluating the cause of a negative outcome, the introspection process quantifies inconsistency between beliefs and decisions. We achieve this here primarily by analyzing the weighted errors or deviations.
The weighted error or deviation of criterion
$ j $
 with respect to aggregate variable
$ k $
 is simply

where
$ {V}_j $
 (without brackets) is the average score for criterion
$ j $
 . (More strictly,
$ {V}_j $
 is the single value that represents the degenerate interval
$ \left[{V}_j\right](1) $
 .) We can similarly define the weighted error for the individual prompt score
$ i $
 with respect to criterion
$ j $
 as

where the normalization factor
$ {c}_j $
 is

which is needed to ensure that the error values sum to zero. Accordingly,

The values
$ {e}_{ij} $
 represent the contribution (in both sign and magnitude) of each prompt to a criterion score and can be used to identify the responses that most strongly impact the result. Similarly, the values
$ {\overline{e}}_{jk} $
 represent the contribution of each criterion score
$ j $
 to the aggregate score
$ k $
 . Values of
$ {e}_{ij} $
 and
$ {\overline{e}}_{jk} $
 that are the most negative may indicate prompts or criteria, respectively, for which beliefs and expectations are misaligned.
For example, considering Project #3, we find that the most negative values of
$ {\overline{e}}_{jk} $
 correspond to Research Impact and Scope for the mentor outcome and student outcome aggregate scores, respectively. This analysis suggests that it may be beneficial to focus on improving research impact and scope as the project evolves. Now, considering the individual prompt scores for these two categories (
$ {e}_{ij} $
 ), we find that the most negative contributions to both categories come from prompts 11 and 14, or rather, that we do not expect any journal or conference publications from this project. Publications and conference presentations are an integral part of scientific research, so excluding these activities certainly does limit the scope of activities and may be evidence of a lower-impact research outcome. As this is a preliminary study, and since the student will have other opportunities for scientific writing and presentation within this project, we believe this is an acceptable trade-off.
When aggregate or criterion scores are relatively low, these weighted errors can identify areas for improvement. For example, we could alter the project description to better match our expectations. Alternatively, we could re-evaluate how we assess the importance prompts. In either case, this provides a clear mechanism for introspection in the decision-making process. However, it is worth noting that there will always be at least one value of
$ {e}_{ij} $
 and
$ {\overline{e}}_{jk} $
 that is negative. So while these values do identify prompts or criteria that lower the aggregate scores, they are not always a good indicator of inconsistency. Finally, it is worth noting that this analysis was performed for
$ \alpha =1 $
 cut as it represents the most plausible outcome. However, the analysis can be extended easily to consider a confidence interval by replacing the values
$ {V}_j $
 ,
$ {\overline{V}}_k $
 , and
$ {Q}_i $
 with their corresponding fuzzy variables or
$ \alpha $
 -cuts.
4.2. Project design, iteration, and adaptation
Iteration is an import and often necessary component of the design process that must be managed for any complicated system (Wynn & Eckert Reference Wynn and Eckert2017). We also believe this is true in education generally and in UREs specifically. As the project progresses and more evidence of an outcome is collected, the project should be reevaluated to assess whether it still satisfies our goals. An iterative procedure for URE design and adaption is straightforward to define. The mentor first analyzes the URE as described in Section 2. Then, the mentor adapts the project proposal based on the individual criteria and aggregate scores. The mentor may use the introspective analysis results as a guide. Finally, the mentor updates scores
$ {Q}_i $
 to reflect the changes, while keeping the importance values fixed to ensure scores are directly comparable. The individual criteria and aggregate scores can then be compared between projected outcomes using the fuzzy ordering operator
$ > $
 . This procedure should be used for iterative design to refine the project early on in the planning phase. It can also be used to adapt to changes in the project based on new evidence as the project progresses, and ideally would be performed at fixed intervals. As this procedure is an example of a rational, multi-criteria decision-making analysis, we emphasize that changes in responses should reflect only concrete new evidence.
For example, in our sample Project #3, we may decide we could improve the research experience by trying to incorporate a conference presentation or publication opportunity. The University of Michigan Undergraduate Research Journal (UMURJ) is a student-run research journal that publishes articles written exclusively by undergraduate students. Publication in UMURJ would have the dual benefit of providing a good learning opportunity for the student, and could help to communicate the research results to other researchers and students on campus. We could then adapt the project proposal to include a short article in UMURJ as a deliverable at the end of the project. Similar opportunities exist for undergraduate conference presentations. Including these as uncertain stretch goals (i.e., choosing
$ {Q}_{11}={Q}_{14}=0 $
 ), and assuming that no other responses are impacted by this decision, we find that the aggregate scores of mentor and student outcomes are increased with credibility factors of
$ \sim 0.19 $
 and
$ \sim 0.14 $
 , respectively.
4.3. Outlook and future work
It is evident that qualitative differences in projects, such as the type of work being conducted (e.g., laboratory, computational, literature review, etc.), may have a significant influence on the outcome. Further, uncontrollable factors, like project duration which is in many cases tied to the academic calendar, may also influence scores. Both of these behaviors are expected and intentional. The former case is likely a reflection of the mentor’s preferences and expectations (or perhaps biases). In the latter case, “uncontrollable” factors are an important consideration in project management and indeed should also influence a project score. However, care must be taken to interpret results as these uncontrollable factors or constraints change, since the mentors’ assessment of research utility and learning outcomes are made relative to this context.
Further, the sample projects presented here were mentored only by the authors, and the projects were analyzed by a single mentor for consistency. This is intentional and consistent with the framework as scores are determined relative to the mentor’s beliefs and expectations. However, as a result, the scores and potential utility of this framework to design and improve UREs necessarily depend on the experiences and expectations of the mentor, as well as context of the project. We mitigate this dependence by including user-defined weighting through the importance prompts, though larger-scale validation remains as future work. Current efforts are focused on working with undergraduate research programs like UROP to implement this methodology across a large, interdisciplinary group of mentors within a controlled context to evaluate both mentor expectations and the utility of the proposed framework in URE planning and design.
5. Conclusion
In this manuscript, a rational, multi-criteria decision-making tool for planning project-based mentoring experiences was developed and analyzed in detail, focusing primarily on undergraduate research experiences (UREs). Six criteria were identified and scored including time or duration, project scope, research impact, learning outcomes, communication, and mentor–student alignment. The six criteria are evaluated based on the mentor’s judgment of the project proposal in regard to a set of 27 prompts. The belief values are then used to estimate aggregate scores, representing mentor and student outcomes, using possibility theory to interpret and propagate uncertainty. The final scores are represented by fuzzy variables that can be interpreted on an absolute basis (relative to the mentor’s experience) or on a relative basis to compare several projects or iterations. We demonstrate the tool by analyzing two recent projects retrospectively and one ongoing project, and compare the aggregate scores. We additionally describe the use of the tool for introspection, or to identify inconsistencies between the mentor’s expectations and beliefs, and an iterative procedure to design or adapt a project as evidence or expectations change. While our demonstration represents only a small case study, we are hopeful that wider use will shed some light on the expectations of URE mentors across disciplines and career stages, and help more researchers to confidently incorporate undergraduate students into their research activities.
Data availability statement
The dataset supporting the conclusions of this article is available in the figshare repository, https://doi.org/10.6084/m9.figshare.27732216 (Herzog, McCord & Sick Reference Herzog, McCord and Sick2025). Raw data, plots, and code, in addition to a full-featured HTML/javascript web app that implements this methodology, are included in the repository.
Acknowledgments
We thank Dr. Michelle Ferrez for useful discussions and insightful feedback on the first manuscript draft. We also thank the students who participated in the three example projects discussed in this paper for their various and multiple contributions to our ongoing research.
Author contribution
Conceptualization (lead): J.M.H.; Conceptualization (supporting): S.M. and V.S.; Data curation: J.M.H.; Formal analysis: J.M.H.; Funding acquisition: V.S.; Investigation: J.M.H.; Methodology (lead): J.M.H.; Methodology (supporting): S.M. and V.S.; Project administration: J.M.H.; Resources: J.M.H.; Software: J.M.H.; Supervision: V.S.; Validation (lead): J.M.H.; Validation (supporting): S.M.; Visualization: J.M.H.; Writing – Original Draft: J.M.H.; Writing – Review & Editing (equal): J.M.H., S.M., and V.S.
Financial support
The authors received no external funding specific to this work.
Competing interests
The authors declare that they have no competing interests.








 Open access

