1. Introduction
The class of blue supergiants (BSGs) consists of objects that span an appreciable fraction of the massive star lifetime between the main sequence and the pre-supernova stages. The observed population statistics of BSGs (e.g. Castro et al. Reference Castro2014), however, contradict the expectations of the standard evolutionary theory (Bellinger et al. Reference Bellinger2024), highlighting the need to revisit the origin and evolutionary state of these objects. In support of the latter aim, the study of BSG variability provides robust diagnostics of the stellar structure and wind, setting valuable constraints on the physics of the post-main-sequence evolution and facilitating the classification of the respective counterparts. Motivated by this potential, we conducted a variability study of Galactic B-type BSGs and explored associations between their well-determined physical parameters and the features of their time and frequency domain.
2. Methodology
We undertook a study of 41 BSGs in the Galaxy with determined spectroscopic parameters (Fraser et al. Reference Fraser2010) using TESS data from sectors
 $5-66$
(Ricker et al. Reference Ricker2015). Both pre-processed (PDCSAP) and our own extracted/corrected fluxes were explored, taking into account possible contamination effects in the TESS aperture. The light curves were de-trended and normalized, and consecutive sectors were joined into larger observing windows. The entirety of the studied data are available on the Zenodo repository.Footnote †
We described the time domain of the stars by means of three statistical measures: the standard deviation
 $\sigma$
, the coherency parameter (
 $\psi^2$
), and the skewness, to assess the degree of scatter, stochasticity, and asymmetry of the light curves. In the frequency domain, we extracted prominent frequencies via an iterative pre-whitening process and modeled the background signal –so called stochastic low-frequency (SLF) variability– that manifests ubiquitously in all amplitude spectra. The luminosities of the stars were calculated from the modeling of their spectral energy distribution. We assessed correlations between the variability and stellar parameters by calculating the Pearson’s correlation coefficient r, with a
 $p-$
value significance.
3. Results
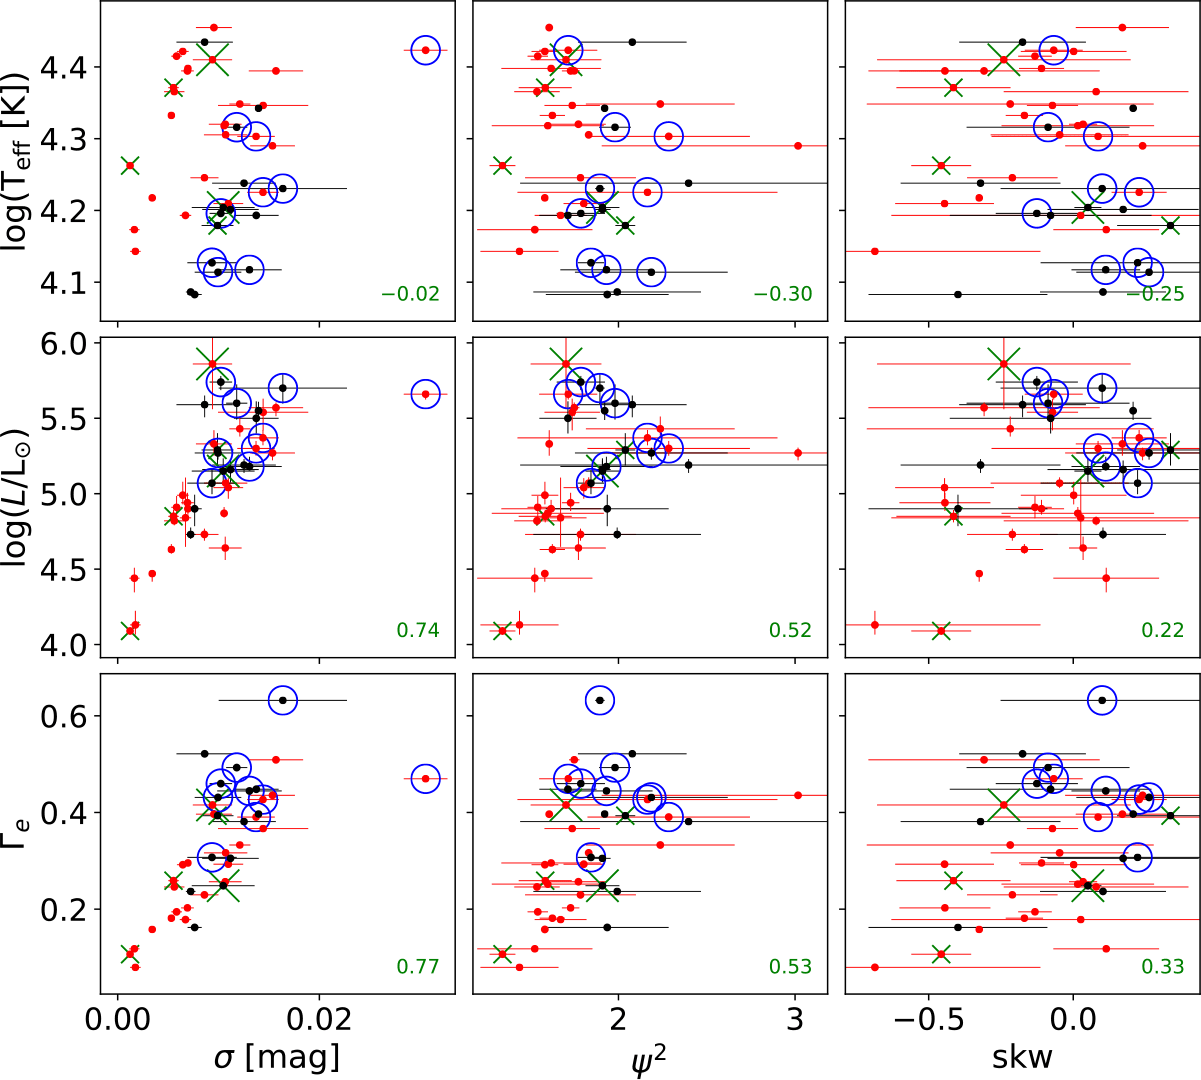
We found a strong positive correlation between
 $\sigma$
and log (
 $L/L_{\odot}$
) (
 $r=0.74$
,
 $p\lt0.0001$
); the more luminous BSGs display greater variability amplitudes (Fig. 1). The frequencies of the less massive stars comply with their rotational periods (red markers; Fig. 1), attributing their variability to surface spots or clumped winds. A positive correlation is also seen between
 $\psi^2$
and log (L/L
 $_{\odot})$
(
 $r=0.52$
,
 $p\lt0.001$
), indicating that the more luminous variables possess smooth light curves with a higher degree of coherency (yet with larger fluctuations across the different sectors) compared to less luminous objects. The positive trend between the Eddington factor
 $\Gamma_{e}$
and the skewness (
 $r=0.33$
,
 $p=0.04$
) implies that younger and less massive BSGs display short-term brightening, being indicative of wind, line-driven, instabilities (Krtička & Feldmeier Reference Krtička and Feldmeier2021). Less bound to the above trends are several of the
 $\alpha$
Cygni variables (outer circles; Fig. 1), stars widely claimed to be post-red supergiants (post-RSGs). The irregularity in their light curves follows the inhomogeneity in the excitation mechanisms of their pulsations, these including oscillatory convection modes and radial strange modes (Saio et al. Reference Saio2013).
Stellar parameters of the sample BSGs against their time-domain statistics. Red points indicate the candidate rotating variables; the outer circles the
 $\alpha$
Cygni ones. Taken from Kourniotis et al. (Reference Kourniotis2025).

Figure 1 Long description
Panel A: Scatter plot of log(T_eff [K]) versus sigma [mag]. Panel B: Scatter plot of log(T_eff [K]) versus psi squared. Panel C: Scatter plot of log(T_eff [K]) versus skw. Panel D: Scatter plot of log(L/L_sun) versus sigma [mag]. Panel E: Scatter plot of log(L/L_sun) versus psi squared. Panel F: Scatter plot of log(L/L_sun) versus skw. Panel G: Scatter plot of F_e versus sigma [mag]. Panel H: Scatter plot of F_e versus psi squared. Panel I: Scatter plot of F_e versus skw. Each panel includes red points indicating candidate rotating variables and blue circles indicating alpha Cygni variables.
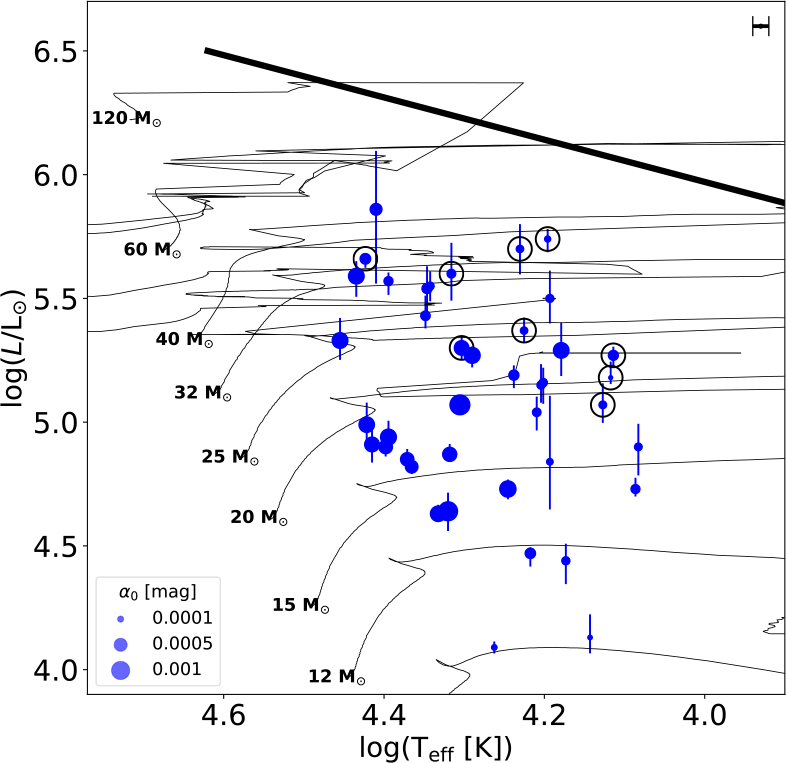
We locate our studied objects in the Hertzsprung-Russell diagram (Fig. 2) and superimpose them on models of stellar evolution at solar metallicity (Ekström et al. Reference Ekström2012). The
 $\alpha$
Cygni variables are in good agreement with their definition of post-RSGs, meaning they span tracks that suggest blueward evolution (
 $5.0\lesssim{\rm log}(L/L_{\odot})\lesssim5.8$
). We report a significant trend between the SLF variability amplitude
 $\alpha_{0}$
and log
 $T_{\rm eff}$
(
 $r=0.59$
,
 $p\lt0.0001)$
, showing that the background signal is pronounced at the earlier stages of evolution and drops as the stars age.
Hertzsprung-Russell diagram for rotating massive stars at solar metallicity (Ekström et al. Reference Ekström2012). The marker size of our sample stars is proportional to the SLF variability amplitude. Taken from Kourniotis et al. (Reference Kourniotis2025).

4. Discussion and Concluding Remarks
Our study of post-main-sequence BSGs (Kourniotis et al. Reference Kourniotis2025) complements studies on earlier-type objects (Bowman et al. Reference Bowman2020; Shen et al. Reference Shen2024) showing that the SLF variability is amplified at or shortly after the end of the main-sequence phase. Less plausible is the scenario that the signal is generated by subsurface convection zones driven by the iron opacity peak, as it would raise expectations for amplification towards the upper cool evolutionary diagram (Cantiello et al. Reference Cantiello2021) which, however, does not comply with the current picture (Fig. 2). On the other hand, when confining ourselves to lower luminosities that exclude the
 $\alpha$
Cygni variables, we found a weak positive trend between
 $\alpha_{0}$
and the stellar luminosity/mass (see Fig. 10 in Kourniotis et al. Reference Kourniotis2025). The latter trend is similar to that of BSGs in the Large Magellanic Cloud (Bowman et al. Reference Bowman2019), attributing the debated signal possibly to a metallicity-independent mechanism.
To improve mapping of the BSG variability across the evolutionary diagram, an exploration of a large statistical sample using machine learning is ongoing (Kourniotis et al. in prep.).
Acknowledgements
Funded by the European Union (Project 101183150 – “OCEANS”) and the Czech Science Foundation (GAČR grant number 25-17532S). LC acknowledges financial support from CONICET (PIP 1337) and the University of La Plata (Programa de Incentivos 11/G160). The Astronomical Institute Ondřejov is supported by RVO:67985815. MRD and AAA acknowledge support from a CONICET fellowship.


 α