Implications
Milk that shows stability to the ethanol test below the expected standards is considered unsuitable for industrialization procedures and is rejected by the dairy industry, reducing the income to farmers. In many cases these are unaware of the problem. Stability may be affected by milk properties and natural and uncontrolled variations. Management factors such as feeding level influence milk stability through mechanisms yet unclear. As feeding shortages are common in underdeveloped countries, the elucidation of the link between feeding levels and milk stability reduction can help milk farmers and technical assistants to choose the adequate management procedures to minimize this problem.
Introduction
The alcohol test may be used as a reliable indicator of raw milk stability for ultra-high temperature and milk powder processing (Boumpa et al., Reference Boumpa, Tsioulpas, Grandison and Lewis2008; Omoarukhe et al., Reference Omoarukhe, On-Nom, Grandison and Lewis2010). Usually, excessive acidity has been considered as the main factor leading to reduced stability, but as 40% to 50% of milk samples presenting acidity within acceptable values (pH: 6.6 to 6.8 or titratable acidity: 14 to 18°D) still precipitated to the alcohol test, other issues may be acting on this (Oliveira et al., Reference Oliveira, Lopes, Franco and Corassin2011). Ethanol stability is related to physical–chemical properties, such as pH, saline balance and divalent cation content (White and Davies, Reference White and Davies1958; Horne and Parker, Reference Horne and Parker1981; Chavez et al., Reference Chavez, Negri and Cuatrín2004). It has been reported that some factors decrease milk stability such as sudden changes in animals’ diet and underfeeding (Zanela et al., Reference Zanela, Fischer and Ribeiro2006; Marques et al., Reference Marques, Fischer, Zanela, Ribeiro, Stumpf and Manzke2010) as well as metabolic acidosis (Marques et al., Reference Marques, Fischer, Zanela, Ribeiro, Stumpf and Rodrigues2011). In underdeveloped countries, underfeeding is quite prevalent because of low resource input in animal production systems, with variable but often little use of irrigation, food conservation (silage or hay), soil correction and fertilization, and these might be relevant causes of milk instability. However, trials performed to assess the relation between underfeeding and milk stability have not evaluated how this relation occurs. In most of these countries, milk suitability for industrial processing is still performed with an alcohol test at farm and dairy industry platform level. Milk that precipitates in this test should not be transported to the industry (Ministério da Agricultura Pecuária e Abastecimento, 2011), impairing dairy competitiveness and sustainability.
On the basis of studies that evaluate the relationships of stress with mammary gland physiology and histology, we hypothesize that severe feed restriction is a stressful factor that increases the permeability of the mammary tight junctions (TJ) and decreases ethanol stability. TJs are structures located in the cell's apical domain, surrounding both endothelial and epithelial cells (Stelwagen et al., Reference Stelwagen, Van Espen, Verkerk, McFadden and Farr1998a), with the so-called fence and barrier functions. They play an important role in maintaining cell–cell contact (Pitelka, 1978; cited by Zettl et al., Reference Zettl, Sjaastad, Riskin, Parry, Machen and Firestone1992), separating its basolateral (interstitial fluid) and apical (alveolar lumen) sides (Schneeberger and Lynch, Reference Schneeberger and Lynch1992) and controlling the paracellular movement of ions and small molecules between two fluid compartments (Stelwagen et al., Reference Stelwagen, Van Espen, Verkerk, McFadden and Farr1998a). TJs are impermeable when in perfect condition, not allowing the influx of components from blood into milk, and vice-versa (Stelwagen et al., Reference Stelwagen, Van Espen, Verkerk, McFadden and Farr1998a). In spite of this, several factors, such as stress (Stelwagen et al., Reference Stelwagen, Hopstert, Van Der Werf and Blokhuist2000), mammary involution at the end of lactation (Fleet and Peaker, Reference Fleet and Peaker1978), longer milking intervals (Stelwagen et al., Reference Stelwagen, Davis, Farr and Eichler1994) and mastitis (Leitner et al., Reference Leitner, Chaffer, Shamay, Shapiro, Merin, Ezra, Saran and Silanikove2004) can alter TJ impermeability. By changing this impermeability, the main characteristics of TJ are lost, altering milk basic composition, especially saline balance, which can eventually lead to modifications in milk stability. Lacy-Hulbert et al. (Reference Lacy-Hulbert, Woolford, Nicholas, Prosser and Stelwagen1999) did not find increased TJ permeability after 50% feed restriction, but these authors used cows in an advanced milking stage (over 210 days in milk) and measured the effects over 25 days after the beginning of the restriction.
The present study was conducted to establish the relationships between severe feed restriction, TJ permeability and milk stability to the alcohol test with cows in mid-lactation.
Material and methods
Local description, animals and management
The experiment was conducted in 2011 at Capão do Leão, Rio Grande do Sul, Brazil and was approved by both the Research Committee and Ethical Committee for Animal Use of the Federal University of Rio Grande do Sul. Average daily temperature and relative humidity ranged from 19.8°C to 29.8°C and from 58.2% to 91.54%, respectively.
Twelve Jersey cows were housed during the 5 weeks of experiment. They received diets that met their nutritional demands (full diet, according to National Research Council, 2001) during weeks 1, 2, 4 and 5. During the 3rd week (experimental days 15 to 21) they were allocated into two groups of six cows each: (1) full diet and (2) restricted diet: cows were fed 50% of previous feed levels. At the beginning of the 3rd week, before feed restriction, cows on the full diet showed 372 ± 33 kg BW; 2.6 ± 0.12 body condition score (BCS); milk stability at alcohol 77.0 ± 4% v/v; 145 ± 44 days in milk, 12.3 ± 2.5 l/day milk production and 3.2 ± 1.7 lactation periods. Cows in the restricted feed group showed an average BW of 372 ± 39 kg; 2.7 ± 0.10 of BCS; milk stability at alcohol 75.2 ± 4% v/v; 145 ± 39 days in milk; 12.1 ± 2.4 l/day milk production and 3.3 ± 1.5 lactation periods. Full diet was composed of (per animal and per day) 15 kg sugar cane silage; 5.8 kg alfalfa hay; 0.16 kg mineral salt and 6.2 kg concentrate (3.3 kg soybean; 2.6 kg corn; 240 g bicalcic phosphate and 14 g CaCO3). Cows were fed twice a day, after the morning and evening milkings, and had free access to fresh water.
BW and BCS
BCS was attributed on a 1 to 5 scale (Wildman et al., Reference Wildman, Jones, Wagner, Boman, Troutt and Lesch1982), and cows were weighed on experimental days 1, 14, 21 and 35, immediately after morning milking but before being fed.
Milk collection and analysis
Cows were milked twice daily (at 0700 and 1630 h) in a 2 × 8 herringbone milking parlor equipped with Westfalia milking units. Daily milk yield was recorded electronically. Milk was collected on days 14, 15, 17, 18, 21, 28 and 35 after the beginning of the experiment. A mixture of milk from morning and evening milkings from each cow composed the individual samples. Acidity was determined by titration with 0.1 N NaOH solution and by potentiometry; density was measured with the use of lactodensimeter corrected for milk temperature of 15°C; ethanol stability checked by mixing 2 ml of milk and 2 ml of alcoholic solutions with ethanol concentration varying from 68% to 84% v/v in a Petri dish; results were expressed as the minimal ethanol concentration in the alcoholic solution that induced milk coagulation. To determine the permeability of mammary gland cell TJs, sodium in milk was measured by atomic absorption spectrophotometry from milk collected in 45 ml Falcon tubes. Concentrations of fat, protein and lactose in milk were determined by an infrared analyzer (Bentley 2000® Equipment (Chaska, Minnesota, USA)). Somatic cell count (SCC) was determined by flow cytometry with Somacount 300® (Bentley Instruments, Chaska, Minnesota, USA).
Blood collection and plasma analysis
Blood samples were collected on days 14, 15, 17, 18, 21, 28 and 35 after the beginning of the trial via jugular puncture in 10 ml heparinized and non-heparinized vacutainers. Sampling was performed after the morning milking and before feeding procedures. Blood samples were cooled on wet ice, centrifuged (Fanem, model 204NR) at 2000 × g for 15 min. Plasma was aliquoted into 2.0 ml Eppendorf tubes and stored at −20°C until analysis. The permeability of the TJ was determined using plasma from heparinized vacutainers to determine lactose using enzymatic assay (Lactose Assay Kit – BioVision Research Products, Mountainview, CA, USA) in a microplate reader (Bio-Tek Instruments, model EL808 Microplate Reader (Winooski, USA)). To assess the stress level of the animals, plasma from non-heparinized vacutainers was analyzed for cortisol levels by chemiluminescence.
Statistical analysis
Individual cows were considered the experimental units and were allocated to one of two treatments (full amount of food or 50% restriction) in a completely randomized design. Data (84 observations for milk productions and composition, 48 observations for blood composition, BW and BCS) were analyzed with multivariate analyses using the statistic program SAS (Statistical Analysis Systems, 2008) including principal factor (PF) and cluster analysis, canonical discriminant analysis of clusters and multiple correspondence analysis. In this last analysis, the threshold values used to categorize each animal into the ‘high or low’ categories were: 0.52 μg/dl for cortisol; 150 for days in milk; 10 l per day for milk production; 4 g/100 g, 3.46 g/100 g, 4.4 g/100 g and 493 ppm for milk fat, protein, lactose and sodium, respectively; 100 000 cell/ml for SCC; 230 μM for plasma lactose; 72% v/v ethanol for milk stability. Clusters were submitted to ANOVA to highlight the differences for all attributes among them. As one of the clusters formed was basically composed of three observations of the same cow, its values were not used in the statistical analysis for cluster comparison. Univariate ANOVA was performed with attributes not included into multivariate analyses, whenever they were considered necessary to support further discussion, for example BCS.
Results
The univariate analysis of BCS showed that cows from restriction group lost BCS between the first and the last day of feeding restriction (days 15 and 21, respectively; 2.70 v. 2.45, respectively; P < 0.05), whereas cows receiving full diet did not substantially change their BCS during the same period (2.75 v. 2.66, respectively; P > 0.05).
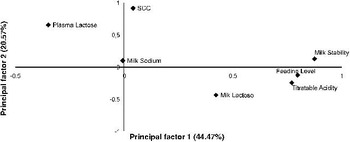
When examining data by the multivariate analysis, seven PFs were identified and the first two explained 44.47% and 20.57%, respectively, of the total variance observed in the experiment. Considerations can be made through the analysis of the angle between vectors in the PF figure (Figure 1). Angles of 0° and 180° mean that the correlations between variables are high, positive in the first case and negative in the second; 90° between variable vectors represents low or null correlations (Smith et al., Reference Smith, Moreira and Latrille2002).
Variables (plasma lactose, somatic cell count, milk sodium, milk stability, milk lactose, feeding level and titratable acidity) projected in principal factors 1 and 2.

Feeding level presented highly positive correlation with milk stability and titratable acidity. Plasma lactose, on the other hand, showed negative correlation with feeding level, but positive with milk sodium. Milk lactose presented some positive correlation with feeding level and milk stability, as the angle between them is ∼45°; the angle of ∼180° between milk lactose and plasma lactose indicates their high negative correlation. SCC presented very low correlation with level of feeding and milk stability, high correlation with milk sodium and moderate correlation with plasma lactose.
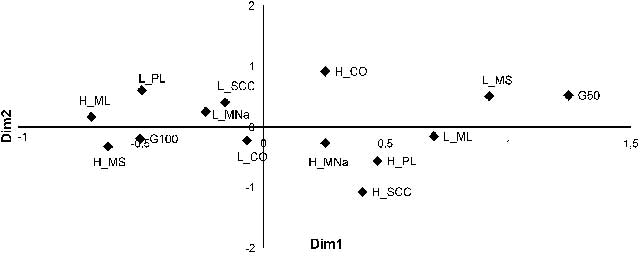
In Figure 2, in the first quadrant, feeding restriction (G50) was highly related to ethanol stability <72% v/v (L_MS) and cortisol levels above 0.52 μg/dl (H_CO), whereas in the second quadrant plasma lactose higher than 230 μM (H_PL) was associated with SCC above 100 000 cell/ml (H_SCC), milk sodium higher than 493 ppm (H_MNa) and milk lactose below 4.4 g/100 g (L_ML). In the third quadrant, full diet (G100) was associated with ethanol stability higher than 72% v/v (H_MS) and cortisol below 0.52 μg/dl (L_CO), whereas in the fourth quadrant low plasma lactose – below 230 μM (L_PL) was associated with milk lactose higher than 4.4 g/100 g (H_ML), milk sodium below 493 ppm (L_MNa) and SCC lower than 100 000 cell/ml (L_SCC).
Correspondence graphic relating high (G100) or low feeding levels (G50) with high (H_MS) or low milk stability to the ethanol test (L_MS), high (H_SCC) or low somatic cell count (L_SCC), high (H_ML) or low lactose in milk (L_ML), high (H_MNa) or low sodium concentration (L_MNa), high (H_PL) or low plasma lactose (L_PL) and high (H_CO) or low cortisol levels (L_CO).
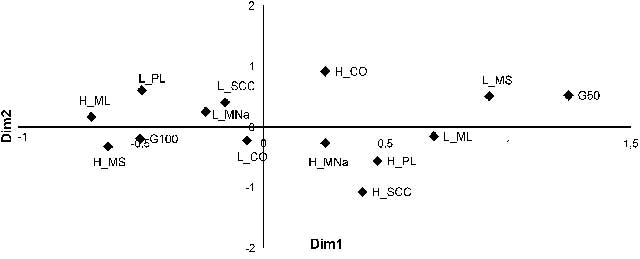
Another way to interpret those results is by the description of the axes. In this case, and in accordance with PFA, feeding restriction (G50) was associated with low ethanol stability (L_MS) and milk lactose concentration (L_ML), high plasma lactose concentration (H_PL), sodium in milk (H_MNa), SCC (H_SCC) and cortisol levels (H_CO) (Figure 2, quadrants 1 and 2). A full diet (G100) was associated with high ethanol stability (H_MS) and milk lactose concentration (H_ML), low milk sodium (L_MNa) and plasma lactose concentration (L_PL) (quadrants 3 and 4). Low SCC (L_SCC) and cortisol levels (L_CO), because of its proximity to the vertical axis, present weak association with G100. Although less important, different correspondences can be made when analyzing quadrants 1 and 4; 2 and 3 together. Feeding level influenced a smaller number of animals in a distinctive way: feeding restriction (G50) (quadrants 1 and 4) was associated, besides high cortisol levels (H_CO) and low ethanol stability (L_MS), with some cows presenting SCC below 100 000 cell/ml (L_SCC), low concentration of milk sodium (L_MNa) and plasma lactose (L_PL). Some cows producing milk with high ethanol stability (H_MS) presented cortisol levels lower than 0.52 μg/dl (L_CO), high plasma lactose (H_PL), milk sodium (H_MNa) and SCC (H_SCC) (quadrants 2 and 3).
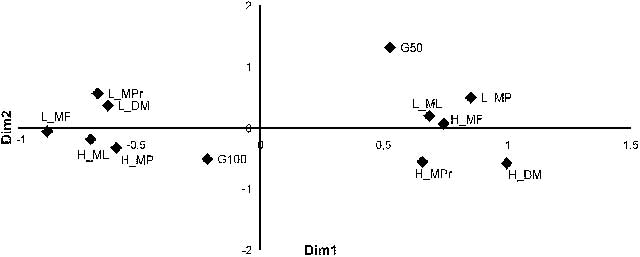
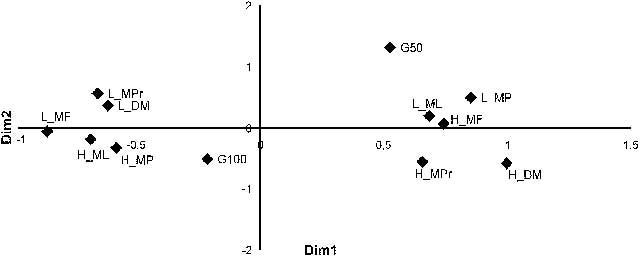
In Figure 3, in the first quadrant, feeding restriction (G50) was highly related to low milk lactose (L_ML), daily milk production below 10 l (L_MP), milk fat concentration higher than 4 g/100 g (H_MF), whereas in the second quadrant cows with more than 150 days in milk (H_DM) were associated with milk protein higher than 3.46 g/100 g (H_MPr). In the third quadrant, cows fed full diet (G100) were associated with milk yield higher than 10 l per day (H_MP), fat concentrations below 4 g/100 g (L_MF) and high milk lactose (H_ML). The fourth quadrant shows association between animals below 150 days in milk (L_DM) with milk protein lower than 3.46 g/100 g (L_MPr). When analyzing the information in Figure 3 by axes, it could be noticed that there is an association between feed restriction (G50), low milk lactose (L_ML) and milk production (L_MP), high milk protein (H_MPr), fat (H_MF) and days in milk (H_DM) when analyzing quadrants 1 and 2. In quadrants 3 and 4, cows receiving full diet (G100) were associated with reduced number of days in milk (L_DM), low fat (L_MF) and protein in milk (L_MPr), high milk production (H_MP) and milk lactose (H_ML). In quadrants 1 and 4, some cows submitted to the feeding restriction (G50) showed low concentrations of milk protein (L_MPr) and lower number of days in milk (L_DM) and in quadrants 2 and 3 some cows receiving the full diet (G100) produced more than 10 l (H_MP), presented higher values for milk protein (H_MPr) and number of days in milk (H_DM).
Correspondence graphic relating high (G100) or low feeding levels (G50) with high (H_MP) or low milk production (L_MP), high (H_ML) or low lactose in milk (L_ML), high (H_MF) or low milk fat (L_MF), high (H_MPr) or low milk protein (L_MPr) and high (H_DM) or low days in milk (L_DM).
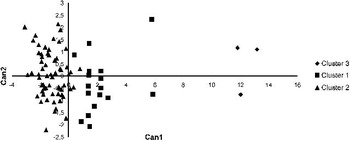
Observations were grouped into clusters 1, 2 and 3, with 17, 64 and 3 observations, respectively (Figure 4). All 84 observations were grouped with 100% accuracy. Attributes chosen by discriminant analysis for cluster discrimination were plasma lactose, stability to the alcohol test and milk pH.
Discrimination of clusters 1, 2 and 3, with 17, 64 and 3 observations, respectively, according to plasma lactose, stability to the alcohol test and milk pH.

Cluster 3 was basically composed of three observations of the same cow. Although this animal responded to the feeding restriction as expected, it might not be reliable to build a discussion based on the results of a single animal; thus, the values from Cluster 3 were not used in the statistical analysis for cluster comparison.
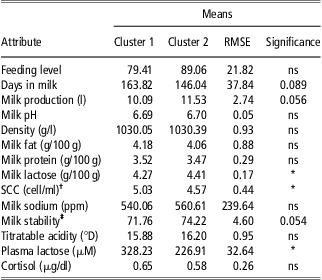
There were no differences in feeding levels between clusters 1 and 2 (Table 1). Cluster 1 grouped cows with larger SCC (P < 0.05), higher plasma lactose levels (328.23 v. 226.91 μM, P < 0.05) and with a tendency to present larger number of days in milk (163.82 v. 146.04, P = 0.089) than Cluster 2. On the other hand, milk lactose concentration (4.41 g/100 g v. 4.27 g/100 g, P < 0.05) was higher and there was a tendency to greater mean daily production (11.53 l v. 10.09 l, P = 0.056) and stability to the ethanol test (74.22% v/v v. 71.76% v/v, P = 0.054) in Cluster 2. No other tendencies (P > 0.10) or significant differences (P > 0.05) were found between clusters.
Mean values for diet, milk and plasma attributes in cows grouped into Clusters 1 and 2 according to values of plasma lactose, stability to the alcohol test and milk pH with corresponding significance levels

ns = non-significant; SCC = somatic cell count.
*P < 0.05.
†SCC; values in log10 transformation.
‡Concentration of ethanol capable of causing coagulation of milk proteins.
Discussion
Multiple correspondence analysis relating feeding level to milk composition and yield (Figure 3) showed that underfeeding reduced milk production, which was followed by an increase in fat concentration. This might be due to a concentration effect, caused by a lower reduction in the rate of milk fat synthesis compared with milk production (Lacy-Hulbert et al., Reference Lacy-Hulbert, Woolford, Nicholas, Prosser and Stelwagen1999). However, reduction of BCS from 2.70 to 2.45 following the 1-week feed restriction period may also have contributed to these higher values, as fat mobilized from adipose tissue could enter into the mammary gland, increasing its concentration in milk, as noted by Marques et al. (Reference Marques, Fischer, Zanela, Ribeiro, Stumpf and Manzke2010). On the other hand, Guinard-Flament et al. (Reference Guinard-Flament, Delamaire, Lamberton and Peyraud2007) reported a trend for decrease in fat concentration in the milk from cows fed 30% restricted diets. In the present study, the concentration effect evidenced for milk fat also occurred for protein content, as lower milk production was correlated with higher protein levels. Contrary to this, Guinard-Flament et al. (Reference Guinard-Flament, Delamaire, Lamberton and Peyraud2007) observed a decrease in total protein and casein in the milk of restricted-fed cows. According to those authors, feed restriction may reduce the synthesis of milk components as it lowers blood flow and mammary gland uptake of nutrients.
Principal factor analysis (PFA; Figure 1) and multiple correspondence analysis (Figure 2) consistently showed lower feeding levels associated with reduced milk stability, increased plasma lactose and milk sodium concentrations. The association between feed restriction and milk stability has already been reported by Zanela et al. (Reference Zanela, Fischer and Ribeiro2006) and Marques et al. (Reference Marques, Fischer, Zanela, Ribeiro, Stumpf and Manzke2010). On the other hand, reduced stability is reversed by an increase in food supply (Zanela et al., Reference Zanela, Fischer and Ribeiro2006). It is worth pointing out that cows showed differences in lag time to decrease milk stability as feeding restriction advanced; the same observation can be made for time needed for stability recovery after resumption of the diet (results not presented).
The elevation of plasma lactose is a reliable indicator of the increased permeability of mammary gland cell TJ (Stelwagen et al., Reference Stelwagen, Hopstert, Van Der Werf and Blokhuist2000). As lactose is produced essentially in the mammary gland (Kuhn and Linzell, Reference Kuhn and Linzell1970) and is not secreted basolaterally (Stelwagen et al., Reference Stelwagen, Mclaren, Turner, McFadden and Prosser1998b), any trace of this carbohydrate in the blood suggests its outflow from milk into the blood stream, due to increased TJ permeability. Following its elevation in plasma lower lactose concentration is expected in milk. Although plasma lactose baseline levels were restored rapidly, milk stability and yield remained depressed (results not presented), paralleling the results reported by Stelwagen et al. (Reference Stelwagen, Davis, Farr and Eichler1994) for plasma lactose and milk yield. Another parameter used to access the permeability of mammary gland cell TJs is the elevation in the concentration of milk sodium. Working with cows from days 1 to 90 after calving, Tsioulpas et al. (Reference Tsioulpas, Grandison and Lewis2007) registered a gradual decrease in sodium concentration of milk, with high levels on day 1 (leaky TJ), decreasing thereafter (TJ closure).
Relationships between milk stability to the ethanol test and milk composition are not yet well established, but the reduction of lactose and increase in sodium in milk samples presenting lower stability to the test are reported (Chavez et al., Reference Chavez, Negri and Cuatrín2004; Tsioulpas et al., Reference Tsioulpas, Grandison and Lewis2007). As the reduction in the levels of lactose in milk – partially due to its outflow from milk to blood – can be, together with plasma lactose, used to establish the higher permeability state of TJ, and Figure 2 showed correspondence between low milk stability and reduced milk lactose levels, TJ opening might be one of the explanations for the reduction in milk lactose concentration in cows producing milk with reduced ethanol stability. Hence, as feeding restriction was associated with lower milk stability to the ethanol test, higher sodium in milk, plasma lactose levels and lower milk lactose concentration, a relation between higher TJ permeability and lower milk stability to the ethanol test, which is the main proposition of this experiment, could be sustained.
The present experimental results are apparently not in agreement with those presented by Lacy-Hulbert et al. (Reference Lacy-Hulbert, Woolford, Nicholas, Prosser and Stelwagen1999), who did not find differences in TJ permeability (evaluated with plasmatic lactose levels) when feeding restriction was imposed to cows in an advanced milking stage (over 210 days in milk). These authors measured plasma lactose and other attributes only at the end of the trial, 25 days after the beginning of the restriction, and therefore the dynamic and transient response of TJ (Stelwagen et al., Reference Stelwagen, Davis, Farr and Eichler1994) might be responsible for the absence of difference in TJ permeability in that experiment.
The TJ's change to a leaky state might be linked initially to a stress condition (underfeeding), as attested by the existence of some correspondence between G50 and higher plasmatic cortisol levels, which tend to be elevated in stressed animals (Verkerk et al., Reference Verkerk, Phipps, Carragher, Matthews and Stelwagen1998). Stelwagen et al. (Reference Stelwagen, Hopstert, Van Der Werf and Blokhuist2000) found pronounced TJ leakiness in cows after provoking social isolation stress, and high stress-responsive cows tended to present higher plasma lactose and cortisol levels.
Although in the present study most of the animals presented low values for SCC (85% of milk samples presented <200 000 cell/ml), it is worth noticing that cows under feed restriction presented an increase in SCC from baseline 70 000 to 208 500 cell/ml at the end of restriction period, lowering to 120 000 cell/ml 2 weeks later, whereas animals fed the full diet maintained SCC around 70 000 cell/ml. Lacy-Hulbert et al. (Reference Lacy-Hulbert, Woolford, Nicholas, Prosser and Stelwagen1999) also reported increased SCC values after feed restriction. This increase may be due, in part, to a concentrating effect as milk yield decreased (Kamote et al., Reference Kamote, Holmes, Mackenzie, Holdaway and Wickham1994) during feeding restriction. Even with this increase, SCC stayed at low values and this parameter was not related with the reduction in the stability of milk, as shown by the PFA.
Some of the relations encountered in principal components and correspondence analysis were sustained by the comparison between clusters. Cows with reduced milk stability presented elevated plasma lactose levels and reduced milk lactose concentration. Although not significant, feeding level from animals grouped in Cluster 1 was reduced. Sodium in milk was similar between clusters, which is in discordance with results from PF and multiple correspondence analysis. Nevertheless, there was a tendency that cows with some reduction in feed intake presented higher permeability of mammary gland cell TJs, leading to a decrease in the stability of milk to the ethanol test. Elevated SCC and mastitis may increase TJ permeability (Moussaoui et al., Reference Moussaoui, Vangroenweghe, Haddadi, Le Roux, Laurent, Duchateau and Burvenich2004), but this did not seem to be the case in Cluster 1, as the mean value of SCC was low (∼100 000 cell/ml), indicating that feeding level was probably the main factor responsible for the findings.
Conclusions
Severe feeding restriction triggers the elevation in the levels of cortisol in cows. This event is followed by the increase in the levels of plasma lactose, which indicates the higher permeability of mammary gland cell TJs, and in its turn promotes the reduction in the levels of lactose and elevation of sodium in milk. Elevated permeability of mammary gland cell TJs is positively related to reduction in the stability of milk to the ethanol test due to saline unbalance. Milk stability can decrease to levels that are unacceptable to the dairy industries, which can impair economic return to milk farmers. Summarizing, loss in milk stability is mediated by increased TJ permeability, caused, in this experiment, by feeding restriction. Other stressful factors may have the same effects on TJ and milk, but further studies are required to verify this hypothesis.
Acknowledgments
The study was supported with CNPq grant and it was performed with the collaboration of Embrapa Clima Temperado and its employees.