Peer relationships serve important developmental functions. From early to middle childhood, one of the most important roles of peer relations is to provide contexts where children can learn and exercise self-control and new social skills, as well as flexible and socially appropriate means to solve interpersonal conflict. Unfortunately, a substantial number of children, between 5% and 10% according to various estimates, experience chronic peer relation difficulties such as peer rejection and victimization (Juvonen, Graham, & Schuster, Reference Juvonen, Graham and Schuster2003; Kochenderfer & Ladd, Reference Kochenderfer and Ladd1996; Perry, Kusel, & Perry, Reference Perry, Kusel and Perry1988; Solberg & Olweus, Reference Solberg and Olweus2003). Children who experience such peer relationship difficulties suffer and are at risk for a variety of future adjustment problems, including depression, academic failure, delinquency, and substance abuse (Boivin et al., Reference Boivin, Pérusse, Dionne, Saysset, Zoccolillo and Tarabulsy2005; Rubin, Bukowski, & Parker, Reference Rubin, Bukowski, Parker, Eisenberg and Damon2006). It is thus important to learn more about the developmental processes underlying these difficulties to more precisely identify children at risk and plan preventive intervention.
Research on children's peer relations has mainly assessed peer relation difficulties from two perspectives (Rubin et al., Reference Rubin, Bukowski, Parker, Eisenberg and Damon2006). One perspective centers on children who are disliked and negatively perceived by peers. This form of peer rejection (or negative peer status) may lead to various negative experiences, such as excessive teasing and active peer harassment, but also to more subtle forms of ostracism and exclusion. Peer victimization, a related but different type of negative peer experience, refers to a child being repeatedly exposed to negative treatment by one or more children. Thus, peer victimization is a class of negative actions by peers, whereas peer rejection reflects the attitude of the peer group, an attitude that may induce a certain class of manifest behaviors by peers, including overt victimization (Boivin, Hymel, & Hodges, Reference Boivin, Hymel, Hodges, Juvonen and Graham2001). Although related, these two forms of peer difficulties should not be confounded but rather seen as providing a complementary and broader view of these difficulties. Both markers of peer difficulties have been found to predict emotional problems, such as loneliness, depression, anxiety, and suicidal ideation, as well as increased physical health, conduct, and school problems (Arseneault et al., Reference Arseneault, Milne, Taylor, Adams, Delgado and Caspi2008; Boivin, Hymel, & Bukowski, Reference Boivin, Hymel and Bukowski1995; Boulton & Underwood, Reference Boulton and Underwood1992; Dodge et al., Reference Dodge, Lansford, Burks, Bates, Pettit and Fontaine2003; Hanish & Guerra, Reference Hanish and Guerra2004; Kochenderfer & Ladd, Reference Kochenderfer and Ladd1996; Olweus, Reference Olweus1992; Rigby, Reference Rigby1999; Rubin et al., Reference Rubin, Bukowski, Parker, Eisenberg and Damon2006). These predictive associations clearly underline the importance of the two facets of peer difficulties in developmental psychopathology.
Social contexts and group processes have a role to play in childhood peer relation difficulties (Boivin, Dodge, & Coie, Reference Boivin, Dodge and Coie1995; Hymel, Wagner, & Butler, Reference Hymel, Wagner, Butler, Asher and Coie1990; Salmivalli & Voeten, Reference Salmivalli and Voeten2004; Wright, Gianmarino, & Parad, Reference Wright, Gianmarino and Parad1986). However, over and above these contextual fluctuations, the documented cross-contextual and temporal stability of these difficulties clearly points to individual characteristics, and to social behaviors in particular, as significant risk factors (Boulton & Smith, Reference Boulton and Smith1994; Boulton & Underwood, Reference Boulton and Underwood1992; Coie & Dodge, Reference Coie and Dodge1983). A significant body of research supports the view that the social behavior of the child experiencing peer relation difficulties is one of the main sources of these difficulties, over and above atypical physical attributes such as speech problems and physical clumsiness (Boivin, Vitaro, & Poulin, Reference Boivin, Vitaro, Poulin, Tremblay, Hartup and Archer2005; Rubin et al., Reference Rubin, Bukowski, Parker, Eisenberg and Damon2006). Children who show disruptive behavior problems are more likely to experience peer relation difficulties (Newcomb, Bukowski, & Pattee, Reference Newcomb, Bukowski and Pattee1993). Among these behavior problems, aggressive behavior has been documented as the most common behavioral correlate and possible determinant of peer relation difficulties in the early years of school (Coie & Kupersmidt, Reference Coie and Kupersmidt1983; Dodge, Reference Dodge1983; Rubin et al., Reference Rubin, Bukowski, Parker, Eisenberg and Damon2006) as well as in preschool (Barker et al., Reference Barker, Boivin, Brendgen, Fontaine, Arseneault and Vitaro2008; Boivin et al., Reference Boivin, Pérusse, Dionne, Saysset, Zoccolillo and Tarabulsy2005; Crick, Casas, & Ku, Reference Crick, Casas and Ku1999).
Impulsive–hyperactive behaviors have also been associated with peer difficulties, although through a smaller corpus of studies. This association is likely because those behaviors often imply rude and unpredictable responses aversive to peers, especially in a constrained and goal-directed environment such as the school (Hoza, Reference Hoza2006; Hoaa et al., 2005). Comorbidity between aggressive behaviors and hyperactive–impulsive behaviors is high (Fontaine et al., Reference Fontaine, Carbonneau, Barker, Vitaro, Hébert and Côté2008; Huijbregts, Séguin, Zoccolillo, Boivin, & Tremblay, Reference Huijbregts, Séguin, Zoccolillo, Boivin and Tremblay2007; Nagin & Tremblay, Reference Nagin and Tremblay1999), and both forms of behaviors forecast negative peer perceptions and status in newly formed groups (Dodge, Reference Dodge1983; Erhardt & Hindshaw, Reference Erhardt and Hinshaw1994; Pelham & Bender, Reference Pelham, Bender, Gadow and Bialer1982).
Thus, there is some converging evidence that aggressive and hyperactive–impulsive behaviors may evoke rejection and victimization by peers. However, because the bulk of this research is based on correlations, causal inference is limited even within a longitudinal design, and we are still unsure of the developmental processes underlying this predictive association. For instance, it could be that unmeasured heritable factors (e.g., self-regulation problems) account for both disruptive behaviors and peer difficulties. However, the fact that early disruptive behaviors known to be influenced by genetic factors (Rhee & Waldman, Reference Rhee and Waldman2002; van Lier et al., Reference van Lier, Boivin, Vitaro, Brendgen, Perusse and Koot2007) predict early school peer relation difficulties, a social experience, strongly suggests that a significant part of the risk of experiencing peer difficulties can be traced back to genetic vulnerability for disruptiveness in the child. These alternative hypotheses have not yet been tested empirically.
Genetically informative studies, such as twin studies, are well suited for investigating the underlying gene–environment etiology of such an association, especially if they provide longitudinal information. Although they do not substantiate causation per se, longitudinal twin studies combine the heuristic value of longitudinal information (i.e., prediction and information about the sequence of events) and a unique capacity to disentangle the role of child and family factors in development. The basic strength of twin studies lies in their power to document within-family (i.e., sibling) similarities and differences, something that studies of singletons cannot do, as a function of genetic relatedness. Twins can be seen as a natural experiment where some stochastic biological process generates monozygotic (MZ) twins, who share 100% of their genes, or dizygotic (DZ) twins, who share on average 50% of their genotype. In the classic twin design, this naturally occurring variation in genetic relatedness within families is harnessed to statistically tease apart genetic from environmental sources of variation on a given phenotype.
The rationale of the twin design can be extended to measured environments, such as peer relation difficulties, to estimate the extent to which these difficulties are shared or uniquely experienced by twin siblings and whether they are associated to genetically influenced child characteristics. Finding such “genetically mediated child effects” on specific features of peer relations and then examining how these genetic contributions are shared with those underlying disruptive behaviors would provide evidence of gene–environment correlation (rGE). An rGE is found when genetic variation is associated with variation in exposure to a specific environment (Jaffee & Price, Reference Jaffee and Price2007). Various forms of rGE have been suggested (Plomin, DeFries, & Loehlin, Reference Plomin, DeFries and Loehlin1977; Scarr & McCartney, Reference Scarr and McCartney1983). A rGE is said to be passive if, for example, parents supply the child with an environment congruent with their genotype (and thus their child's); it can be evocative or reactive, such as when the individual makes those around him react to his genetically predisposed characteristics; finally, it can be selective or active, when the individual chooses an environment on the basis of his genetic predispositions.
Genetically mediated “child effects” have been revealed for environmental features likely to affect the child directly, such as parental harsh discipline (Boivin et al., Reference Boivin, Pérusse, Dionne, Saysset, Zoccolillo and Tarabulsy2005; Jaffee et al., Reference Jaffee, Caspi, Moffitt, Polo-Tomas, Price and Taylor2004; Plomin & Bergeman, Reference Plomin and Bergeman1991), or indirectly, such as marital status and quality (McGue & Lykken, Reference McGue and Lykken1992; Spotts et al., Reference Spotts, Neiderhiser, Towers, Hansson, Lichtenstein and Cederblad2004). Of interest here is the possibility that a reactive rGE accounts for the association between disruptive behaviors and peer difficulties at school entry.
Only a limited number of studies have examined peer relations within a genetically informed design. A few twin studies found significant heritability and nonshared environmental contributions in perceived social acceptance among adolescents (Iervolino et al., Reference Iervolino, Pike, Manke, Reiss, Hetherington and Plomin2002; McGuire et al., Reference McGuire, Manke, Saudino, Reiss, Hetherington and Plomin1999). In an adoption study, O'Connor, Jenkins, Hewitt, DeFries, and Plomin (Reference O'Connor, Jenkins, Hewitt, DeFries, Plomin, Deater-Deckard and Petrill2001) found that adolescent biological siblings were, according to teachers, more similarly popular than were adoptive siblings, suggesting a genetic contribution to popularity. However, these studies did not examine the child characteristics accounting for this association. Pike and Atzaba-Poria (Reference Pike and Atzaba-Poria2003) found a significant heritability for perceived relation quality with best friend among 12-year-old twins and that this genetic contribution was partly accounted for by child temperament (i.e., activity and sociability). Ball et al., (Reference Ball, Arseneault, Taylor, Maughan, Caspi and Moffitt2008) reported that 73% of the variance in peer victimization (mother ratings) of 10-year-old twins was accounted for by genetic factors, with aggressive behavior partly mediating this genetic contribution. In a recent study of same-sex Grade 1 twins, we found that the genetic contribution to peer victimization was modest (24%) but again substantially overlapped with a genetic disposition for aggressive behaviors (Brendgen et al., Reference Brendgen, Boivin, Dionne, Barker, Vitaro and Girard2011).
These findings point to two key elements suggesting rGE. First, there are genetic vulnerabilities in the child that put him or her at risk for experiencing peer difficulties. Second, this genetic vulnerability is partly accounted for by child characteristics, including aggressive behaviors. However, this initial body of research has important limitations. First, many of these studies have relied on self-report of peer relations, a measure that could partly reflect the self-system and thus generate biased estimates of peer difficulties (Boivin & Hymel, Reference Boivin and Hymel1997; Boivin, Vitaro, & Gagnon, Reference Boivin, Vitaro and Gagnon1992). Mother and teacher judgment were also used, but both sources may only have limited access and information regarding children's peer relationships (Fekkes, Pijpers, & Verloove-Vanhorick, Reference Fekkes, Pijpers and Verloove-Vanhorick2005; Houndoumadi & Pateraki, Reference Houndoumadi and Pateraki2001). Peer reports are an ideal reference point from which to assess peer relation difficulties because peers are the both the witnesses and the actors of the social scene (Boivin et al., Reference Boivin, Pérusse, Dionne, Saysset, Zoccolillo and Tarabulsy2005; Rubin et al., Reference Rubin, Bukowski, Parker, Eisenberg and Damon2006). However, peer assessments are rarely used to test rGE regarding peer difficulties (Brendgen et al., Reference Brendgen, Boivin, Dionne, Barker, Vitaro and Girard2011).
Second, in addition to peer victimization, peer rejection is an important marker of children's peer difficulties (Boivin et al., Reference Boivin, Pérusse, Dionne, Saysset, Zoccolillo and Tarabulsy2005; Dodge et al., Reference Dodge, Lansford, Burks, Bates, Pettit and Fontaine2003; Rubin et al., Reference Rubin, Bukowski, Parker, Eisenberg and Damon2006). As indicated earlier, these two forms are related but complementary: peer rejection reflects negative feelings of the peer group toward a child, whereas peer victimization refers to actual negative behaviors (Boivin et al., Reference Boivin, Hymel, Hodges, Juvonen and Graham2001). When taken together, these assessments provide a more comprehensive coverage of peer difficulties than when only aspect is considered. However, they have never been examined jointly to test rGE within a genetically informed design.
Third, previous research has not yet provided a developmental view of gene–environment processes because peer relations were always assessed at a single point in time (i.e., cross-sectional) and mainly during adolescence. This is a crucial point for at least two reasons. First, peer difficulties are established and tend to consolidate early in the school system. It is important to document these early stages to inform prevention efforts. Second, a longitudinal approach is necessary for a fine-grained description of the gene–environment dynamic linking disruptive behaviors and peer difficulties. The longitudinal information allows for testing the predictive association between disruptive behavior and peer difficulties, and the extent to which this prediction is genetically and/or environmentally mediated.
Accordingly, using a multiassessment and longitudinal approach, we recently reported that, starting in kindergarten, genetic factors accounted for a substantial part of both yearly and stable peer difficulties when those were defined by a latent factor combining different forms (i.e., peer rejection and peer victimization) and sources of information (Boivin et al., in press). The present study builds on and extends this work by examining the behavioral phenotypes possibly mediating this gene–environment association. The main goal of the present study was to test explicitly for the presence of an rGE linking disruptive behaviors and peer relation difficulties at school entry (i.e., from kindergarten to Grade 1). We hypothesized that there would be a significant genetic liability (i.e., heritability) for peer relation difficulties in kindergarten and in Grade 1, and that a significant part of this genetic liability would be shared with disruptive behaviors. We also hypothesized that this overlap would extend to the predictive association between (kindergarten) disruptive behaviors and later (i.e., Grade 1) peer difficulties. To this end, we assessed the genetic and environmental contributions to both disruptive behaviors and peer difficulties using a biometric cross-lagged design initially proposed by Burt, McGue, Krueger, and Iacono (Reference Burt, McGue, Krueger and Iacono2005). This model takes advantage of the time lag and heuristics of the twin design to more precisely assess the direction of causality and its underlying gene–environment architecture linking disruptive behaviors and peer difficulties.
Method
Sample
Participants were families of twins from the ongoing Quebec Newborn Twin Study, recruited between April 1995 and December 1998 in the greater Montreal area in Canada. Of the 989 families contacted, 662 (67%) agreed to participate. This sample was followed longitudinally at 5, 20, 32, 50, and 63 months and assessed on various child and family characteristics. The present paper describes findings from the school follow-up in kindergarten and Grade 1.
Zygosity was ascertained through the Zygosity Questionnaire for Young Twins (Goldsmith, Reference Goldsmith1991) when the twins were 5 and 20 months of age. Results obtained with this method were 91.9% and 93.8% concordant, respectively, with those derived from DNA samples of 123 twin pairs (Forget-Dubois et al., Reference Forget-Dubois, Pérusse, Turecki, Girard, Billette and Rouleau2003). Taking chorionic data into account, the concordance between physical similarity and DNA diagnoses rose to 96%. Ambiguous zygosity diagnoses were reevaluated by research assistants and parents during the school-age assessments.
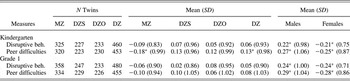
Sample attrition was 6% per year on average. Twins for whom peer nominations of peer relations and teacher ratings of behavior problems were available were 796 in kindergarten (400 pairs total, 164 pairs of MZ twins and 236 pairs of DZ twins; age: M = 72.7 months, SD = 3.6) and 948 in Grade 1 (474 pairs total, 198 pairs of MZ twins and 276 pairs of DZ twins; age: M = 84.9, SD = 3.2), although numbers may vary slightly across measures (see Table 1). Seventy percent of the twin pairs were in different classrooms in kindergarten, and 77 % in Grade 1.
Descriptive data for disruptive behaviors and peer relation difficulties in kindergarten and Grade 1

Note: MZ, monozygotic; DZ, dizygotic; S, same; O, other.
*p < .001. Significant mean differences.
Participating twins in kindergarten did not differ from those lost to attrition with regard to zygosity, parent-rated temperament at 5 months of age, or to any sociodemographic background measure, except for a slightly higher education level of the fathers in the remaining sample.
Procedure
Prior to data collection, written consent from the parents of all the children in the classroom was obtained. Data collection took place in the spring of the school year. The sociometric procedure took approximately 45 min per class, during which teachers completed questionnaires for the twin(s) in their class in a separate room. The instruments were approved by the both the institutional review and school boards.
Measures
Peer relation difficulties
Peer rejection
In both kindergarten and Grade 1, booklets of photographs of all children in a given class were handed out to all participating children in the class. The children were asked to circle the photos of three classmates they most liked to play with (positive nominations) and three children they least liked to play with (negative nominations). The total number of positive nominations received from classmates was calculated for each participant and z standardized within classroom to create a total liked-most score. The total number of negative nominations received was calculated for each participant and z standardized within classroom to create a total liked-least score. Following criteria outlined by Coie, Dodge, and Coppetelli (Reference Coie, Dodge and Coppetelli1982), the liked-least score was then subtracted from the liked-most score to create a social preference score, which was again z standardized within classroom. This score was then inverted to indicate peer relation difficulties: high levels on this scale indicate peer rejection, whereas low levels indicate greater social preference. The label peer rejection is used throughout for the sake of clarity.
Peer-assessed victimization
Peer victimization was assessed through peer nominations. Because peer harassment is often more obvious to classmates than to adults (O'Connell, Pepler, & Craig, Reference O'Connell, Pepler and Craig1999), peers are seen as a valid source for identifying the victims of peer abuse (Juvonen, Nishina, & Graham, Reference Juvonen, Nishina and Graham2000; Pellegrini & Bartini, Reference Pellegrini and Bartini2000). In the same booklet used to assess peer positive and negative nominations, the children were asked to circle the photos of two children who best fit positive and negative descriptors. Each descriptor was read out aloud to the class by one of the two research assistants, while the other ensured the ratings remained confidential. We used two items slightly adapted from the victimization subscale of the modified Peer Nomination Inventory (Perry, Kusel, & Perry, Reference Perry, Kusel and Perry1988): “He/she gets called names most often by other children” and “He/she is often pushed and hit by other children, he/she gets the hits.” Even though two items were used due to the young age of the children, peer nominations based on a single item tend to be highly reliable because they are based on multiple respondents (e.g., Hodges, Malone, & Perry, Reference Hodges, Malone and Perry1997; Perry et al., Reference Perry, Kusel and Perry1988). Accordingly, the total number of nominations received from all classmates on each item was calculated for each participant and then, following usual procedures for peer nomination data (Cillessen & Rose, Reference Cillessen and Rose2005), z standardized within classroom to account for differences in classroom size. The two item scores were moderately correlated in both kindergarten (r = .39, p < .001) and Grade 1 (r = .47, p < .001), and were thus averaged to create a total peer-assessed victimization score in kindergarten and in Grade 1, respectively.
Teacher-rated victimization
Peer victimization was also assessed through teacher ratings. Each teacher was asked to rate on a 3-point scale (0 = never, 1 = sometimes, 2 = often) the extent to which in the past 6 months, the child was “made fun of by other children,” “was hit or pushed by other children,” and “was called names by other children.” Individual scores were averaged to yield a teacher-rated victimization score in kindergarten (Cronbach α = 0.62) and in Grade 1 (α = 0.68).
Then, at each time, the three peer difficulty scores were submitted to a principal component factor analysis to generate a general factor score of peer difficulties. In kindergarten, this analysis revealed a single factor solution accounting for 50% of the variance, with the three peer difficulty scores yielding significant loadings of similar magnitude (0.71 for peer rejection, 0.66 for peer-assessed victimization, and 0.75 for teacher-rated victimization). In Grade 1, the same analysis also revealed a single factor solution accounting for slightly more variance (55%), again with loadings of similar magnitude (0.72 for peer rejection, 0.70 for peer-assessed victimization, and 0.79 for teacher-rated victimization). In view of the clear factor structures and given the power constraints of operating with multiple measures within the genetic modeling, the factor scores derived in kindergarten and in Grade 1 (i.e., labeled peer difficulties) were used in further analyses.
Disruptive behaviors
Two classes of disruptive behaviors, aggressive behaviors (10 items) and hyperactive–impulsive behaviors (5 items), were assessed via teacher ratings of a behavior scale that incorporates items from the Child Behavior Checklist (Achenbach, Reference Achenbach1991), the Ontario Child Health Study Scales (Boyle et al., Reference Boyle, Offord, Racine, Sanford, Szatmari and Fleming1993), and the Child Social Behavior Questionnaire (Tremblay, et al., Reference Tremblay, Loeber, Gagnon, Charlebois, Larivée and LeBlanc1991). For aggressive behaviors, the teacher was asked to rate on a 3-point scale (0 = never, 1 = sometimes, 2 = often) the extent to which in the past 6 months, the child (a) got into fights; (b) encouraged other children to pick on a particular child; (c) reacted in an aggressive manner when teased; (d) tried to dominate the other children; (e) reacted in an aggressive manner when contradicted; (f) scared other children to get what he/she wanted; (g) reacted with anger and fighting when somebody accidentally hurt him/her; (h) reacted in an aggressive manner when something was taken away from him/her; (i) physically attacked people; or (j) hit, bit, or kicked other children. Individual scores were averaged to yield a teacher-rated aggression score in kindergarten (Cronbach α = 0.91) and in Grade 1 (α = 0.91).
Using the same 3-point scale, 5 items were used to assess hyperactivity–impulsivity: (a) can't sit still, is restless or hyperactive; (b) fidgets; (c) is impulsive, acts without thinking; (d) has difficulty waiting for his/her turn in games; or (e) cannot settle down to do anything for more than a few moments. As for aggression, the resulting teacher-rated hyperactivity–impulsivity scores were reliable (kindergarten: α = 0.90; Grade 1: α = 0.89).
The aggressive behavior scores and the impulsivity–hyperactivity scores were highly correlated in both kindergarten (r = .63) and Grade 1 (r = .62). They were thus aggregated into a general disruptive behavior score by first standardizing each score and then computing a mean disruptive behavior score at each time point.
Analyses
Missing data were handled with full-information maximum likelihood (FIML), which uses maximum likelihood to estimate model parameters using all available raw data (Arbuckle, Reference Arbuckle, Macoulides and Schumacker1996; Wothke, Reference Wothke2000). FIML is more efficient than other techniques such as pairwise deletion (Little & Rubin, Reference Little and Rubin1987), particularly in the context of longitudinal data. We first documented sex and zygosity differences, as well as stability and associations among disruptive behavior and peer difficulty scores through Anovas and Pearson correlations. In the genetic modeling, scores were regressed for gender and then pooled across gender to maximize statistical power (Arseneault et al., Reference Arseneault, Moffitt, Caspi, Taylor, Rijsdijk and Jaffee2003; Brendgen et al., Reference Brendgen, Vitaro, Boivin, Girard, Bukowski and Dionne2009; Van den Oord, Boomsma, & Verhulst, Reference Van den Oord, Boomsma and Verhulst2000).
In a twin design, the relative contributions of genes, shared environment, and nonshared environment on a given score can be assessed by comparing within- and across-family similarity of twin pairs as a function of zygosity. Given that MZ twins share 100% of their genes, versus 50% on average for DZ twins, and that both MZ and DZ twin pairs grow up in the same family, genetic influences (a 2) are suggested when MZ twins are more similar than DZ twins on a given characteristic or experience. High similarity in both MZ and DZ twins indicates the possible interplay of environmental influences shared by both twins of the pair (c 2), whereas low overall similarity among twins of a pair signals the role of experiences unique to each twin (e 2). The covariance linking two variables, in this case a child phenotype (disruptive behaviors) and a social experience (peer difficulties), can also be partitioned according to the same principles. Hence, genetic (R G), common environmental (R C), and unique environmental (R E) correlations linking the two phenomena can be estimated, which indicate the extent to which the same genetic and/or environmental factors underlying the child phenotype (disruptive behaviors) also account for the measured social environment (peer difficulties).
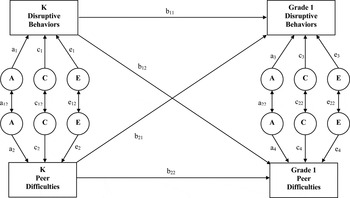
First, we examined the patterns of MZ and DZ twins intraclass correlations (ICC) for disruptive and peer difficulty scores in kindergarten and in Grade 1. This initial step gives a rough estimate of heritability and is helpful for determining which multivariate models should be tested. Second, the genetic and environmental contributions to the concurrent and longitudinal associations between disruptive behaviors and peer difficulties were examined through an integrated cross-lagged model as described by Burt et al. (Reference Burt, McGue, Krueger and Iacono2005). As illustrated in Figure 1, this extended model estimates a sequence of associations starting with the ACE decomposition and putative gene–environment overlap of disruptive behaviors and peer difficulties in kindergarten. Nested in the model is an autoregressive cross-lagged pattern of associations where the autoregressive paths reflect the continuity within a specific variable and where the estimated cross-time, cross-lagged paths indicate directional associations between disruptive behavior and peer difficulties (i.e., partial regression coefficients corrected for the autoregressive paths). Third, the model considers the ACE decomposition and putative gene–environment overlap of disruptive behaviors and peer difficulties in Grade 1, while taking into account preexisting associations within and across variables. The model thus centers on “new” residual variance and covariance linking disruptive behaviors and peer difficulties in Grade 1.
A path diagram of the cross-lagged model linking disruptive behaviors and peer difficulties across time. A, additive variance; C, common environment variance; E, unique environment variance and error; a, standardized path coefficient for additive genetic variance component; c, standardized path coefficient for common environmental variance component; e, standardized path coefficient for unique environmental variance component; b, standardized partial regression coefficient. By convention, the path coefficients are represented by lowercase letters followed by one numeral (e.g., a 1, a 2,c 1,c 2). Genetic and environmental correlations are represented by lowercase letters followed by two numerals (e.g., a 11, a 22). Phenotypic partial regression coefficients are represented by a lowercase b followed by two subscripted numerals (e.g., b 11, b22).

This integrated cross-lagged model estimates 22 parameters; 12 parameters (i.e., the four sets of ax, cx, and ex) indicate the relative contribution of additive genetic, shared environment, and nonshared environment factors for each phenotype at each time; 6 parameters (i.e., the two sets of axx, cxx, and exx), reflect the ACE decomposition of their covariance at each age assessment; 2 parameters (i.e., b 11 and b 22) indicate the stability paths; and 2 others (i.e., b 12 and b 21) indicate their cross-lagged paths. These parameters are estimated as standardized partial regression coefficients and must be squared to yield variance proportions. In a stepwise fashion, within-age genetic and shared environmental paths, as well as the genetic, shared, and nonshared environmental correlations, were dropped, and model fit was compared to the full model to derive the best fitting options. Once the best fitting within-age correlated factors model was identified, the cross-age within phenotype paths and cross-lagged paths were dropped to assess their significance. The genetic modeling was performed using the Mplus package (Muthén & Muthén, Reference Muthén and Muthén2009). Model parameters were estimated using the FIML estimation technique applied to raw data. Goodness of fit indices for nested models within the full model presented in Figure 1 were quantified using both likelihood-ratio chi-square tests and the Bayesian information criterion (BIC) adjusted for the sample size (Raftery, Reference Raftery1995). Lower BIC values identify the more parsimonious and better fitting model. The comparative fit index (CFI) and the root mean square area of approximation (RMSEA) were also considered.
The parameter estimates of the best fitting cross-lagged model were also used to more precisely identify and quantify the longitudinal pathways through which genetic and environmental factors in kindergarten contribute to peer difficulties in Grade 1. Four independent sources of phenotypic variance in Grade 1 peer difficulties were considered, three of which stemmed from kindergarten: (a) cross-lagged contribution (i.e., the unique contribution of kindergarten disruptive behavior), (b) common contribution (i.e., the preexisting association of disruptive behavior and peer difficulties in kindergarten), (c) stability contributions (i.e., the unique contribution of kindergarten peer difficulties), and (d) residual contributions (i.e., factors unique to Grade 1 peer difficulties). In addition, each of these sources of phenotypic variance was further broken down into its genetic, shared environmental, and nonshared environmental components according to the principles of path analysis (see Loehlin, Reference Loehlin1998). To illustrate, the total genetic variance in Grade 1 peer difficulties could be decomposed into (a) the genetic variance unique to kindergarten disruptive behaviors (i.e., cross-lagged genetic contribution calculated as b 122 × a 12); (b) the genetic variance shared by disruptive behaviors and peer difficulties in kindergarten (i.e., common genetic contribution calculated as 2 × (b 22 × a 2 × a 11 × a 1 × b 12); (c) the genetic variance unique to kindergarten peer difficulties (i.e., stable genetic contribution, calculated as b 222 × a 22); and (d) genetic contributions unique to Grade 1 peer difficulties (i.e., “new, residual” genetic contribution, calculated as a 42). Similar calculations were performed to estimate similar parts of shared and nonshared environments. Using the same rationale, the same calculations were also done for Grade 1 disruptive behaviors (for various applications of this procedure, see also Burt et al., Reference Burt, McGue, Krueger and Iacono2005; Forsman, Lichtenstein, Andershed, & Larsson, Reference Forsman, Lichtenstein, Andershed and Larsson2010; Larsson, Viding, Rijsdijk, & Plomin, Reference Larsson, Viding, Rijsdijk and Plomin2008).
Results
Descriptive analyses
Table 1 presents the sample sizes, means, and standard deviations for disruptive behaviors and peer relation difficulties for the total sample and relevant subgroups in kindergarten and in Grade 1. Boys were more disruptive and experienced more peer difficulties than girls at all grade levels. MZ twins differed from DZ twins in peer relation difficulties, but only in kindergarten, and this difference faded away in Grade 1. This transient phenomenon favoring MZ twins was perhaps due to a positive “novelty” effect on peer status associated with being a twin at school entry. MZ and DZ twins did not statistically differ in disruptive behaviors at all times. For the g–e analysis, the variances did not differ between MZ and DZ twins. The phenotypic associations between disruptive behavior and peer difficulty were 0.59 in kindergarten and 0.64 in Grade 1. The observed stability was 0.59 for disruptive behaviors, and 0.45 for peer difficulties (all p < .001).
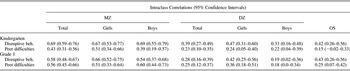
Genetic analyses: ICCs
Table 2 presents the MZ and DZ ICCs for the disruptive behavior and peer difficulty scores at both times. In all cases, family aggregation was significant and the MZ–DZ difference in ICC was substantial, thus suggesting significant heritability (a 2) and unique environmental variance (e 2), and low shared environment contribution (c 2). By and large, MZ and DZ ICCs were similar across gender. To specifically examine whether the pattern of gene–environment contributions was similar across sex, we performed a series of tests of invariance by comparing a model where the A, C, and E estimates were free to vary across gender to a more restricted model where these estimates were constrained to be equal across gender. In all cases, the constrained model fitted the data as well as the unconstrained model and was thus more parsimonious: Δχ2 (3) = 2.66, p = .447 and Δχ2 (3) = 3.54, p = .315 for peer difficulties; Δχ2 (3) = 5.94, p = .114 and Δχ2 (3) = 6.98, p = .073 for disruptive behaviors. Thus, despite the gender difference in mean level of disruptive behaviors, the genetic and environmental architecture underlying both disruptive behavior and peer difficulties appears similar across gender, a finding consistent with previous reports (Burt et al., Reference Burt, McGue, Krueger and Iacono2005; Rhee & Waldman, Reference Rhee and Waldman2002). The scores were regressed for gender, and these resulting scores retained for the following analyses. The resulting distributions were further winsorized at the 95th percentile to make them suitable for genetic modeling. Winsorizing consists in limiting extreme scores to a specific value to reduce their spurious effects on the distribution. It is a reliable and robust way to reduce the effects of outliers in nonnormal distributions (Fernandez et al., Reference Fernández, Etzel, Beasley, Shete, Amos and Allison2002; Shete et al., Reference Shete, Beasley, Etzel, Fernandez, Chen and Allison2004; Wilcox, Reference Wilcox2005).
Intraclass correlations for disruptive behaviors and peer difficulties
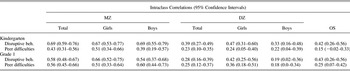
Note: MZ, monozygotic twins; DZ, dizygotic twins; OS, opposite sex.
The MZ and DZ ICCs were also calculated for each disruptive behavior and peer difficulty measures. In kindergarten, the ICCs were 0.62 (MZ) versus 0.30 (DZ) for aggressive behaviors, 0.66 versus 0.33 for impulsivity–hyperactivity, 0.43 versus 0.34 for peer rejection, 0.22 versus 0.09 for peer-assessed victimization, and 0.20 versus –0.01 for teacher-rated victimization. In Grade 1, the ICCs were 0.59 (MZ) versus 0.21 (DZ) for aggressive behavior, 0.61 versus 0.25 for impulsivity–hyperactivity, 0.56 versus 0.22 for peer rejection, 0.30 versus 0.11 for peer-assessed victimization, and 0.14 versus 0.16 for teacher-rated victimization. Thus, the patterns of ICCs for the disruptive behavior measures were quite homogeneous, stable, and similar to the aggregated disruptive behavior measure. This was not the case for the peer difficulty measures, likely because there was a lower, but growing consensus among informants over time regarding those who experienced peer difficulties (for a discussion of this point, see Boivin et al., in press). To a certain extent, this limited convergence may be counterbalanced by aggregating multiple viewpoints, as we did here.
Genetic analyses: Cross-lagged multivariate correlated factor model
To assess the pathways though which the putative rGE may be established, we turned to the cross-lagged genetic model linking disruptive behaviors and peer difficulties across time. As described earlier (see Figure 1), this extended model simultaneously considers the gene–environment architecture of disruptive behaviors and peer difficulties in kindergarten, the phenotypic autoregressive and cross-lagged directional associations between kindergarten and Grade 1, and the ACE decomposition of unique (i.e., residual) variances and covariances linking disruptive behaviors and peer difficulties in Grade 1.
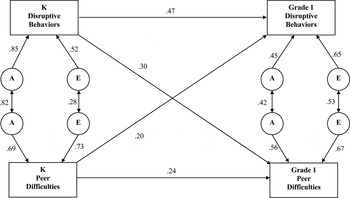
The full model with all 22 parameters was estimated (as in Figure 1). The fit of this model was χ2 (67) = 140.63, p < .05; BIC = 7,282.94, CFI = 0.92, RMSEA = 0.06. However, all C estimates were very low and nonsignificant, their value not exceeding 4% of the variance (C 1 = 0.03; C 2 = 0.04; C 3 = 0, C 4 = 0). Their value was fixed to zero, and an alternate AE model was performed. This more parsimonious longitudinal model did not differ significantly from the full model in terms of chi-square, CFI, and RMSEA fit, χ2 (72) = 140.76, p < .05; CFI = 0.92, RMSEA = 0.06, but had a lower BIC (BIC = 7,252.17). This resulting best fitting model is presented in Figure 2. Note that the estimates presented in Figure 2 are standardized partial regression coefficients and must be squared to yield variance proportions. In kindergarten, genetic factors accounted for the major part of the variance in both disruptive behaviors (i.e., 0.852 = 73% of the variance) and peer difficulties (0.692 = 47%), and most of the genetic factors underlying disruptive behaviors overlapped with the genetic source of variance in peer difficulties. Estimates of nonshared environment were also significant for both disruptive behaviors (27% of the variance) and peer difficulties (53% of the variance), and they overlapped moderately. In both cases, shared environment was not significant.
Best fitting cross-lagged model linking disruptive behaviors and peer difficulties across time. A, additive variance; C, common environment variance; E, unique environment variance and error. The numbers are standardized path estimates of the cross-lagged model with genetic, shared, and nonshared environmental contributions to the variance within and across phenotypes. Variance component parameters must be squared to estimate the proportion of variance accounted for. All paths are statistically significant at p < 0.05.

Parameter estimates for Grade 1 phenotypes stand for the genetic and environmental variance unique to that age, that is, with the contributions of the autoregressive and cross-lagged paths taken into account. For both disruptive behaviors (a 2 = 20%, and e 2 = 42%) and peer difficulties (a 2 = 31% and e 2 = 45%), this residual variance was essentially accounted for by genetic factors and nonshared environment factors, and not by shared environment. Note that, in both cases, these estimates did not sum to 100% because a significant part of the variance was accounted for by kindergarten measures.
Finally, the autoregressive and cross-lagged estimates were all significant (i.e., none could be dropped without significantly reducing the fit of the model). The autoregressive paths for disruptive behaviors (0.47) and peer difficulties (0.24) were lower than the phenotypic (stability) correlations reported previously because they were corrected for the cross-lagged paths. The two significant cross-lagged paths indicate a bidirectional association between disruptive behaviors and peer difficulties over time, over and above their respective autoregressive paths (i.e., stability). As expected, disruptive behaviors in kindergarten forecasted (changes in) peer difficulties in Grade 1 (b 12 = 0.30), and kindergarten peer difficulties predicted later disruptive behaviors 1 year later (b 21 = 0.20).
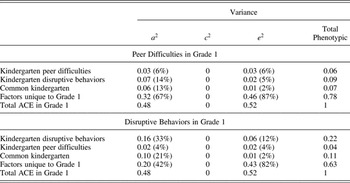
The genetic and environmental contributions to Grade 1 peer difficulties and disruptive behaviors was further decomposed according to their various sources, including those stemming from kindergarten (see Burt et al., Reference Burt, McGue, Krueger and Iacono2005). Of special interest here was the extent to which the genes associated with disruptive behaviors in kindergarten specifically contributed to peer difficulties 1 year later. The same analysis also examined the genetic and environmental nature of kindergarten peer difficulties contributions to disruptive behaviors in Grade 1. Table 3 displays the results of these decompositions (see Analyses in the Method section for the tracing rules).
Squared standardized path coefficients and corresponding percentages of variance accounted for in peer difficulties and disruptive behaviors in kindergarten and Grade 1

Note: a 2, additive genetic variance; c 2, shared environment variance; e 2, nonshared environment variance contributions to peer difficulties and disruptive behavior in kindergarten and Grade 1. The variance components in Grade 1 and the total phenotypic variances are further partitioned into unique contributions by peer difficulties and disruptive behavior in kindergarten, by the preexisting association between disruptive behavior and peer difficulties in kindergarten, and by the specifics of Grade 1, that is, residual factors that include new factors not present in kindergarten, variables not assessed in the present study, and error.
Phenotypically, peer difficulties in Grade 1 were significantly predicted by kindergarten factors, namely, peer difficulties (i.e., stability), 5.8%: (0.242 × 0.692) + (0.242 × 0.732), and disruptive behaviors, 8.9%: (0.302 × 0.852) + (0.302 × 0.522), as well as their common contribution, 8.5%: 2 × (0.24 × 0.69 × 0.82 × 0.85 × 0.30) + 2 × (0.24 × 0.73 × 0.28 × 0.52 × 0.30), leaving 76.8% of the variance accounted for by factors unique to Grade 1. The common contribution reflects, and thus controls for, the contribution of the association between disruptive behaviors and peer difficulties in kindergarten, therefore allowing for a conservative estimates of the unique contributions of disruptive behavior to peer difficulties over time. As showed in Table 3, each of these three kindergarten contributions was accounted for by genetic factors and unique environment factors, with genetic factors playing a major role in the unique contribution of disruptive behaviors (73%, i.e., 6.5/8.9), as well as in the combined contribution of kindergarten disruptive behaviors and peer difficulties (85%, i.e., 6.2/7.3), to later peer difficulties. Total heritability of peer difficulties in Grade 1 was mainly accounted for by factors unique to Grade 1 (67%) but also by peer difficulties (6%), disruptive behaviors (13%), and their combined contribution (14%) in kindergarten.
The bottom part of Table 3 presents the results for disruptive behaviors in Grade 1. Disruptive behaviors in Grade 1 were also mainly accounted for by factors unique to Grade 1, although to a lesser degree than were peer difficulties (62.9%). Disruptive behaviors in Grade 1 were also significantly predicted by kindergarten factors, mainly disruptive behaviors (21.7%; i.e., stability) and, to a lesser degree, by peer difficulties (4.1%) and their common contribution (11.3%). Again, each of these three specific predictions was totally accounted for by genetic factors and unique environment factors, with genetic factors playing a major role in the stability of disruptive behaviors (73%, i.e., 15.9/21.7), as well as in the unique contribution of peer difficulties (46%, i.e., 1.9/4.1) and common contribution of kindergarten disruptive behaviors and peer difficulties (87%, i.e., 9.9/11.3). Total heritability of disruptive behaviors in Grade 1 was mainly accounted for by factors unique to Grade 1 (42%) but also by disruptive behaviors (33%), peer difficulties (4%), and their common contribution (21%) in kindergarten.
Discussion
The goal of the present study was to assess the genetic and environmental architecture of the association between disruptive behaviors and peer difficulties at school entry and to estimate the extent to which genetic factors underlying child's disruptive behaviors accounted for this association. As expected, disruptive behaviors were strongly associated, both concurrently and predictively, with peer relation difficulties, and genetic factors clearly accounted for a substantial part of these associations, thus confirming rGE. In other words, these findings indicate that some children are genetically at risk for displaying early aggressive and hyperactive behaviors, and this genetic vulnerability makes them likely to also experience ongoing peer rejection and victimization starting in kindergarten. As discussed further in this section, this developmental cascade has important implications for the early identification of children at risk and early preventive intervention.
The present results are not only consistent with previous findings based on concurrent data (Ball et al., Reference Ball, Arseneault, Taylor, Maughan, Caspi and Moffitt2008; Brendgen et al., Reference Brendgen, Boivin, Dionne, Barker, Vitaro and Girard2011) but also extend them in several important ways. First and foremost, the present study was the first to take advantage of the full potential of the longitudinal approach to test the longitudinal persistence and directionality of the putative rGE, that is, of the genetic underpinning of the predictive association between disruptive behaviors and peer difficulties. Using a cross-lagged design, this study more accurately assessed the direction of association and the underlying gene–environment architecture linking disruptive behaviors and peer difficulties over time. Three distinct features of the model provided converging evidence for the role of genetic factors in that association. The first confirmation comes from the concurrent genetic–environmental analysis of initial disruptive behaviors and peer difficulties in kindergarten. Additive genetic factors explained most of the variance in disruptive behaviors and peer difficulties. Both dimensions were highly related, and an important part of this phenotypic association was genetically mediated, as indicated by the high genetic correlation linking disruptive behaviors and peer difficulties. In other words, due to some genetic vulnerability, some children displayed disruptive behavior and experienced peer difficulties already in kindergarten.
Second, evidence comes from the specific concurrent analyses in Grade 1, where genetic factors also partly accounted for the concurrent association between disruptive behaviors and peer difficulties. The pattern found in kindergarten was maintained in Grade 1, although somewhat attenuated, when, controlling for kindergarten measures, the new, “specific to Grade 1” association between disruptive behavior and peer difficulties was examined. The lower estimates are likely due to the role of other unmeasured variables, the change in peer relation context and norms unique to Grade 1, and measurement error in this new “emerging” variance. Thus, over and above the initial situation in kindergarten, genetic factors also accounted for the new interplay between disruptive behaviors and peer difficulties in Grade 1. This enduring pattern signals the persistence of the rGE process underlying the association between disruptive behaviors and peer difficulties. Thus, children who displayed increased disruptive behaviors in Grade 1 (compared to kindergarten) also tended to experience increased peer difficulties, and this link was associated with the same underlying genetic vulnerability.
Third, evidence comes from the genetic and environmental decomposition of the cross-lag prediction from kindergarten disruptive behavior to Grade 1 peer difficulties. Disruptive behaviors in kindergarten were found to independently contribute to peer difficulty in Grade 1 (with proper constraints for preexisting associations), and this unique contribution was largely a function of genetic factors. In other words, children who displayed disruptive behaviors in kindergarten were more likely to see a further deterioration of their peer difficulties in Grade 1, and a genetic vulnerability partly explained this predicted risk.
This last result is important heuristically because it explicitly targets the causal pathway under evaluation (i.e., that leading from disruptive behaviors to peer difficulties). Here, we should emphasize the main assumption underlying the cross-lagged analyses: the genetic and environmental factors affecting the cross-lag association are conveyed phenotypically. That is, they reflect the genetic and environmental factors underlying the previous phenotype, in this case, disruptive behaviors. In other words, the cross-lagged analysis estimated the degree of carryover of previous genetic and environmental contributions to preceding phenotypes. This “phenotypic” approach to the cross-lag was preferred over another, the “genetic cross-lag,” that specifically examines the genetic–environmental architecture of the cross-lag (i.e., decompose the covariance of the prediction; see Luo, Kovas, Haworth, & Plomin, Reference Luo, Kovas, Haworth and Plomin2011). The phenotypic approach is especially suited to the study of rGE where the putative outcome is a measured environment: If a genetic covariance may be estimated between a child phenotype and a measured environment, this overlap in genetic variance can only be conveyed through the child phenotype. Simply put, the notion of “shared genes” (i.e., between a child phenotype and an environment) does not make any sense in such a case.
Thus, additive genetic factors were ubiquitous in accounting for the different manifestations of the association between disruptive behaviors and peer difficulties. Given that peer difficulties are an experience (i.e., not a child phenotype), these findings provide strong confirmation that some children at genetic risk for displaying disruptive behaviors arouse peer rejection and victimization (i.e., evocative rGE) in the early years of school. The most important thing is that this process is established in the first year of school, if not earlier for some children (Barker et al., Reference Barker, Boivin, Brendgen, Fontaine, Arseneault and Vitaro2008), and tends to persist over time.
In addition to this evocative rGE, other similar processes operate to maintain, and perhaps increase, the association between disruptive behaviors and peer difficulties over time. The cross-lag model confirmed that if kindergarden disruptive behavior predicted peer difficulties in Grade 1, kindergarten peer difficulties also predicted disruptive behaviors in Grade 1. At least part of this prediction seemed governed by environmental processes, as indicated by the significant nonshared environmental contribution underlying this prediction. In other words, controlling for genetic factors, there was evidence suggesting that peer difficulties may exacerbate or maintain the child's disruptive behaviors over time, and this in a child-specific way over time (vs. familywide). This modest phenotypic prediction is consistent with previous findings showing that negative peer experiences in kindergarten predict later reactive aggression (Dodge et al., Reference Dodge, Lansford, Burks, Bates, Pettit and Fontaine2003; Lamarche et al., Reference Lamarche, Brendgen, Boivin, Vitaro, Dionne and Perusse2007). It also suggests that some children could be caught in a positive feedback loop where disruptive behavior and peer difficulties are mutually reinforced in a downward spiral of increasing behavior problems and negative peer experiences. Various environmentally mediated mechanisms have been proposed to account for this, including social information and peer group processes (Boivin et al., Reference Boivin, Pérusse, Dionne, Saysset, Zoccolillo and Tarabulsy2005; Dodge et al., Reference Dodge, Lansford, Burks, Bates, Pettit and Fontaine2003). At the same time, the genetically informative analysis also indicated that only part of the processes underlying this prediction was environmentally mediated. Genetic factors accounted for about half of this cross-lagged path, suggesting that some unmeasured heritable child characteristics in kindergarten (e.g., other behavioral, language, or physical characteristics) have influenced peer difficulties over time. Thus, there seems to be a dual process operating, and we need to know more about the nature and developmental role of child factors and environmental processes in peer difficulties and how they interact (i.e., through possible gene–environment interactions).
This last note should also be extended to the general pattern of results. Teasing apart environmental and genetic sources of variation provides a useful form of statistical control for genetic factors when estimating the contribution of environmental factors. Over and above the rGE discussed above, there was always a moderate, yet pervasive, nonshared environmental contribution to the association between disruptive behavior and peer difficulties in both kindergarten and Grade 1. Thus, the association between disruptive behaviors and peer difficulties were also partly established and maintained through environmental processes, but again via a child-specific rather than a familywide pathway over time, as shared environment did not play any role in disruptive behaviors, peer difficulties, and their association. In other words, environmental factors also accounted for the fact that children who were disruptive also experienced peer difficulties but always in a unique way for one twin in the family and not the other. It should be noted, however, that environmental factors can interact with genetic factors (see Brendgen et al., Reference Brendgen, Boivin, Dionne, Barker, Vitaro and Girard2011), a possibility that was not examined due to the power constraint of the present study. A gene by shared environment interaction would have generated an excess similarity among MZ versus DZ pairs, and thus an inflated heritability, whereas a gene by nonshared environment interaction would have increased differences among pairs irrespective of zygosity, leading to an inflated E.
The results of the present study are important for our understanding of developmental processes. The strong rGE signals that genes and environments work together in a dynamic mode that may reinforce and exacerbate the initial vulnerability underlying disruptive behaviors. The display of hyperactive–impulsive and aggressive behaviors is likely to create a coercive peer context that could provide the training ground for increased behavior problems and the further learning of antisocial behaviors (Boivin & Vitaro, Reference Boivin, Vitaro and McCord1995; Patterson, Reid, & Dishion, Reference Patterson, Reid and Dishion1992). In other words, some vulnerable children seem to be progressively affected by a dual risk: an initial genetic vulnerability for disruptiveness augmented by a cycle of negative peer experiences in school likely to accentuate their maladaptive pathway. In a recent study, we found that physical aggression at 17 months predicted high chronic levels of peer victimization in preschool and forecasted similar negative experiences at school entry (Barker et al., Reference Barker, Boivin, Brendgen, Fontaine, Arseneault and Vitaro2008). Future genetically informative longitudinal research initiated in early childhood should investigate further the gene–environment nature of this predictive association.
These results also have important implications for the early identification of children at risk and the planning of appropriate early preventive intervention. They indicate that some children are at risk from the early stages of development and that this risk will be increased through a combination of gene–environment processes, including rGE. These vulnerable children should be identified as early as possible. Prevention should target disruptive behaviors as well as the ensuing peer difficulties, but it should start early and persist over time to alleviate the establishment of this negative cycle. Studies have shown that children at risk for various forms of disruptive behaviors can be successfully identified early (Barker et al., Reference Barker, Boivin, Brendgen, Fontaine, Arseneault and Vitaro2008; Huijbregts et al., Reference Huijbregts, Séguin, Zoccolillo, Boivin and Tremblay2007; Leblanc, Boivin, Dionne, Tremblay, & Pérusse, Reference Leblanc, Boivin, Dionne, Tremblay and Pérusse2008; Petitclerc, Boivin, Dionne, Zoccolillo, & Tremblay, Reference Petitclerc, Boivin, Dionne, Zoccolillo and Tremblay2009).
It is important to emphasize that the finding of a substantial genetic association between disruptive behavior and peer difficulties does not mean that the negative developmental pathways are set and irreversible and that intervention efforts are futile. However, they point to the role of child factors in the emergence of peer difficulties and the need of intervening early to possibly alter those characteristics and prevent these negative experiences from becoming entrenched. Evidence of rGE also signals that heritability estimates may hide environmental contributions to development and, thus, should always be interpreted cautiously.
These findings should be interpreted within the limitations of the present study. First, twins may differ from singletons in their peer relations and generalization could be limited. Having a cotwin may provide unique experiences of socialization and some protection from victimization (Hodges, Boivin, Vitaro, & Bukowski, Reference Hodges, Boivin, Vitaro and Bukowski1999; Lamarche et al., Reference Lamarche, Brendgen, Boivin, Vitaro, Perusse and Dionne2006). Second, given the limited sample size, we did not formally test for possible sex differences in the cross-lagged patterns. However, we found no difference between boys and girls in the pattern of univariate ICCs, and mean sex differences were controlled for. Third, the power imbalance implicit to the definition of victimization was not specifically included in the assessments. We measured negative peer experiences more generally. Measures of victimization also mostly referred to overt forms of peer abuse, thus limiting the study of more indirect forms of negative peer experiences. Future studies should also examine the extent to which the pattern of findings holds up for older children, for which the nature and severity of peer difficulties may differ. Fourth, as always with twin studies, the gene and environmental estimates ought to be interpreted within the limitations of the classical twin design, including the assumptions that the environment of MZ and DZ twins are equally similar, and of additive rather than interactive gene and environmental contributions. Failing to meet these assumptions may result in inflated heritability estimates. Genetic and environment estimates are approximation prone to error, sensitive to methodological factors, and may vary across situations. The variance decomposition does not ascertain the causal properties of genes and environment but rather helps refine promising pathways for additional investigations of the aetiological factors at work.
Despite these limitations, this longitudinal twin study provides convincing evidence for a strong rGE linking disruptive behaviors and peer difficulties in the early school years. These results underline the need to adopt an early and persistent prevention framework, targeting both the child disruptive behaviors and the peer context to alleviate the establishment of a negative coercive process and its adverse consequences.