

I. Salience
Only a small percentage of potential legal conflicts make their way into the federal court system. The share that make it onto the Supreme Court docket is smaller still, and Supreme Court cases are indeed special on that ground alone. They tend to be far more important cases than those that are resolved in the lower courts, involving difficult or novel legal questions or resolving conflicts across circuits. These cases can shape and reshape the legal landscape dramatically. But even within that select group of cases, it is clear that some are more important than others, to outside observers, to potential litigants, and to the justices themselves. Taking this varying salience into account can be important in that we think judicial behavior and impact vary contextually. Indeed, salience as a theoretical concept has been implicated in almost every significant question in the field of judicial politics, including bargaining and opinion writing (e.g., Lax and Cameron Reference Lax and Cameron2007), legal development and doctrinal evolution (e.g., Hansford and Spriggs Reference Hansford and Spriggs2006), case selection and certiorari (e.g., Baird Reference Baird2004), judicial voting (e.g., Bailey, Kamoie, and Maltzman Reference Bailey2005), and judicial independence and interbranch relations (e.g., Wohlfarth Reference Wohlfarth2009).
The problem is how to measure salience, as it cannot be directly observed and is not even a monolithic or well-defined concept. Cases vary in their political salience to the public, their legal salience to lawyers and judges, and in a hybrid way to politicians and political elites. Moreover, the extent to which these different conceptualizations of salience are correlated with one another is unclear.
The dominant approach in the extant literature is that of Epstein and Segal (Reference Epstein and Segal2000). They argue, correctly in our view, that media coverage of a case is an indicator of case salience and propose identifying whether each Supreme Court case was covered on the front page of the New York Times as a measure of whether a case is salient or not. As Epstein and Segal note, this measure has a number of benefits. It captures salience as evaluated contemporaneously, tapping into what media elites perceived as salient at a particular point in time. In addition, the measure is easily replicable: the coding rules are exceptionally objective and reliable (a benefit we take advantage of below). However, there are limitations. For example, front-page Times space is a precious commodity (and it has decreased over time), and two cases of the same level of salience may receive different attention in the Times because of exogenous factors, such as newsworthy events. Second, the measure assumes that salience means the same thing for the Times editors as it does for the subjects of political science theories—usually, Supreme Court justices. Third, the valuable but coarse dichotomous sorting of cases into salient or not obscures nuance. Fourth, and perhaps most importantly, coverage measured only after many of the outcomes of interest flips the causal chronology, rendering disquieting many claims of causal inference in which salience affects behavior. As a matter of good research design, many uses of salience in the literature are deeply problematic, even if we ourselves believe their conclusions.
Recent research has sought to directly address the above limitations. Work by Collins and Cooper (Reference Collins2011) expanded the types of postdecision media coverage used to measure salience. Work by Black, Sorenson, and Johnson (Reference Black2013) proposes instead using the participation of justices in oral arguments. As we describe below, these approaches have their own limitations, which we address directly.
Specifically, we develop a measure of Supreme Court case salience that relies at heart on the insights of prior researchers, though taking it a large step further and building a far firmer foundation for the use of salience scores in causal inference. We identify all stories mentioning the Supreme Court from three newspapers—the New York Times, the Washington Post, and the Los Angeles Times—between 1953 and 2010. Using automated text processing tools, we extract from these stories the case that the story discusses and then sort the stories into four types of coverage: coverage before oral argument, coverage of oral argument, coverage of cases pending decision, and coverage of decisions. We then employ a latent variable model to extract a common dimension that explains media coverage across the three papers across the four types of stories. We show that the latent dimension extracted from the model can be substantively interpreted as salience. We note how this process can be augmented to make it part of a larger research design for causal inference. Finally, we apply our measure in replications of a pair of empirical studies that relied on postdecision media coverage or the number of questions asked as measures of salience, and we document the improvement to research possible with our measure. We conclude with remarks about the promise of modern data processing and modeling tools for measurement of political salience in a broader set of contexts. Estimates and code are to be made available, so that theory testing and estimation of salience can be done together, as needed. We see our contribution not as a simple final set of estimates, but as a process to be applied given those aspects of salience invoked by a particular substantive research agenda. It is not that we think that prior invocations of salience reached the wrong results necessarily; we simply argue that a cleaner invocation of salience as a concept will make findings much more convincing to a reasonable skeptic. At a time when experimental political science is once again on the rise, it is good for those working on important questions using necessarily observational data to have clean hands in the timing and nature of measurement.
II. Measuring Salience
To measure salience, one first must ask, What exactly is the latent concept we seek to measure? Salience means different things to different people at different times in different contexts. As Epstein and Segal (Reference Epstein and Segal2000) note, there is a distinction between “retrospective and contemporaneous” salience. Retrospective salience refers to the idea that in hindsight a case was particularly important or consequential. Contemporaneous salience, by contrast, refers to the idea that a case seems consequential or important when it is decided. Epstein and Segal (Reference Epstein and Segal2000) and Collins and Cooper (Reference Collins2011) seek to measure the latter because it is the type of salience more directly implicated by research questions and theoretical arguments in the study of judicial politics.
A second issue, and perhaps one that is more critical to our measurement approach, concerns the concept of salience itself. Does salience mean legally significant? Does salience mean political divisiveness? Does salience mean that a case is particularly attention-grabbing, perhaps because it involves salacious facts or details that appeal to the media? These different notions of salience imply that different observable manifestations might be more or less appropriate for measuring the latent concept. For example, salience in the sense that there are interesting, novel legal questions presented might mean that we want to look to legal commentary as an indicator of legal salience. By contrast, if one is primarily interested in the political salience of a case, then media coverage may be a more reasonable proxy measure.
Complicating matters, these various types of salience (both the temporal and substantive natures) are not necessarily all orthogonal. What makes something salient in hindsight may also make it salient contemporaneously. What makes something legally salient may also make it politically salient. The best we can do, then, is to identify a clearly specified concept of salience; this requires theoretical motivation. Our measurement strategy is to specify a conception of salience that is closely linked to many theoretical models and questions in the extant literature.
To this end, we can think of a case’s salience to a Supreme Court justice as the weight the justice places on the utility she receives from her decision in the case. Conceiving of salience in this way fits with the more general consensus in political science, with salience indicating that an actor cares more about an issue or case (Niemi and Bartels Reference Niemi1985; Collins and Cooper Reference Collins2011). For instance, the president (e.g., Edwards, Mitchell, and Welch Reference Edwards1995) and congressional members (e.g., Mayhew Reference Mayhew1974) may behave differently across salient and nonsalient issues in light of electoral considerations, with greater utility derived from those issues that increase the likelihood of election. By considering salience as the weight a justice places on deciding a case in a particular way, this conception also fits with the great amount of research in the study of the judiciary and judicial behavior. As but one example, we can consider the latent salience of a case as it exacerbates the effect of political disagreement on the justices’ willingness to make concessions in the context of deciding a case. A justice who places a greater weight on the utility of a particular outcome, for instance, may be unwilling to engage in significant negotiations and compromise.
We argue that media coverage of Supreme Court cases is an appropriate manifestation of this type of salience. Scholars have frequently measured importance to political actors by looking to media-based measures (Epstein and Segal Reference Epstein and Segal2000; Canes-Wrone and de Marchi Reference Canes-Wrone2002; Collins and Cooper Reference Collins2011; Vining and Wilhelm Reference Vining2011), as media-based measures offer exogenous and contemporaneous assessments of political discussion. However, we argue that the weight the justice places on a case is not best captured by media coverage at a particular point in time, but rather across the life of the case. Returning to the example above provides insight as to why such a conceptual framework is necessary; the utility a justice places on a decision in a case is temporally disconnected from the coverage of the decision and thus cripples scholars wishing to examine the influence of salience on decision-making behavior. In all, measuring salience across the life of the case offers a flexible approach that is theoretically connected to general notions of salience in political science.
A. Salience and Newspaper Coverage
As noted, the Epstein and Segal (Reference Epstein and Segal2000) measure of salience is the dominant proxy in the literature and has been employed in a variety of substantive literatures. However, it can be criticized as being overly conservative in yielding too many false negatives. On any one day, a multitude of considerations may affect the choice of the New York Times editors, with cases receiving front-page coverage in many other outlets pushed to the back of the paper because of important local news, ideological disagreements, or any of a host of other motivations (Collins and Cooper Reference Collins2011). Aiming to address this limitation, recent research by Collins and Cooper expands on the Times measure by incorporating additional papers and searching the entire paper and generating an additive index of salience.
While a step forward, this approach does not address what is perhaps the most significant limitation of the Epstein and Segal (Reference Epstein and Segal2000) measure. In relying only on media coverage of the decision, these measures introduce posttreatment bias when one wants to investigate the consequences of salience for the type of decision the Supreme Court makes in a case—an issue of central theoretical concern in a number of studies. In fact, this remaining shortcoming has led other scholars to seek alternatives, with Black, Sorenson, and Johnson (Reference Black2013) recently proposing a measure based on the number of words spoken by justices at oral argument. While clever, Black, Sorenson, and Johnson’s measure potentially introduces new biases into the measurement of salience. Most notably, a justice does not speak only as a function of the importance of a case to herself, but as a way of interacting with others, as a function of interactions with others, and in anticipation of the behavior of others.
We instead address the shortcomings of media-based measures noted by Black, Sorenson, and Johnson (Reference Black2013) by incorporating coverage across each stage of the case and across the entirety of multiple newspapers. While there are some limitations to using the media to measure salience, there are a couple of important benefits that we cannot obtain with another indicator. First, media decisions are made contemporaneously to the case itself and therefore do not risk significant influence from retrospective considerations of which cases were important. Relative to other indicators of salience, notably expert lists of important cases maintained by Congressional Quarterly (Biskupic and Witt Reference Biskupic1997) or Oxford (Hall Reference Hall1999), the considerations being taken into account when the media decide to cover a case are more transparent. Second, as Collins and Cooper (Reference Collins2011) demonstrate, we can take advantage of multiple sources of information about salience when we employ the media. Combining media outlets allows us to “average out” idiosyncrasies among sources (e.g., if the New York Times is particularly fond of covering cases that involve the Northeast or particular substantive topics). Related, the media cover cases at different stages of the judicial process, which can allow us to evaluate how different aspects of a case stimulate different types of media coverage.
B. Limitations of Decision Coverage as a Measure of Salience
An Example
As the legal battle over the constitutionality of the Affordable Care Act worked its way through the courts, two lower courts held the law unconstitutional while three upheld the law. The two negative decisions were each given over 1,500 words of coverage on the front page of the New York Times. The three positive decisions received fewer than 500 words of coverage and were covered only on pages A15, A24, and A14. This example highlights a potential problem inherent in using coverage of court decisions to measure salience. Clearly, the underlying salience of the substantive question invoked in these cases is constant or nearly so; yet how the courts dealt with the cases seems to have drastically affected coverage of the decision. While newspaper coverage after the decision might be a manifestation of salience, it might also be a manifestation of choices made by the Court or by others. There is a natural business incentive to cover controversy, biasing coverage in favor of cases with particular features or that have received particular judicial and extrajudicial treatment.
That features of a decision can affect coverage is problematic for studying either the treatment effect of salience on Supreme Court decisions or the treatment effect of Supreme Court decisions on salience. In particular, there are two potential types of bias this measure can create for conclusions derived from common research designs in judicial politics.
Ex Post Measures of Salience Introduce Ambiguous Bias When Studying the Effect of Salience on Supreme Court Decisions
Consider first the use of newspaper coverage of Supreme Court decisions to study the effect of salience on the Court’s decision making. This practice is fairly common in the literature (for examples of this approach, see Maltzman, Spriggs, and Wahlbeck [Reference Maltzman, Spriggs and Wahlbeck2000], McAtee and McGuire [Reference McAtee and McGuire2007], Collins [Reference Collins2008a], Corley [Reference Corley2008], Wohlfarth [Reference Wohlfarth2009], and Cross et al. [Reference Cross, Spriggs, Johnston and Wahlbeck2010]). If we find that the justices tend to do X instead of Y in more salient cases using decision coverage as the measure of salience, we cannot distinguish among the following: (1) salience causes X to be chosen over Y; choosing X over Y makes decision coverage more likely; (2) X is chosen over Y in cases that are more salient, but salience does not cause this choice; and (3) newspapers like to cover behavior X, and so even though cases do not vary in true salience or true salience does not cause choice X, we see more X in cases covered by the newspapers and so find that salience is correlated with X, implying a causal connection when there is none.
While claims of causation are always suspect in observational research, measuring a treatment by proxy after the observed outcome is a particularly troublesome form of posttreatment bias. If decisions and related choices affect the salience measure (coverage of the decisions themselves), then even if salience itself affects decisions or choices, our estimate of that effect can be biased in an unknown direction.
Ex Post Measures of Salience Introduce Upward Bias When Studying the Effects of Supreme Court Decisions on Salience
Consider next the use of newspaper coverage of Supreme Court decisions to study the effect of Supreme Court actions on salience. One may be interested to know, for example, whether a divisive Supreme Court decision increases the political salience of a case. An example may be the Court’s decision in Kelo v. City of New London. This case involved an eminent domain action by the City of New London, Connecticut; the case attracted little attention before it was decided, but after it was decided, it became a source of national attention. Indeed, it remains so years later.
Unfortunately, using coverage of a Supreme Court decision to evaluate the effect of the Court’s decision on the issue’s, or the case’s, political salience creates bias in our inferences. When we observe that feature or behavior X rather than Y is more likely to lead to ex post coverage (salience by that measure), we cannot distinguish among the following: (1) behavior X causes more coverage; (2) X is chosen over Y in cases that are actually more salient by nature, but X does not actually lead to more coverage—cases in which X occurs are already more salient; and (3) if behavior X is chosen in cases that start out salient and causes salience to decrease (rendering a potentially big case trivial), we do not consider these cases salient and thus omit evidence that X had the opposite effect on salience. Given this, if we measure the effect of divisiveness on coverage, then our estimate of the effect of divisiveness will be biased upward.
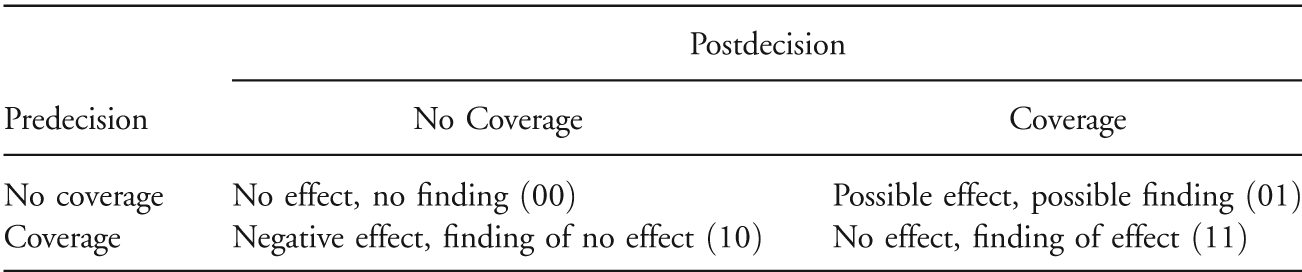
To see this, let us simplify so that there are four types of cases, depending on the combination of having coverage before the decision or not (precoverage), along with having coverage after the decision or not (postcoverage). We can denote the possibilities as 00, 01, 10, and 11, where 00 denotes no coverage before or after the decision, 01 denotes coverage after but not before, 10 denotes coverage before but not after, and 11 denotes coverage both before and after. Suppose that we do not control for precoverage (coverage before the decision) as a proxy for latent salience when measuring the treatment effect of divisiveness on postcoverage as a measure of salience. For example, perhaps divisive Court decisions involve bigger changes to the law than striving for unanimity would allow. When we have 00 (no coverage either time), there has been no effect and we would not attribute any. When 01, there is (possibly) an effect and we would think there might be. When we have 11, we would think we have a treatment effect (seeing postcoverage), but the case was “already” salient, so that we would be falsely finding evidence of a treatment effect. And when we have 10, we would see no salience and say no treatment effect; but actually the case “started out” as salient and then became less so, so that the effect would be negative but we would think it zero. To restate, when we pool together the non-postcoverage cases (00 and 10), we see evidence of no treatment effect despite the potential negative treatment effect for some of these cases (10s). When we pool together the remaining cases (01 and 11), we take all of them as evidence for a treatment effect (when there is a treatment applied), but only the first subgroup of these are clean evidence of an effect. Thus, upward bias results when using only postcoverage to assess the effects of Court actions on case salience. We summarize these possible biases in table 1.
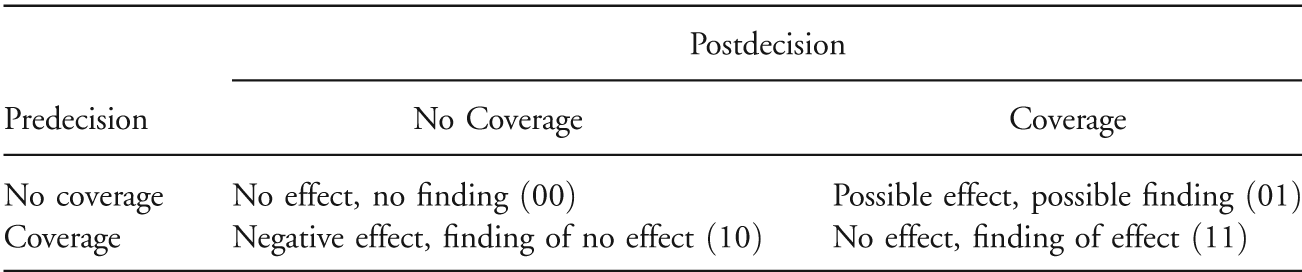
Note.—The table summarizes the effect of relying only on postdecision media coverage to study the effect of a Supreme Court decision on an issue’s salience.
Effects of the Limitations on Existing Literature
These practical limitations with the existing data have limited the ability of scholars to effectively address important questions in the literature. First, existing studies have been limited in their ability to study the effects of salience on Court decision making. In many instances, scholars have relied on the ex post measure of case salience to study intra-Court decision making and bargaining (e.g., Maltzman et al. Reference Maltzman, Spriggs and Wahlbeck2000; McAtee and McGuire Reference McAtee and McGuire2007; Corley Reference Corley2008; Wohlfarth Reference Wohlfarth2009; Cross et al. Reference Cross, Spriggs, Johnston and Wahlbeck2010). Less common, but nevertheless important, are studies of separation-of-powers interactions (e.g., Wohlfarth Reference Wohlfarth2009) and the judicial hierarchy (Baird Reference Baird2004). However, for the reasons articulated above, inferences drawn about the ways in which salience affects the choices judges make may be biased or incorrect despite the care taken by such scholars in reaching their conclusions. Second, there exist questions that have not been asked, which may be a consequence of the unavailability of a reliable measure of underlying case salience. How does salience affect the decision to appeal a case? How does salience affect amicus group participation? How does salience affect the decision to grant certiorari or the tenor of oral arguments? And, there exist theories of bargaining and opinion writing that directly implicate the salience of a court case but have not been tested, in part because of the unavailability of a measure of case salience (e.g., Lax and Cameron Reference Lax and Cameron2007).
Moving Forward
By making use of additional information, we can develop a sophisticated measure that overcomes some concerns above and mitigates others, helping us put existing findings on a firmer footing and seeking new ones. In particular, we suggest that by considering coverage of Supreme Court cases at all stages of the case, we can help disentangle salience from other factors that may affect newspaper coverage while also developing a deeper understanding of what drives different types of coverage of Supreme Court behavior.
III. A New Measure of Case Salience
As noted, the “political salience” of a Supreme Court case is a latent characteristic of the case—we cannot directly observe it. Rather, we observe certain manifestations of the underlying salience, such as media coverage of the case. Indeed, the insight made by Epstein and Segal (Reference Epstein and Segal2000) and built on by Collins and Cooper (Reference Collins2011) rests precisely on the assumption that newspaper coverage of a case’s decision is a manifestation of latent political salience. We extend this logic by assuming that coverage of a Supreme Court case, at any stage of the case’s life, is a manifestation of latent salience.
A. A Measurement Model for Latent Salience
We propose a measurement model for estimating latent salience. That is, we design a model that we think captures the relationship between observed indicators and salience. While we estimate and focus on a single version of the model in this article, that choice is primarily for expositional clarity. It is important to underscore that the model can be modified and adapted to best match the theoretical questions motivating a particular research agenda. Most notably, for purposes of thoroughness, we include data on newspaper coverage of case decisions, though as was made clear above, there are many research questions for which it is more appropriate to exclude those data from the estimates. The public data release, available on Dataverse, includes estimates from a variety of specifications as well as all of the necessary code and data to customize the measurement model to one’s particular needs.
To capture the latent salience of which we hypothesize newspaper coverage is a manifestation, we specify a latent variable model. In particular, we assume that the number of stories about a case in each paper—distinguishing among stories about the decision to hear the Supreme Court case (i.e., grant certiorari), stories about oral argument, stories about pending cases, and stories about the final decision—is a Poisson random variable, a count variable with a rate parameter that is a function of the latent salience of the case, as well as stage-, newspaper-, and term-specific intercepts. We assume that the relationship between the linear predictors and the mean of the distribution function is logarithmic (i.e., we use a logarithmic link function between the intercept-salience function and the rate parameter). Our model is given by


Stories
csn
is the number of stories about case c at stage s in newspaper n, t[c] identifies the term in which case c was decided,
 is an array of parameters to be estimated,
 is a matrix of parameters to be estimated, and
 is an unobserved vector of latent dimension locations. We estimate equations (1) and (2) via Markov chain Monte Carlo (MCMC) Gibbs sampling.Footnote 1 The estimates reported below are based on a 20,000-iteration sample, with a discarded 5,000-iteration burn-in period. Standard diagnostic procedures suggest that the model converges and chains mix within the burn-in period.
Before turning to our estimates, we briefly discuss a few important modeling choices we made. Perhaps most notable, we adopt a very sparse model. That is, we specify a model that can capture only a single latent factor that results in manifestations of newspaper coverage. Alternatively, one might want to include either (a) alternative variables as additional manifestations to be modeled or (b) covariates that might explain newspaper coverage.Footnote 2
In addition, we employ the number of stories about a case rather than a dichotomous indicator of coverage. Our logarithmic link function prevents the model from attributing very high levels of coverage of one case at a single stage in a single paper to a high level of latent salience. This modeling assumption keeps with the initial insight behind our measurement approach: that coverage at multiple stages of a case is more informative than simply examining coverage at the time of decision.Footnote 3
Finally, it bears noting that we index the intercept by Supreme Court term because, given the discussion above and variation in coverage over time documented in Collins and Cooper (2011), we expect temporal trends in the rate at which the three newspapers in our data cover the Supreme Court.Footnote 4 Rather than include a temporal trend as a covariate in our model, we allow newspaper-stage-intercepts to vary over time.Footnote 5 Indexed intercepts allow for a flexible estimation of the temporal patterns in media coverage, addressing a potential shortcoming of dichotomous or indexed coverage measures.
B. Data
We apply our measurement model to an original database of media coverage of Supreme Court cases. We assemble data on media coverage of Supreme Court cases from three national newspapers: the New York Times, the Washington Post, and the Los Angeles Times. We choose these three papers, as other scholars have, because of their geographical and ideological variance. The New York Times is an eminent national newspaper and was selected by Epstein and Segal (2000) for that very reason. The Los Angeles Times is the eminent paper for the West Coast and is generally perceived as a more conservative paper (Segal and Cover 1989). Finally, the Washington Post is primarily politically oriented and thus likely to cover the happenings of the Court with different emphases than other outlets.Footnote 6
To assemble the data, we use the search engines Lexis-Nexis and Proquest to acquire for each newspaper all articles from 1953 through 2010 that (a) feature the string “Supreme Court” and (b) appear anywhere in the first section of the newspaper rather than simply on the front page. In total, we acquired 188,403 such articles. To associate articles with the cases they discuss, prior research on media coverage of Supreme Court decisions used human coders (Epstein and Segal 2000; Collins and Cooper 2011), identifying coverage through careful research and manual annotations. We began this project the same way but then moved to an automated approach.Footnote 7
Though a variety of automated approaches are viable for this task, dictionary-based automated coding is most appropriate. While often burdensome, in that these approaches require constructing a large list (dictionary) of actor names to guide searches (Gerner et al. Reference Gerner1994), a preexisting actor dictionary for the Supreme Court exists in the form of docket numbers and case names and is readily available from the Supreme Court database (SCD; Spaeth et al. Reference Spaeth, Ruger, Whittington, Segal and Martin2012). With a completed dictionary, the cost of analyzing text is “as low or lower than” other coding methods (Quinn et al. Reference Quinn2010, 212). To further enhance the accuracy of our automated coding, we use a particular form of natural language processing, named entity recognition, to retain only named entities—persons, organizations, or states—in article texts. Our programs then use three methods to perform the task of matching articles with cases.Footnote 8
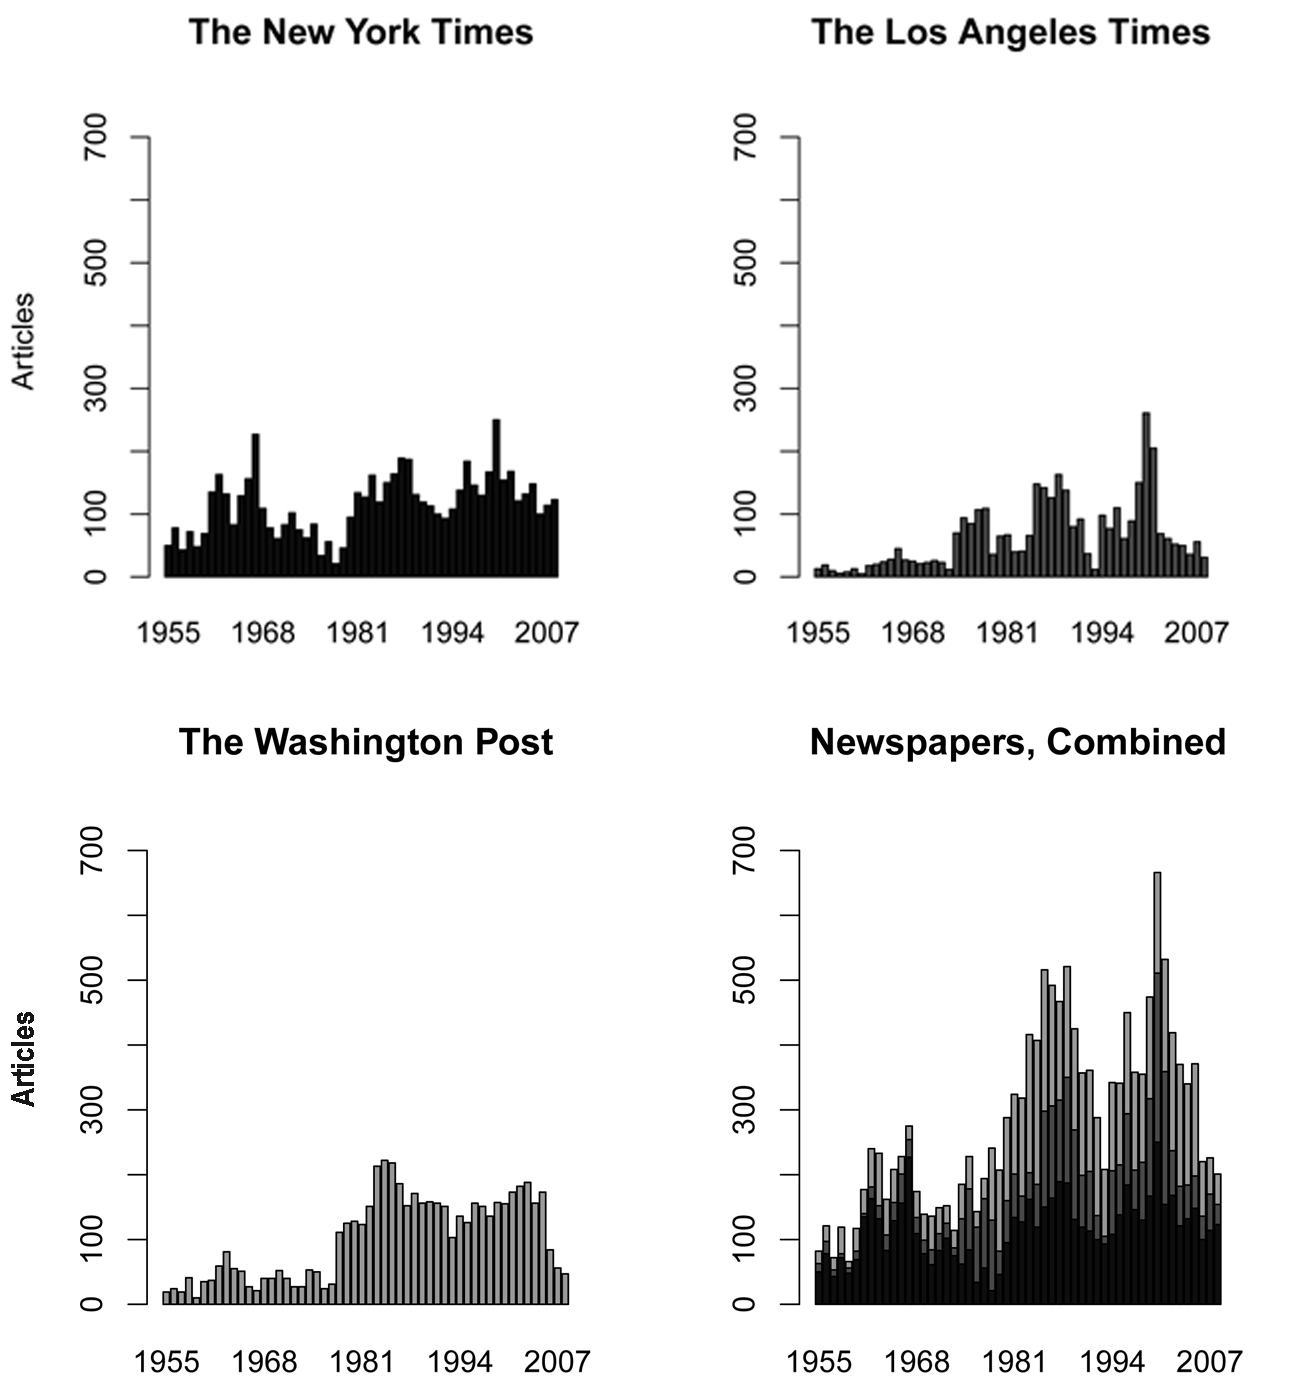
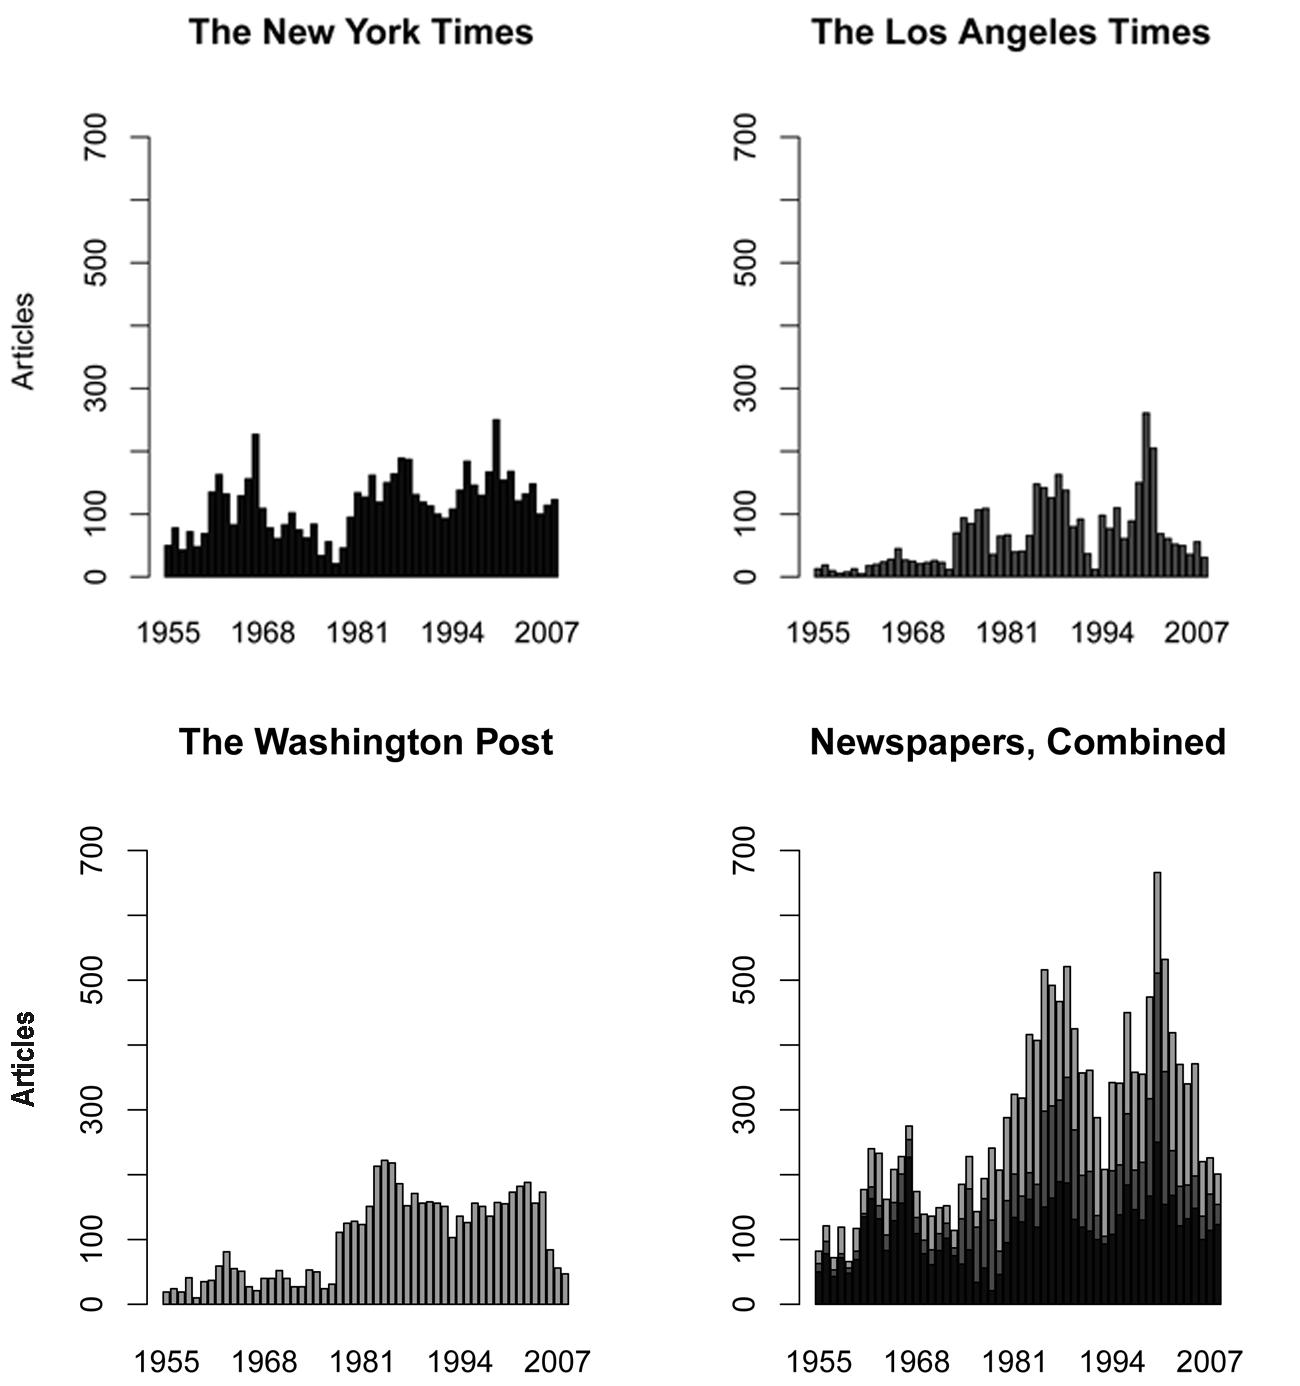
Having matched the articles to particular cases, we use the SCD to identify the date of oral argument and the date of the decision and use another program to extract the date of article publication. We then classify articles into one of four mutually exclusive media coverage categories: (1) early coverage, or any article published prior to 1 week before oral argument but not more than 1 year from the announcement of the decision; (2) argument coverage, or any article published within 1 week of oral argument; (3) pending coverage, or any article more than 1 week after oral argument but before the decision is announced; and (4) decision coverage, or any article appearing after the decision is announced out to 1 year. While we use coverage at all of these stages in our analysis, it is important to underscore that one benefit of our approach is that one could simply exclude the postdecision coverage from our estimation when there are concerns about posttreatment bias. Figure 1 features plots of total newspaper coverage for Supreme Court cases for each term from 1955 through 2008. For the New York Times, we identified 6,262 instances of a case being addressed in an article; for the Los Angeles Times, 3,490 instances; and for the Washington Post, 5,463 instances. Of these, 3,735 were early coverage of Supreme Court cases, 502 were pending coverage, 4,181 were oral argument coverage, and 6,797 were final decision coverage. Overall, from at least one newspaper, 27.1% of Supreme Court cases received early coverage, 38.1% received oral argument coverage, 4.5% received pending coverage, and 42.2% received coverage of a decision.
Newspaper coverage of Supreme Court cases by Supreme Court term: Number of articles covering Supreme Court cases in newspapers during each term (1955–2008), plotted by newspaper and in the aggregate.
C. Results: Model Parameters
We first describe the estimates of the ancillary parameters in the model—the
 and
 parameters. Recall that we index the intercept (
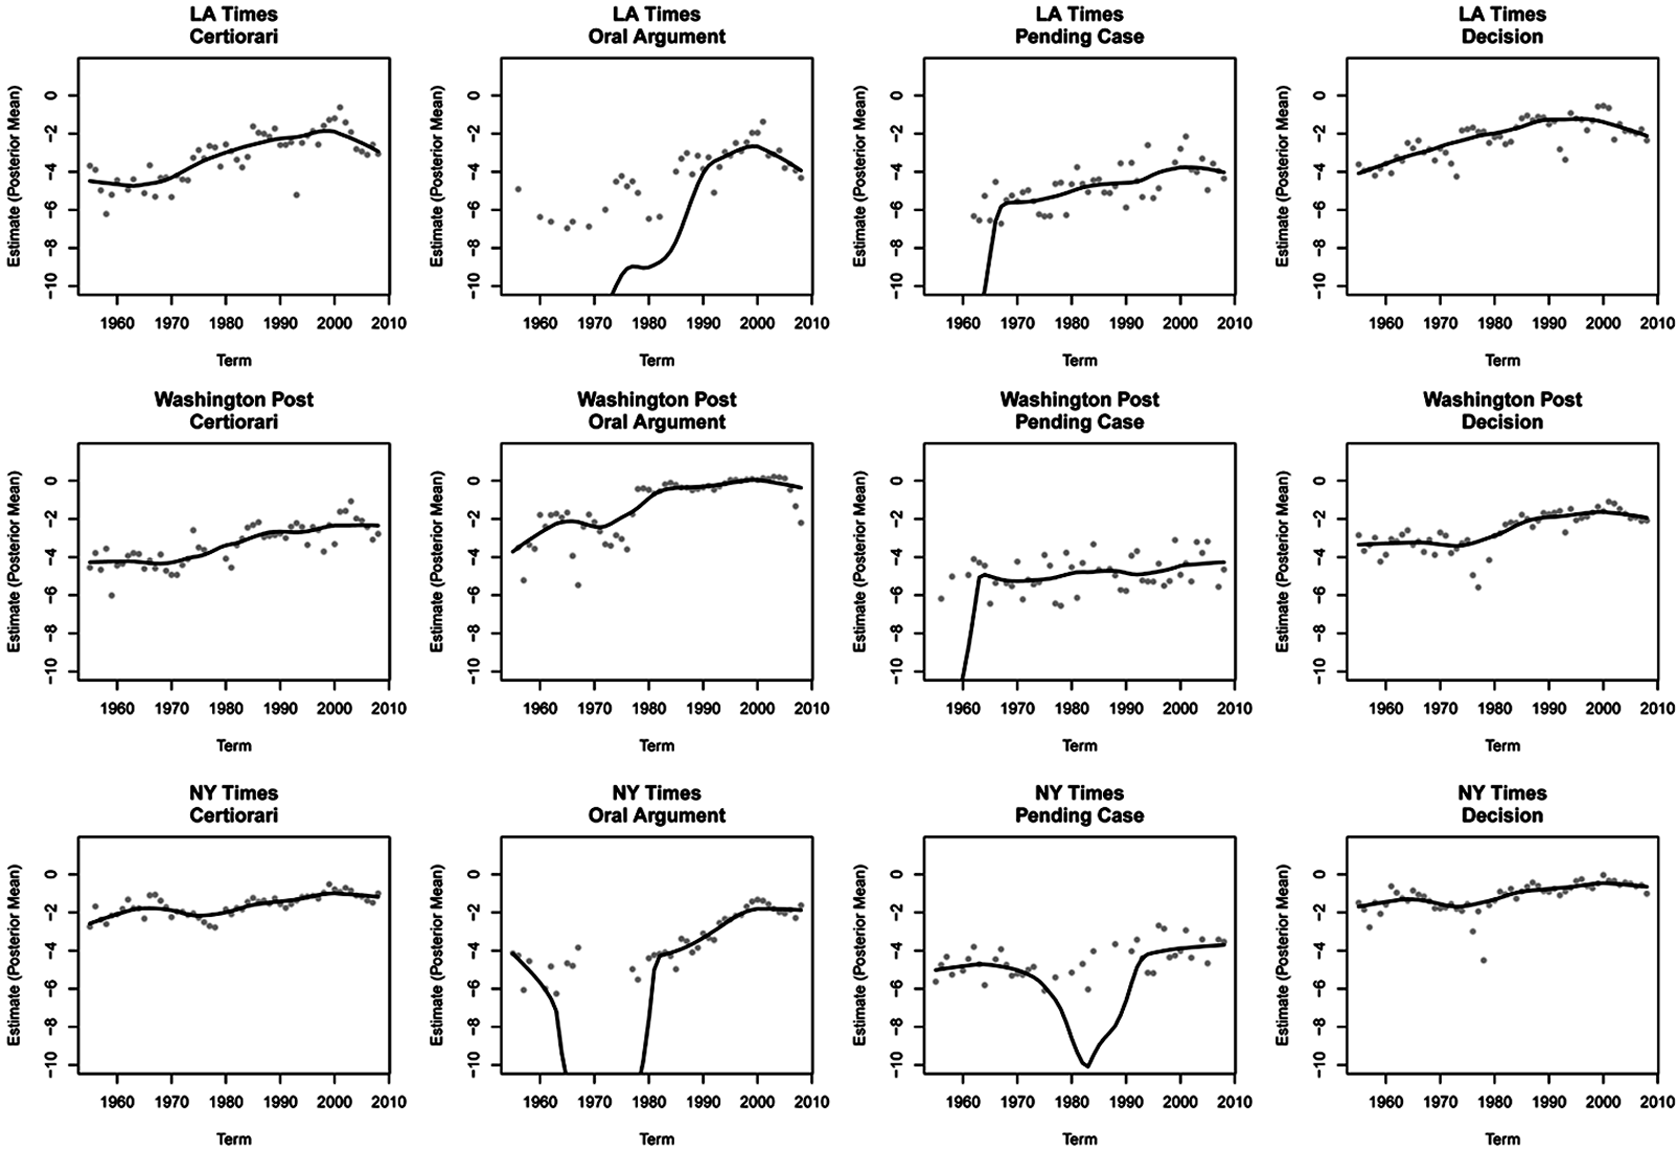
 ) by newspaper, stage of coverage, and term of case. Figure 2 plots our mean posterior estimates, or Bayesian estimates, of the intercept for each newspaper for each stage of coverage for each term. This figure reveals a number of interesting patterns. First, the temporal patterns are fairly consistent across all three newspapers (looking down a given column in fig. 2, there is not much variation). Second, there do seem to be some temporal patterns. Most dramatically, the baseline probability of newspaper coverage of oral argument for the average Supreme Court case has increased. At the same time, the probability of coverage of certiorari or the final decision has increased, although much less dramatically. Finally, the probability that a case is covered while it is pending a final decision has not changed considerably. These patterns possibly merit further examination in and of themselves.
Posterior estimates of
 parameters (stage-, newspaper-, and term-specific intercepts). Figure shows each intercept’s posterior mean, organized by stage of coverage, newspaper, and term, 1955–2009.
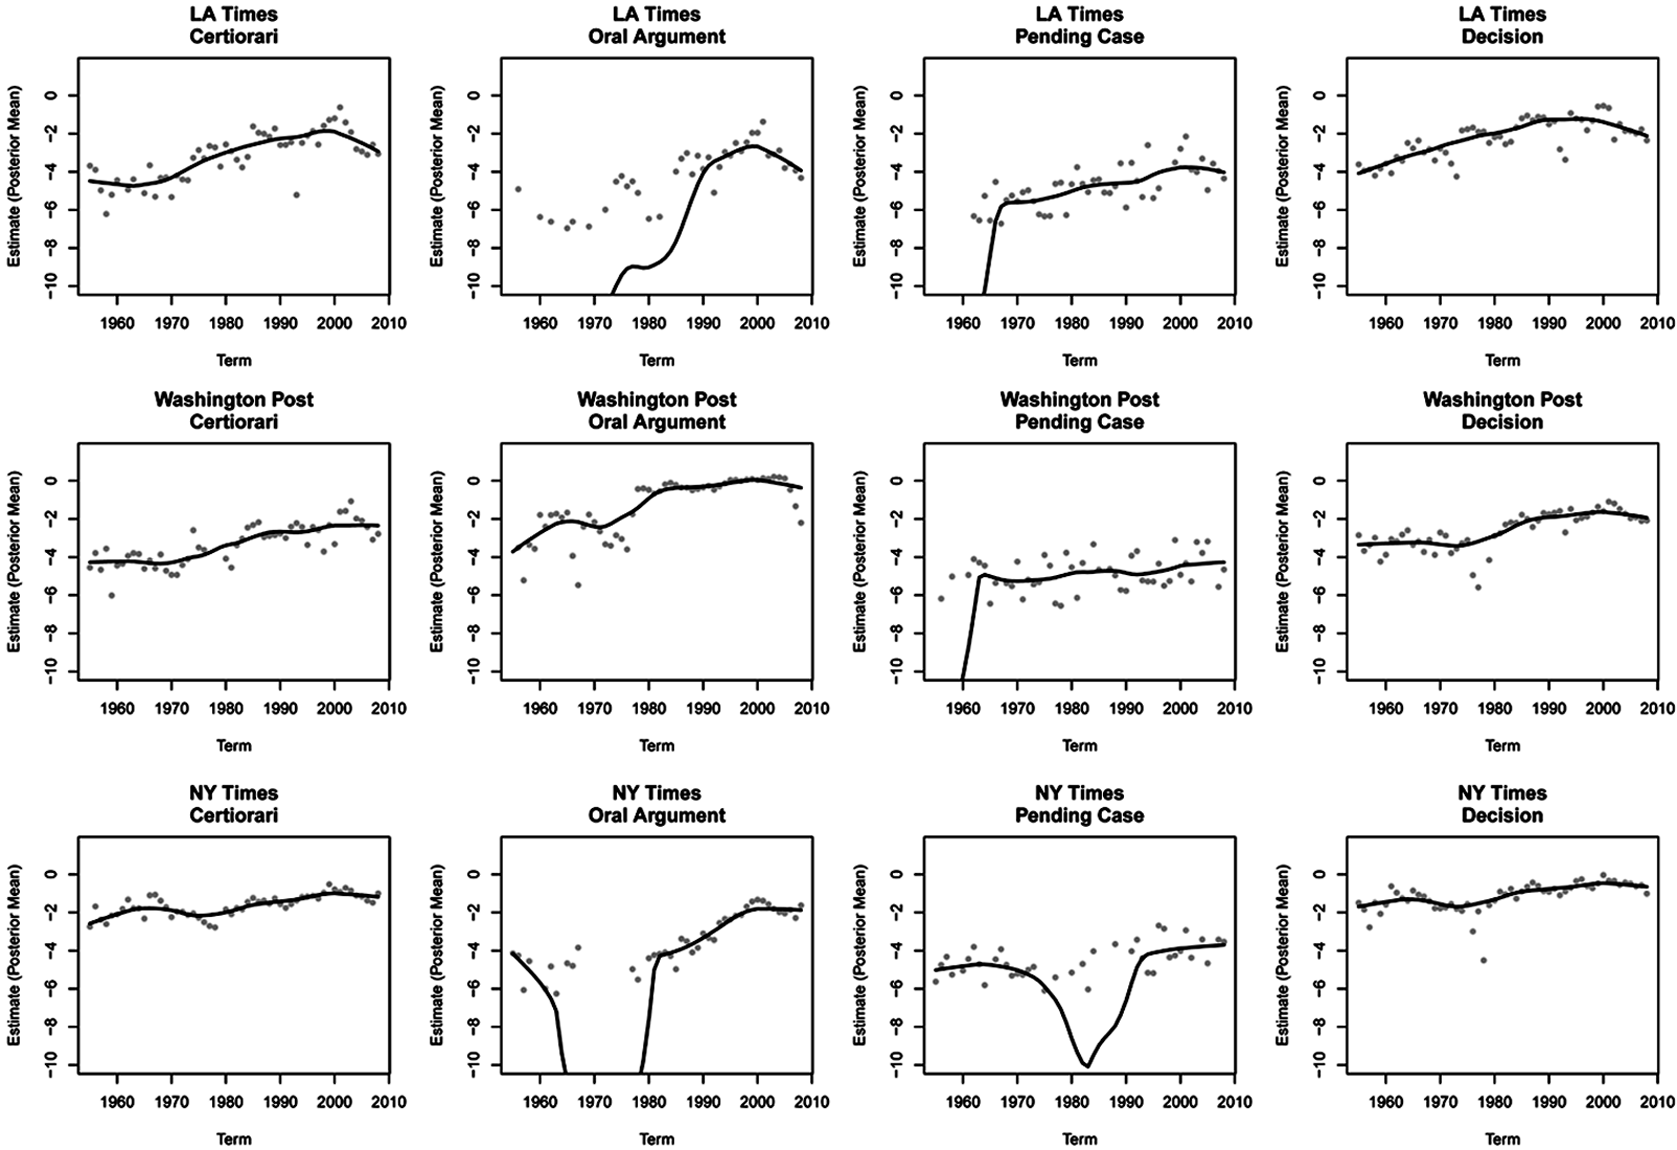
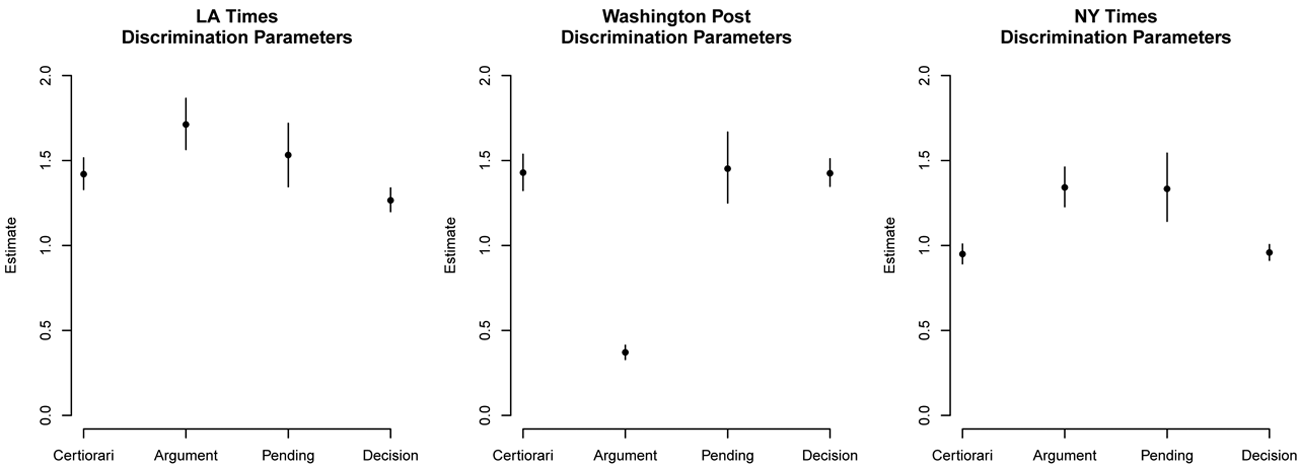
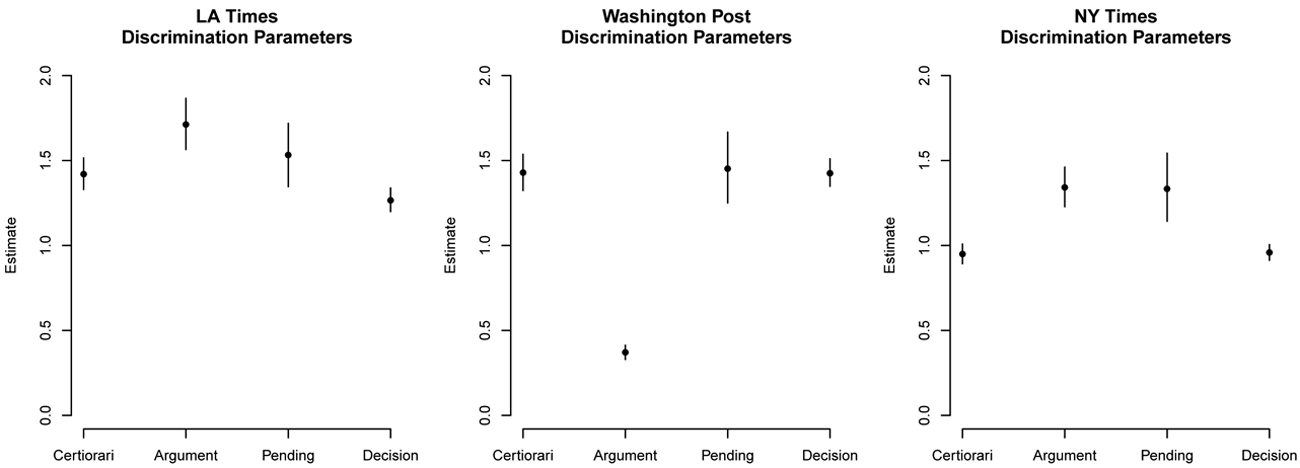
Figure 3 shows our estimates of the discrimination parameters for each newspaper and stage of coverage. The points show posterior means, and the bars show 95% high-density credible intervals.Footnote 9 These estimates capture the extent to which the latent dimension discriminates between coverage and no coverage at each stage in each newspaper. In other words, a discrimination parameter measures the extent to which changes in the latent dimension (our estimate of salience) are associated with changes in newspaper coverage. Perhaps most striking, the estimates suggest a different pattern of coverage across the three newspapers. For example, in the New York Times, latent salience discriminates most between cases covered during oral argument and those not covered during oral argument. The large discrimination parameters indicate that changes in latent salience are associated with large changes in the probability of coverage of oral argument. In the Washington Post, by contrast, latent salience discriminates least among cases whose oral arguments are covered. There is less variation from stage to stage in the LA Times than in the other two papers: our posterior estimates of the discrimination parameters indicate that changes in salience are associated with comparable changes in media coverage at all stages. Critically, though, in each instance, the discrimination parameter we estimate is both positive and substantively large, suggesting that the latent dimension we model can effectively parse among cases that are covered and not covered, at each stage.
Posterior estimates of
 parameters (stage- and newspaper-specific discrimination parameters). Figure shows the posterior estimate (mean) for the discrimination parameter for each newspaper and each stage of coverage, with 95% high-density credible intervals.
D. Results: Estimates of Salience
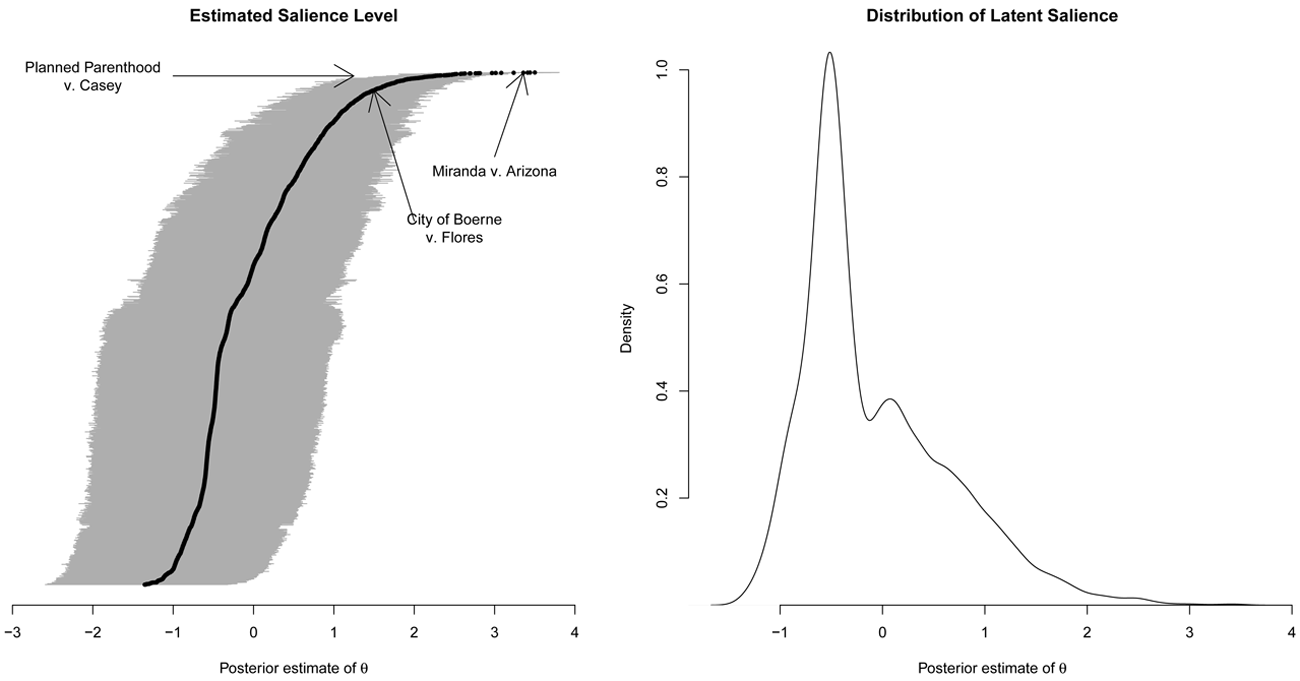
Figure 4 summarizes our posterior estimates of case salience. The left panel shows each case, ordered by our mean posterior estimate of  (the latent dimension); the black dots show the posterior mean and the gray area shows the 95% posterior credible interval. The right panel shows a kernel density smoother of all cases’ posterior means. A number of patterns emerge. First, as we see in the left panel, most cases clump together at one end of the dimension; these are the cases that receive virtually no newspaper coverage. Because there is essentially no variation in the manifest variables for this large group of cases, our estimator places them all together on average but also is subject to a greater degree of uncertainty. As cases increasingly receive media coverage (at any stage), our posterior estimate moves them to the right, and the greater amount of information means that we have more certainty in our posterior estimate. At the far right—the cases that receive the most media coverage—we have the least uncertainty, owing to the greatest amount of distinction from the bulk of cases.
Posterior estimates of latent salience, all cases. Figure shows distribution of posterior estimates of latent salience. The left panel shows each case; the black dot shows the posterior mean and the gray bars show 95% high-density credible intervals. The right panel shows the kernel density plot of posterior means of all cases.
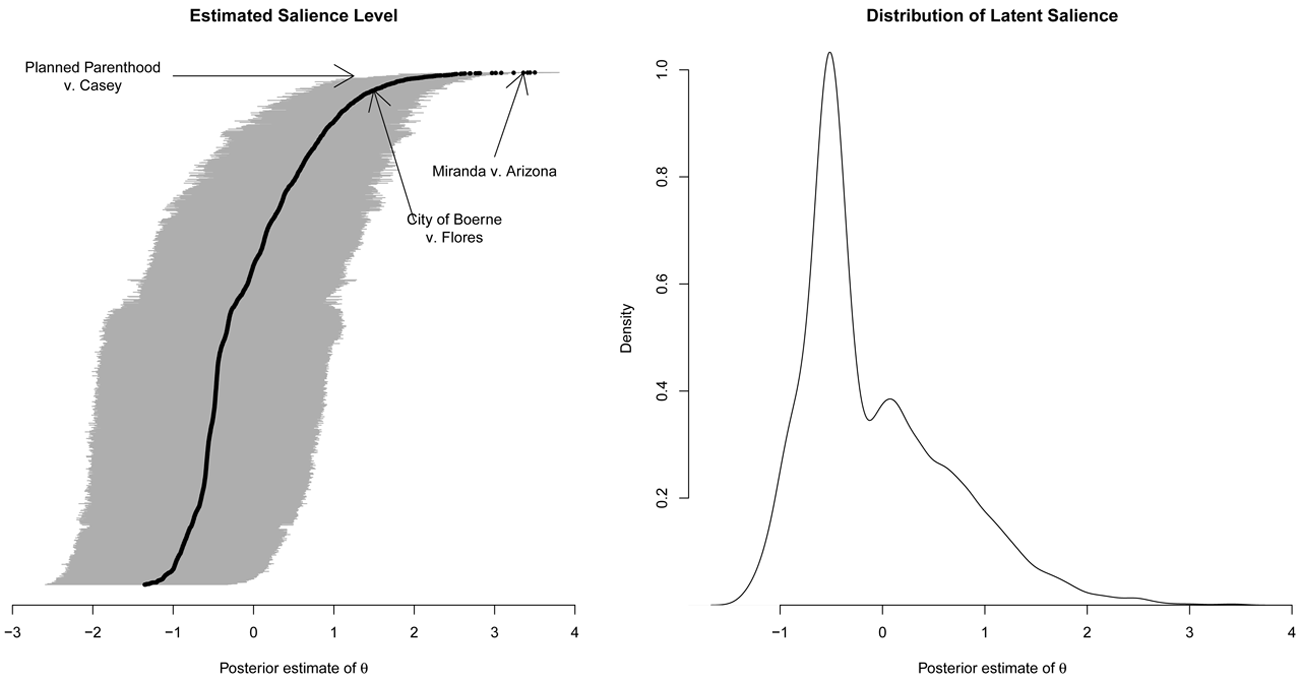
The right-hand panel in figure 4 shows the distribution of all posterior means. The pattern we see here has a few important features. First, it is bimodal: there is a large group of cases that receive no media attention (the hump at the far left), and there is another, smaller group of cases that receive more media attention (the hump at the right). Second, among those cases in the latter category, there is considerable variation in their latent propensity to be covered by the media. There is more spread within that group than the less salient group, and there is a longer tail to the right, reflecting a finding that some cases have a very high propensity to be covered by the media.Footnote 10
What is more, the rank orderings make qualitative sense.Footnote 11 The case with the highest location on the latent dimension is Regents v. Bakke, one of the most high-profile affirmative-action cases in history. In addition, many of the most well-known cases in the Court’s constitutional doctrine are at the high end of our dimension. We illustrate a few of these in the left-hand panel of figure 4. Miranda v. Arizona, which established the well-known “Miranda” rights, is the fifth-highest case on our dimension, far out in the tail. Our high estimate of this case is due to extensive coverage of the decision. The LA Times, Washington Post, and New York Times ran four, five and 19 stories about the decision, respectively. Further down the scale we find Planned Parenthood v. Casey, which reaffirmed the primary right to abortion held in Roe v. Wade but established a new framework for evaluating restrictions on that right. That case was covered in all three papers at all four stages, including three stories about certiorari in both the LA Times and the Washington Post. Indeed, much of that coverage was primarily driven, we suspect, not by the fact that Casey modified the rule from Roe but instead because it was such a politically salient case to which many people were paying attention. As these examples suggest, we identify a latent dimension that is affected by both the range of coverage (at what stage a case is reported) and the extent of coverage (how much attention the case receives at any given stage).
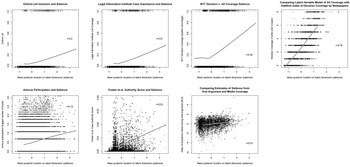
We now turn from a description of the estimated latent dimension to substantive interpretation. We have shown that we can estimate a latent dimension that captures systematic variation in media coverage. However, we have yet to show that this dimension corresponds to salience as we have conceptualized it, other than the discussion of individual cases above, which suggests support for our interpretation. Figure 5 compares our estimates of the latent dimension to other indices that have been used in the literature as proxies for salience, providing evidence of convergent and discriminant validity (Quinn et al. 2010). The first two panels in the top row compare our latent dimension with expert-generated lists of important cases. The top-left panel compares our dimension to the Oxford list of significant cases; the top-center panel compares it to the Legal Information Institute’s list of significant cases. In both of these panels we see a sharp correlation. Cases at one end of our dimension are almost never on either list, whereas cases on the other end of our dimension are very often on one (or both) of these lists. In other words, our measure, which is a summary of media coverage, is highly correlated with expert lists of significant Supreme Court cases. Importantly, this need not be so; the expert lists could be measuring something different than what motivates the media to cover the cases. At the very least, we might expect that the expert lists are primarily retrospective in nature, whereas media coverage is contemporaneous in nature. Our analysis suggests that there is a common underlying trait that attracts the attention of both the media and the experts; we believe that this is salience.
Interpretation of latent dimension. Figure compares the posterior estimate (mean) of latent dimension location for each case against other measures of case salience. The top row compares our measure against lists of salience based on the decision—expert lists of important cases and media-based measures of salience. The bottom row compares our measure with indices based on features of the case, including amicus participation, citations in the opinion, and questions asked during oral argument.
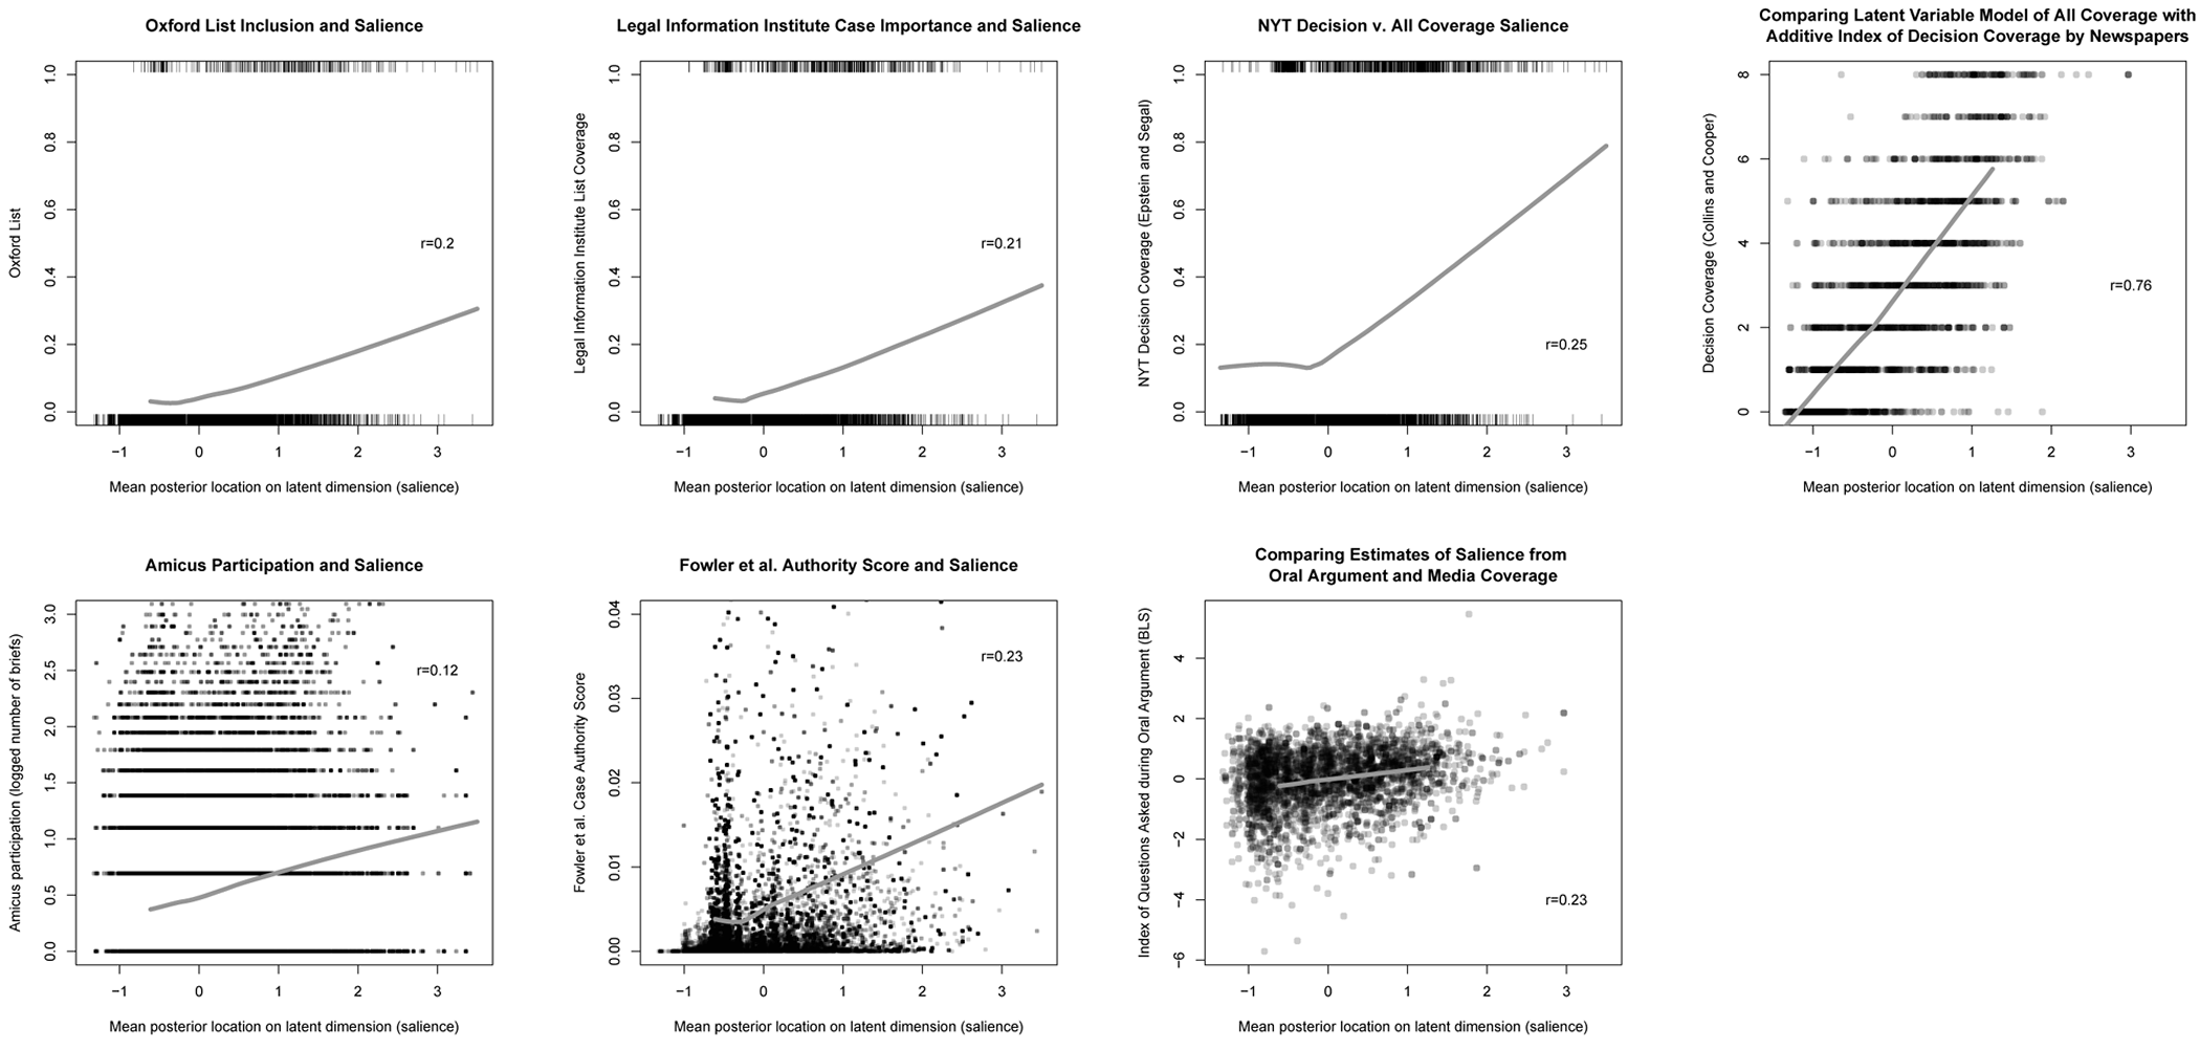
In the next two panels of the top row, we compare our measure against other media-based measures of salience: the Epstein and Segal measure of salience based on New York Times coverage of the decision and the Cooper and Collins measure of salience based on coverage by multiple newspapers. As these panels make clear, there is also a positive relationship between our measure and the other measures of salience based on media coverage. Of course, the media indicators are one component of our measure, so we should expect there to be a strong correlation, which we find. Our measure, however, adds important additional information by virtue of incorporating coverage at multiple stages. It follows that there are notable points of discrepancy between our measure and theirs. Consider a few illustrations. The case Regan v. Wald upheld, by a vote of 5–4, restrictions on US travel to Cuba; the case was particularly salient at the time given the subject, but it does not appear on the Epstein and Segal list. By contrast, Duquesne Light Co. v. Barasch is a case in which the Supreme Court upheld a decision of the Pennsylvania Supreme Court as to rate setting by Pennsylvania electric utilities. While potentially important, it certainly does not rise to the level of what one might call politically salient.
In the bottom row, we compare our measure against other measures of salience based more on features of the case. We find at most very weak correlations.
Taken together, these results all suggest that our model yields estimates that are facially valid indicators of a case’s salience. In addition, the estimates rank the cases in a sensible way, as we find that significant, landmark cases are generally at one end of our latent dimension, whereas more minor cases are at the other end of our dimension. Obviously, given our arguments throughout, we do not think that similarities to other scores validate ours nor that dissimilarities invalidate them. Rather, we show sufficient similarity to the more similar measures and such differences as one would expect from others given our arguments such that, given our theoretical arguments and examples, readers should see that our method is believable and improves on existing measures.
E. Modeling Choices
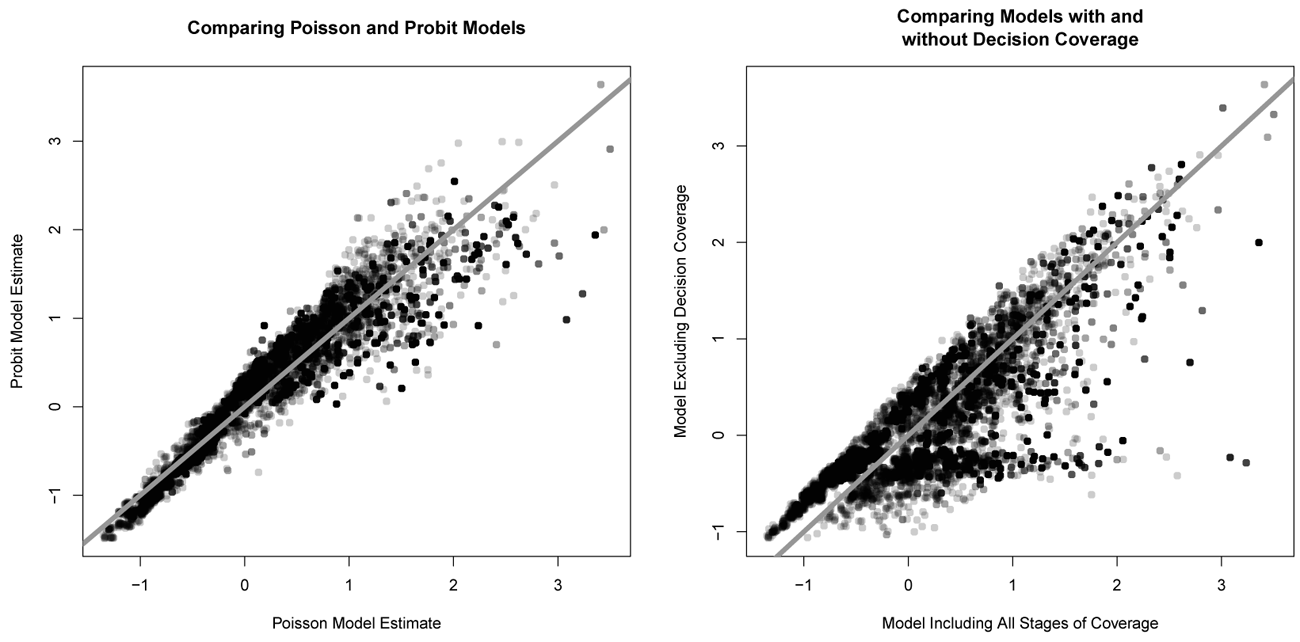
As noted above, we make a number of modeling choices that have the potential to affect our estimates. Here, we investigate the consequences of two choices in particular: the use of the count of stories rather than an indicator for whether a case is covered and the inclusion of postdecision coverage. With respect to the former, one might worry that some cases receive extensive coverage for reasons unrelated to their salience, thus artificially inflating their estimated salience relative to what one would estimate if we treat any level of coverage the same. To address this concern, we transform our counts of stories at each stage to simple indicators for whether there is any coverage and reestimate our model using a probit specification rather than a Poisson specification. The left-hand panel of figure 6 compares the estimates from the probit and Poisson specifications. As this figure makes clear, there is no systematic difference between the two estimates, suggesting that the choice of counts of stories as opposed to indicators for any coverage at all does not affect the inferences we draw.
Effects of modeling choices. This compares two different models against the main model. The left-hand panel compares estimates from a probit model in which we employ an indicator for coverage at each stage rather than a count of the number of stories at each stage. The right-hand panel compares estimates from a model that excludes coverage of a case’s decision against the model that includes coverage at all four stages.
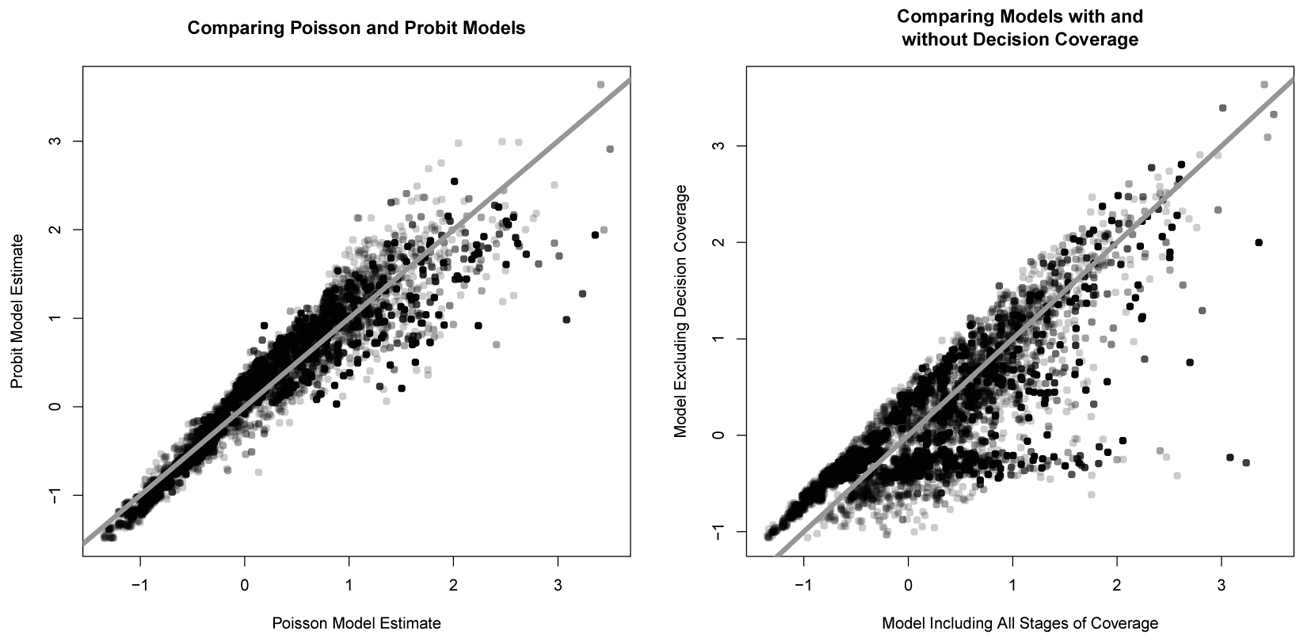
With respect to the second issue, whether the inclusion of postdecision coverage affects our estimates, we again reestimate our model, but including only the first three stages of coverage and excluding decision coverage. The right-hand panel of figure 6 compares these two sets of estimates. Generally, there is little difference between the two models. The notable exception is that there are some cases (toward the bottom of the plot) that are estimated to be of high salience when we include postdecision coverage and are estimated to be of low salience when we exclude postdecision coverage. These are the “surprise” cases—ones that attracted relatively little media attention before the decision but then attracted much attention after the decision. As noted above, some research questions are particularly concerned with either ex ante salience’s effect on decision making or the effect of decision making on a case’s salience. The discrepancy between these estimates highlights the consequences of relying on postdecision salience for inference in those contexts.
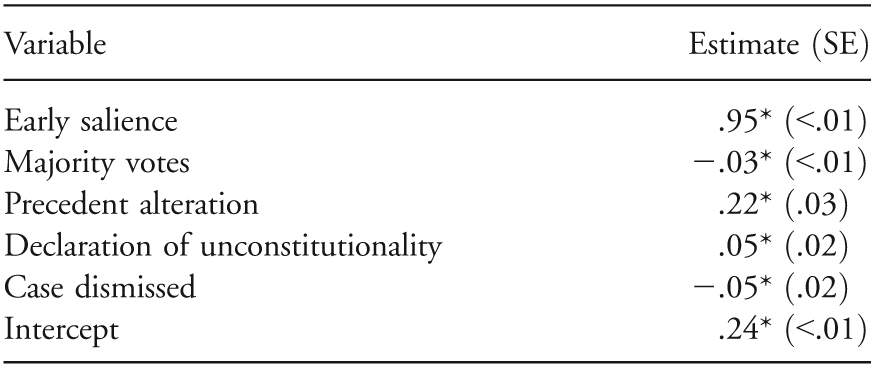
What explains these “surprise” cases? One contribution of our approach is to take seriously the causal chronology; such an approach is warranted in part because characteristics of the decisions themselves may lead to additional media coverage. To see this, we estimate a linear regression, predicting salience estimated with decision coverage as a function of predecision salience and a host of decisional characteristics that may be theoretically linked with coverage of the Court’s decision. The results appear in table 2. As would be expected, and as we discuss above, predecision salience is highly correlated with decision salience: the coefficient is almost exactly 1. Other characteristics of the decision, however, correlate with latent salience including decision coverage. After we account for predecision salience, less divisive decisions (measured as the number of majority votes) are correlated with less coverage, while formal alterations of Supreme Court precedent or declarations of unconstitutionality both lead to increased coverage. While additional work is certainly warranted on these dynamics, the results provide important corroborative evidence suggesting the need for careful consideration in research implicating salience.
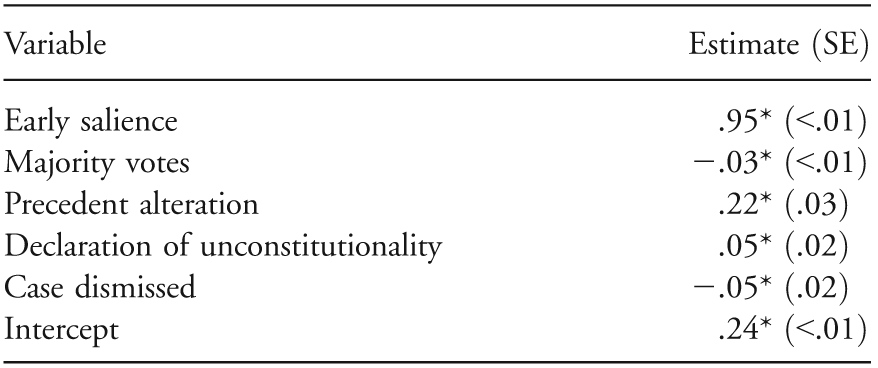
Note.— Fixed effects for issue area and term were included but are not reported above. N = 7,028.
* p < .05 (one-tailed).
Fortunately, our model is flexible and extensible to a variety of settings and allows one to use estimates that rely on any combination of coverage types, and we include each set of estimates described here in our data release. We now turn to an application of these estimates, as we replicate a pair of studies in the existing literature that have used the Epstein and Segal (2000) indicators.
IV. Applications
In this section, we compare the results of two existing studies with replications in which we have replaced the authors’ measures of salience—an approach based on postdecision media coverage and an approach based on Black, Sorenson, and Johnson’s (2013) oral argument measure—with our measure of salience. It is important to note at the outset that the subject of interest is not salience in either of these studies; instead, the widely acknowledged influence of salience across subject matters led the researchers to include measures as control variables in their analyses. These analyses, then, provide an insight into the continued differences in salience measurement strategies and the potential improvement for researchers offered by our measure of latent salience. Of course, the goal cannot simply be to replicate existing findings or match an existing measure. If one trusts the original salience measures enough to trust all findings or if the new measure matches the old, we would not need a new measure. We offer replications to show that our findings are not so dissimilar as to cause doubt while also documenting the attainable improvements for studies using what we see as an improved measure.
A. Wohlfarth and the Tenth Justice
Often regarded as the “tenth justice” of the Supreme Court, the solicitor general is a frequent—and frequently successful—repeat player before the Court. Whether owing to the quality of their legal arguments (Caldeira and Wright Reference Caldeira and Wright1988; Segal Reference Segal1988; McGuire Reference McGuire1998) or the compatibility of their ideological interests with those of the justices (Segal and Spaeth Reference Segal and Spaeth2002; Bailey et al. Reference Bailey2005), solicitor generals have historically been remarkably successful before the Court and have therefore attracted much scholarly attention. Wohlfarth (Reference Wohlfarth2009) has argued the the increasing politicization of the solicitor general’s office may decrease its influence.Footnote 12 Specifically, he argues that “the probability of the Court supporting the S.G.’s position on the merits should decrease as the office becomes more politicized” (227).
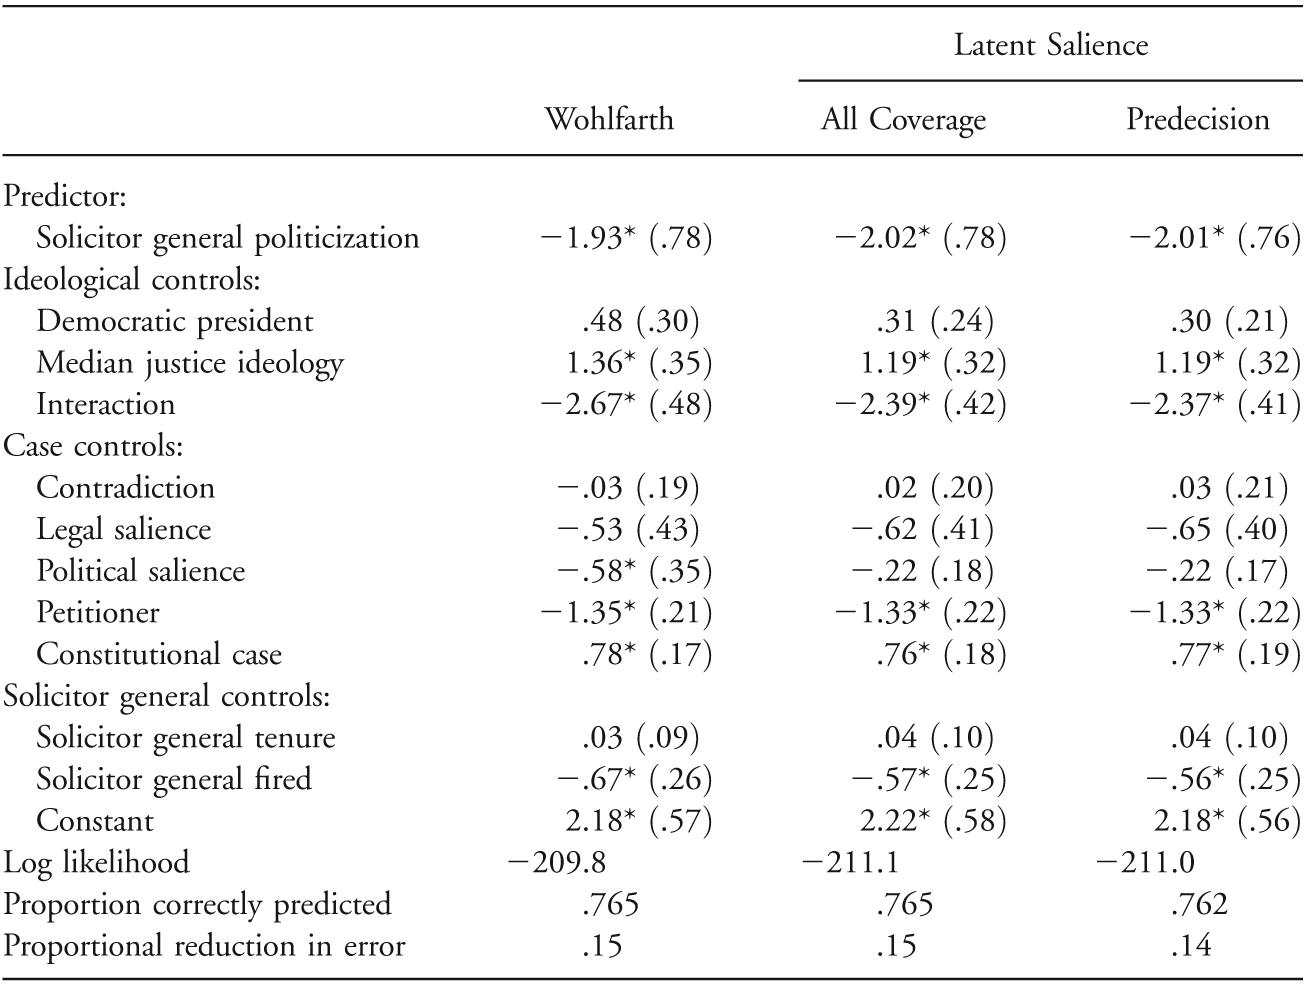
Wohlfarth shows evidence for his hypothesis by analyzing all civil rights and civil liberties cases for which the solicitor general’s office voluntarily filed an amicus curiae brief during Supreme Court terms 1961–2003. In the analyses, the dependent variable is a dichotomous indicator of whether the Court’s decision reflected the position the solicitor general advocated. Building on Maltzman et al. (Reference Maltzman, Spriggs and Wahlbeck2000), Wohlfarth (Reference Wohlfarth2009) hypothesizes that the solicitor general’s preferences will prevail less often in salient cases because of the “more distinguished preferences” of the justices in the Court’s most important cases. As a result, the analyses include variables accounting for both legal and political salience. Legal salience is a dichotomous variable, with one indicating that the Court declared a law unconstitutional or formally altered precedent. Political salience is also a dichotomous measure, with one indicating that the case appeared on either of the New York Times or Congressional Quarterly lists. For both legal and political salience, Wohlfarth hypothesizes a negative relationship with the solicitor general’s probability of success on the merits as amicus curiae.
In line with Wohlfarth’s measure, which is based on postdecision coverage, we employ our measure of latent salience estimated from all media coverage periods, including the decision. Yet, as discussed above, it is potentially problematic to utilize postdecision measures of salience when examining dynamics related to the decisional outcome. For instance, in this research application, decisions may be more likely to be identified as salient if the Court rules against the preferences of the government. We would observe a negative relationship, as Wohlfarth does, but without any causal influence from salience on the likelihood of the Court ruling against the solicitor general. Therefore, we also estimated a model using our measure of latent salience based only on predecision coverage.
The results of our comparison appear in table 3. Note that there is no significant change in the effects, or the magnitude of effects, for nonsalience variables in the estimation with our latent measure of salience. Therefore, the core substantive conclusions of the research remain the same when substituting our measures of salience into the analyses. However, while the estimated coefficients associated with our measures are negative, as in Wohlfarth’s original analysis, they are substantively smaller (even after accounting for the difference in scales) and not statistically distinguishable from zero. Our measures of latent salience offer a more fine-grained representation of the salience of the individual court cases and, in the case of the predecision measure, a measure without the problematic dynamics of posttreatment bias. In this analysis, that additional detail is enough to shift the substantive conclusion of the article on the influence of political salience on the solicitor general’s probability of success.
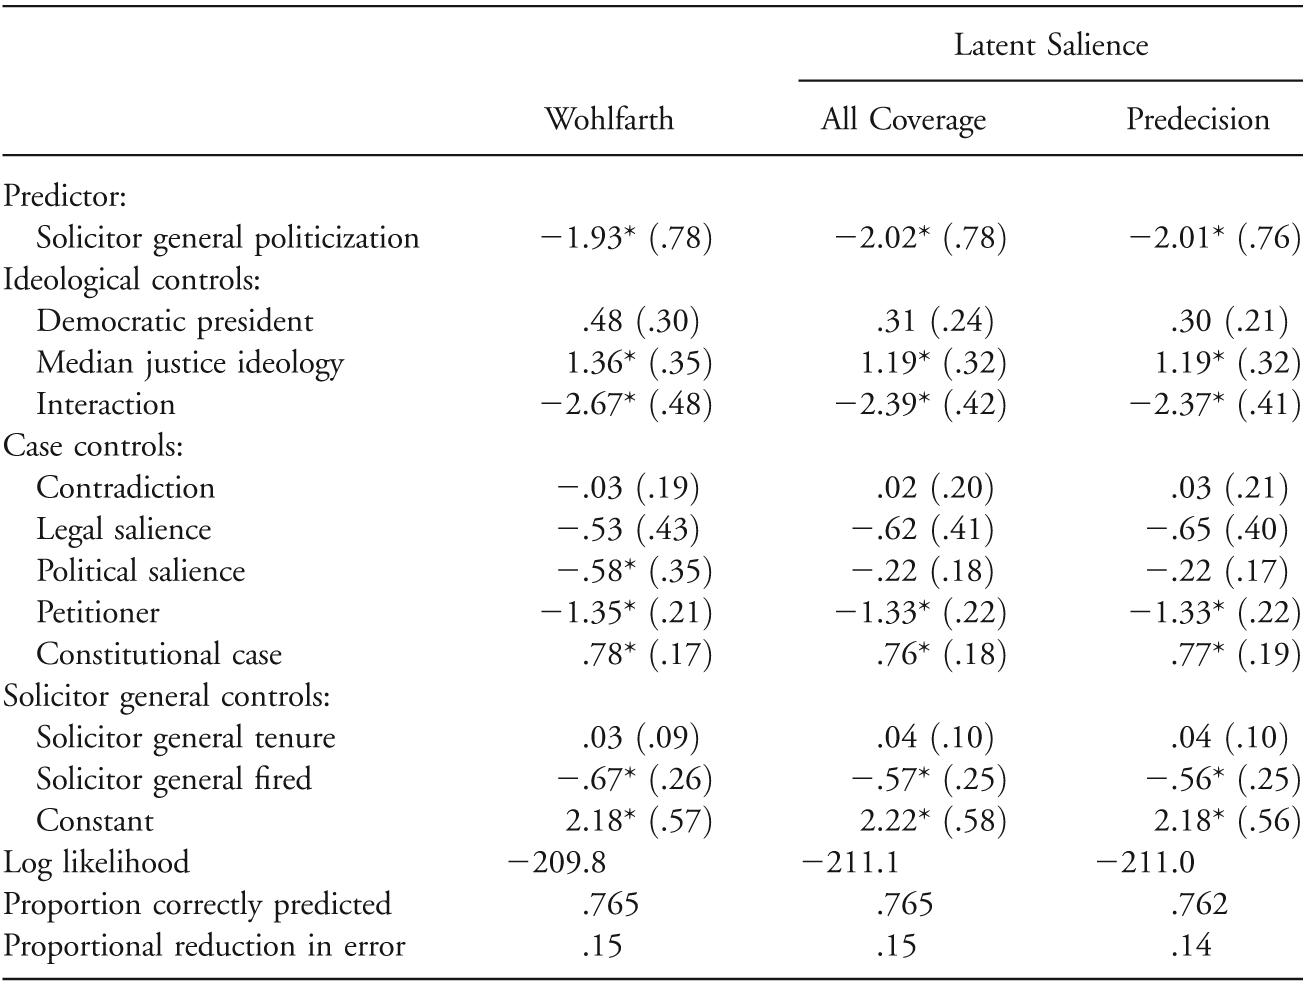
Note.—Logit estimates are reported with robust clustered standard errors in parentheses. N = 411. For each model, the dependent variable is a dichotomous variable indicating whether the solicitor general’s position prevailed in the case.
* p < .05 (one-tailed), per the original.
B. Corley, Collins, and Calvin’s Opinion Content
In addition to delineating the law, the language of judicial opinions offers important insights into the state of legal rules, hierarchical and intracourt dynamics, and a host of other concerns with implications for social scientists and legal scholars. It is therefore unsurprising that the language has increasingly been the subject of empirical research (e.g., Corley Reference Corley2008; Owens and Wedeking Reference Owens and Wedeking2011) revealing important influences both on and from the content of judicial opinions. In this vein, one particularly noteworthy recent work by Corley, Collins, and Calvin (Reference Corley and Collins2011) found evidence that the justices on the US Supreme Court incorporate significant percentages of lower federal court opinion language into their opinions as a means of crafting “more effective law and policy” (42).
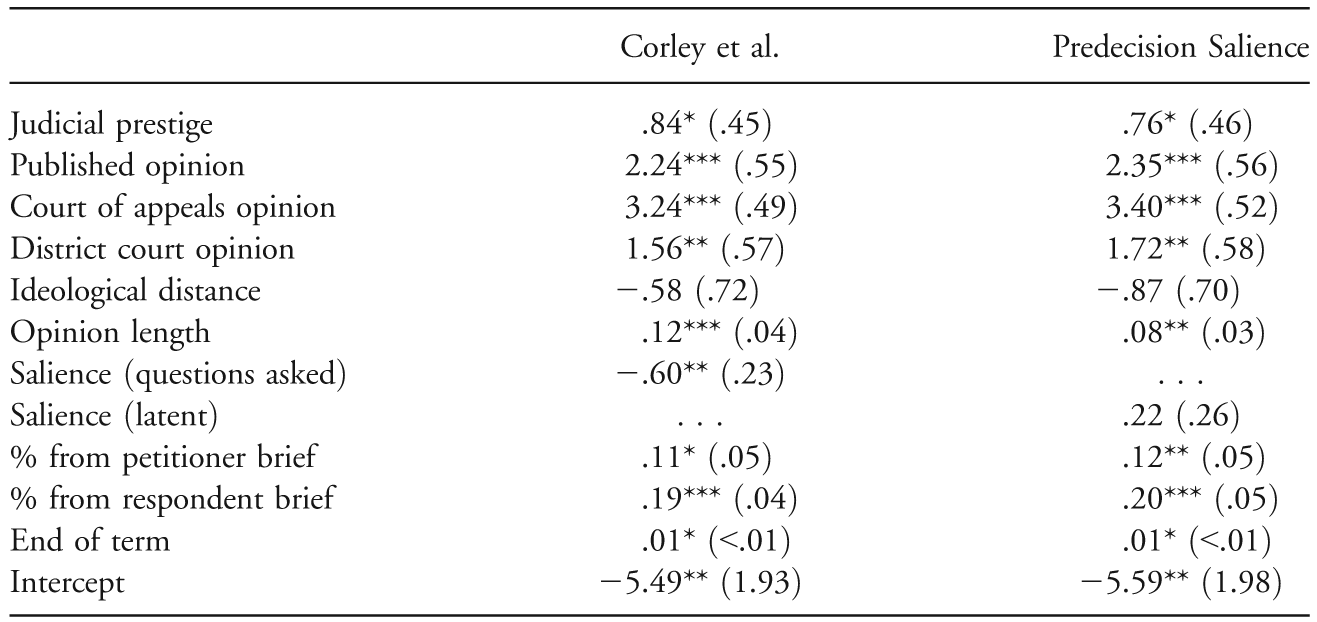
In light of the importance of salience across research questions and building on the Maltzman et al. (Reference Maltzman, Spriggs and Wahlbeck2000) suggestion that justices take additional care to craft their opinions when cases are more important, Corley et al. also hypothesize that “in salient cases, the justices might expend more time and energy shaping the content of the majority opinion than in relatively trivial disputes” (Reference Corley and Collins2011, 39). Owing to the nature of their research question, Corley et al. rightly avoid using measures of salience based on the decision of the Court, avoiding potential posttreatment biases. Rather, in order to capture the preopinion salience of the case, they follow the measurement strategy proposed by Black, Sorenson, and Johnson (Reference Black2013). More specifically, they measure salience for each case by computing term-specific z-scores of the number of questions asked during oral argument. Because we can estimate latent salience prior to the decision, this replication offers an optimal setting for directly comparing the Black, Sorenson, and Johnson approach with our predecision measure of salience.
In table 4, we present the Corley et al. results, as well as results from a reestimation of the model substituting our measure. Note first that all non-salience-related findings persist across models; while magnitudes vary slightly, the substantive results remain consistent. Importantly though, our measure suggests, contrary to Corley et al., that salience is unrelated to the extent to which opinion authors borrow language from lower-court opinions.Footnote 13 These results lend themselves to two possible interpretations. Salience may be better identified as a function of the number of questions asked rather than as a function of media coverage, or the number of questions asked may capture a variety of factors and considerations beyond salience that relate to the dependent variable, yielding a misleading result.
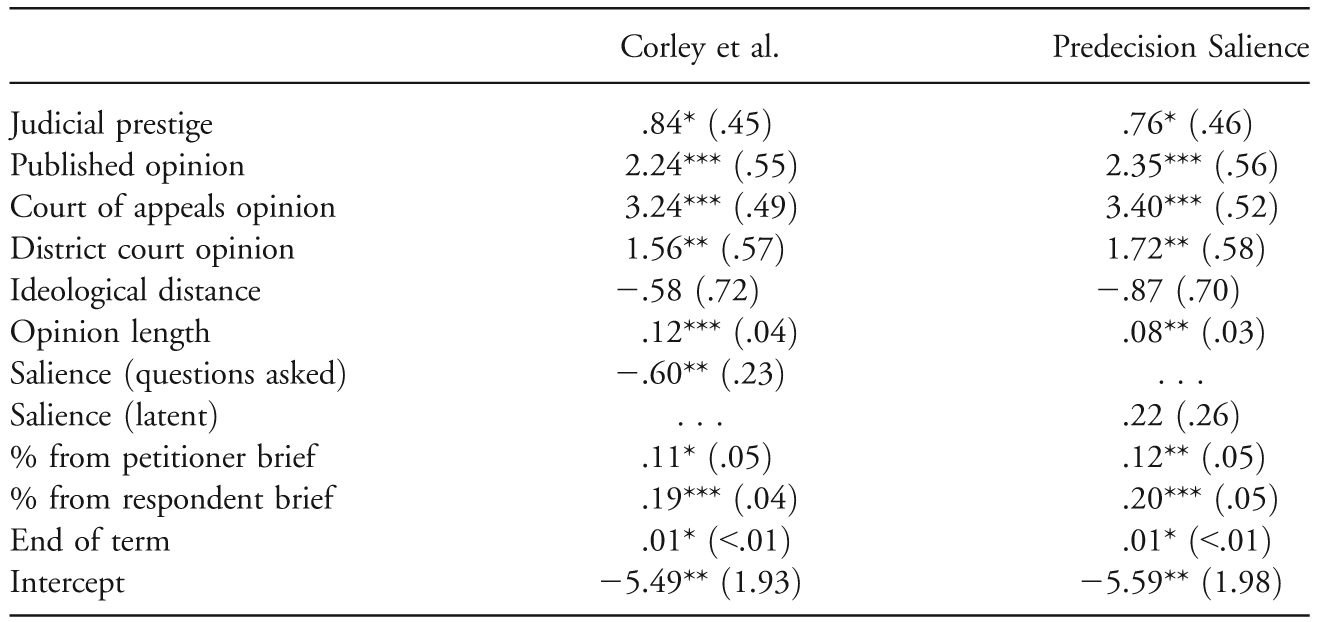
Note.—Clustered standard errors are in parentheses. N = 345. For each model, the dependent variable is the percentage of language the Supreme Court opinion borrowed from a lower-court opinion, as measured by Corley et al. (2011).
* p < .05 (one-tailed per the original).
** p < .01 (one-tailed per the original).
*** p < .001 (one-tailed per the original).
The data suggest it to be the latter. We can begin by looking at the face validity of the two measures as reflected in their rankings of salience. Both the standardized number of questions and latent salience rank McConnell v. FEC as the most salient case during the period under study. After this, though, the measures diverge significantly. Measuring salience as the standardized number of questions identifies Baldwin v. Reese—a case on what constitutes “fairly presented” Sixth Amendment counsel claims in state courts, on which the Court ultimately voted 8–1—as the second-most salient case to the justices and National Park Hospitality Association v. Department of the Interior—a case dealing with concessions contracts in the national parks that the Court decided by a vote of 7–2 in favor of the government—as the third-most salient case. By contrast, our latent salience measure using only predecision coverage identifies Rasul v. Bush—the landmark case dealing with the rights of prisoners at Guantanamo Bay, decided by a 6–3 vote—as the second-most salient case during the period and Grutter v. Bollinger—a landmark case dealing with affirmative-action admissions policies, ultimately decided by a 5–4 vote—the third-most salient.Footnote 14 While all cases before the Court are necessarily important, we do not believe it controversial to suggest that our rankings better reflect salience to the justices.
Further, as detailed above, there are theoretical reasons to suppose that the number of questions asked at oral argument, while perhaps relating to salience, more directly relates to a variety of case-specific considerations. For purposes of the Corley et al. analysis, for instance, the Supreme Court may emphasize different questions than a lower court would, or that litigants were considering, leading to the observed difference across models using the different measures. In other words, the standardized number of questions likely picks up on a number of different dynamics, including but not limited to case complexity, attorney quality, or the introduction of new issues (Black, Schutte, and Johnson 2013); these factors could in turn predict the extent to which the Court adopts language from lower-court opinions.
Across these two research applications, we find considerable improvement from our measure of salience. The flexibility of our measure allows us to estimate predecision salience, improving on other prominent media-based measures (Epstein and Segal 2000; Collins and Cooper 2011). Utilizing our new measure leads to a new conclusion on the influence of political salience on the likelihood of the Supreme Court siding with the solicitor general. We also examined a research application in which we can directly compare our measure with the primary alternative for predecision salience, Black, Sorenson, and Johnson’s (2013) measure based on questions asked at oral argument. There again we arrived at substantively different conclusions regarding the influence of salience, a difference likely attributable to flaws in their measure. In neither case were the substantive conclusions of the papers on all other variables appreciably altered, while one can now confirm their findings with confidence that the problems noted above did not taint such conclusions.
V. Conclusion
Issue salience is a topic that has captured the minds of theoretically and empirically oriented scholars of judicial politics. Its clear conceptualization and measurement, however, have proved elusive. In particular, if we are interested in knowing how the salience of a case affects predecision choices—such as opinion assignment or amicus participation—then coverage of a case’s decision alone, the current dominant method, risks posttreatment bias. Further, if we are interested in how the Court’s decision—for example, the decision to grant certiorari or the political polarity of a decision—affects the salience of an issue, then dominant measures introduce upward bias in our estimates, as we describe in table 1. Our measurement strategy offers an opportunity to retain the benefits of contemporaneous media coverage as an indicator of salience, while also avoiding some of the pitfalls and limitations embodied in the existing approach as well as alternatives.
By combining information about media coverage of Supreme Court cases from a variety of newspapers at different points in the cases’ process through the Supreme Court, from the granting of certiorari all the way through the final decision, we are able to construct a measure that is a summary of the latent propensity to be covered by the media. Moreover, we are able to make use of a richer measure of media coverage, the number of stories, rather than dichotomous indicators of coverage. The latent trait we uncover has face validity as a measure of political salience and is well correlated with other indicators. What is more, our model is easily adaptable to a variety of theoretical settings. For example, one could explicitly exclude media coverage of the final decision if one wants to investigate the determinants of media coverage. Alternatively, one could supplement our model with additional indicators, such as questioning at oral argument (Black, Sorenson, and Johnson 2013), thought to be driven by the same latent salience characteristic as is media coverage.
With these data in hand, scholars will be able to begin empirical evaluation of theoretical predictions that previously could not be studied. For example, Lax and Cameron (2007) predict, among other things, that the salience of a case before the Court will affect the choice of opinion writer: measures of salience taken after a case is decided are inappropriate for such an analysis. Similarly, scholars have argued that the salience of a case affects participation by amici curiae (e.g., Collins 2008b) and that Court decisions can affect the salience of and opinion about political issues (e.g., Hoekstra 2003). Again, measures of case salience based on ex post indicators would not be appropriate for such analyses. Finally, our measure will allow scholars to further validate the inferences drawn from previous research. We have replicated two studies, finding that the relationship between salience and the subject of interest holds in only one of the two, suggesting that the use of the existing measure may be suspect in at least some instances. We expect future research will find that the measure introduced here provides an opportunity for investigating both new and old questions.
Appendix
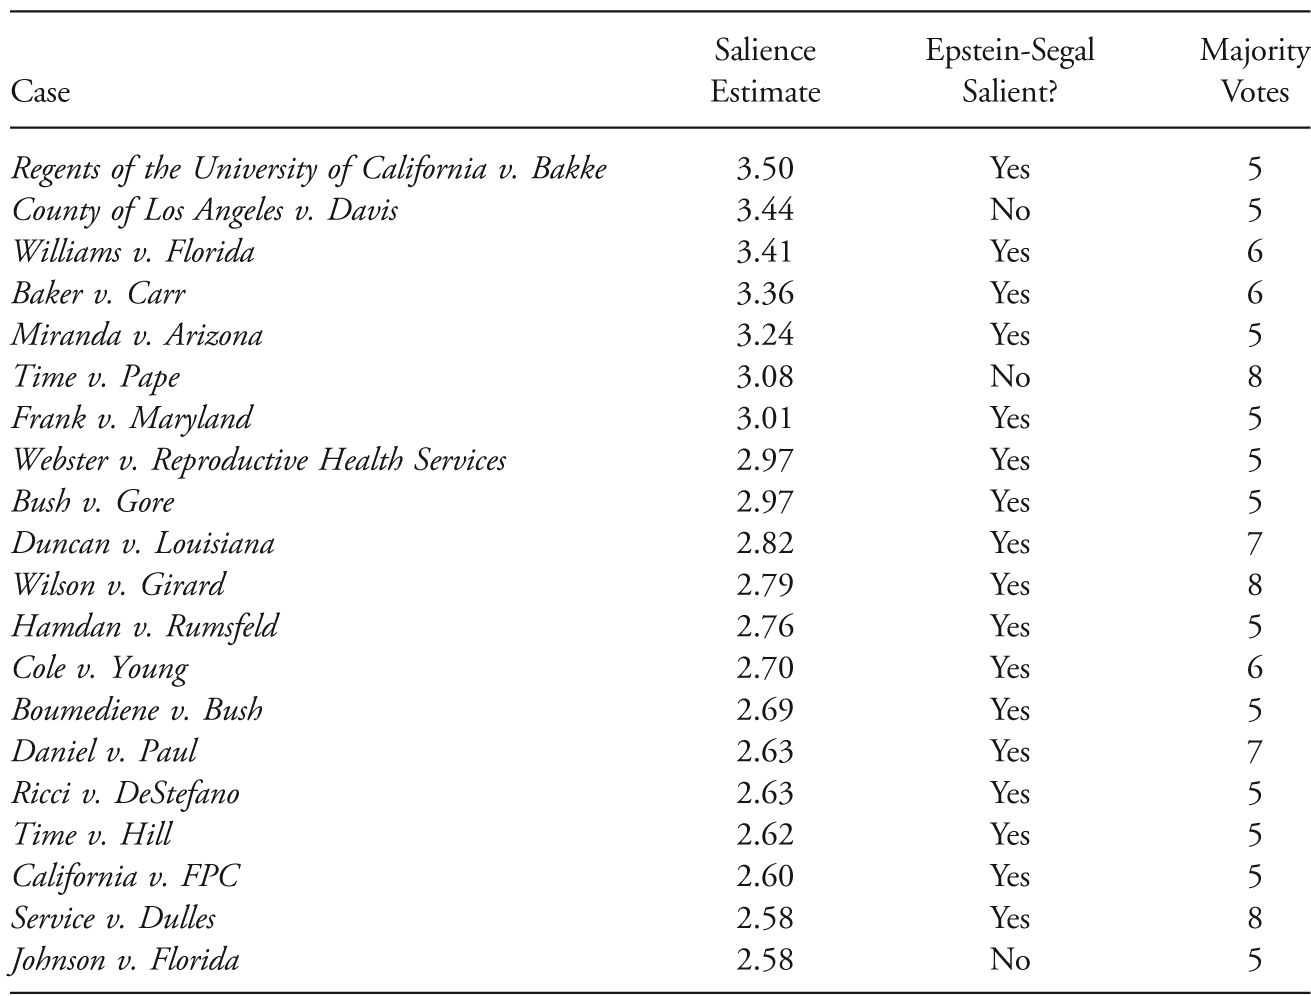
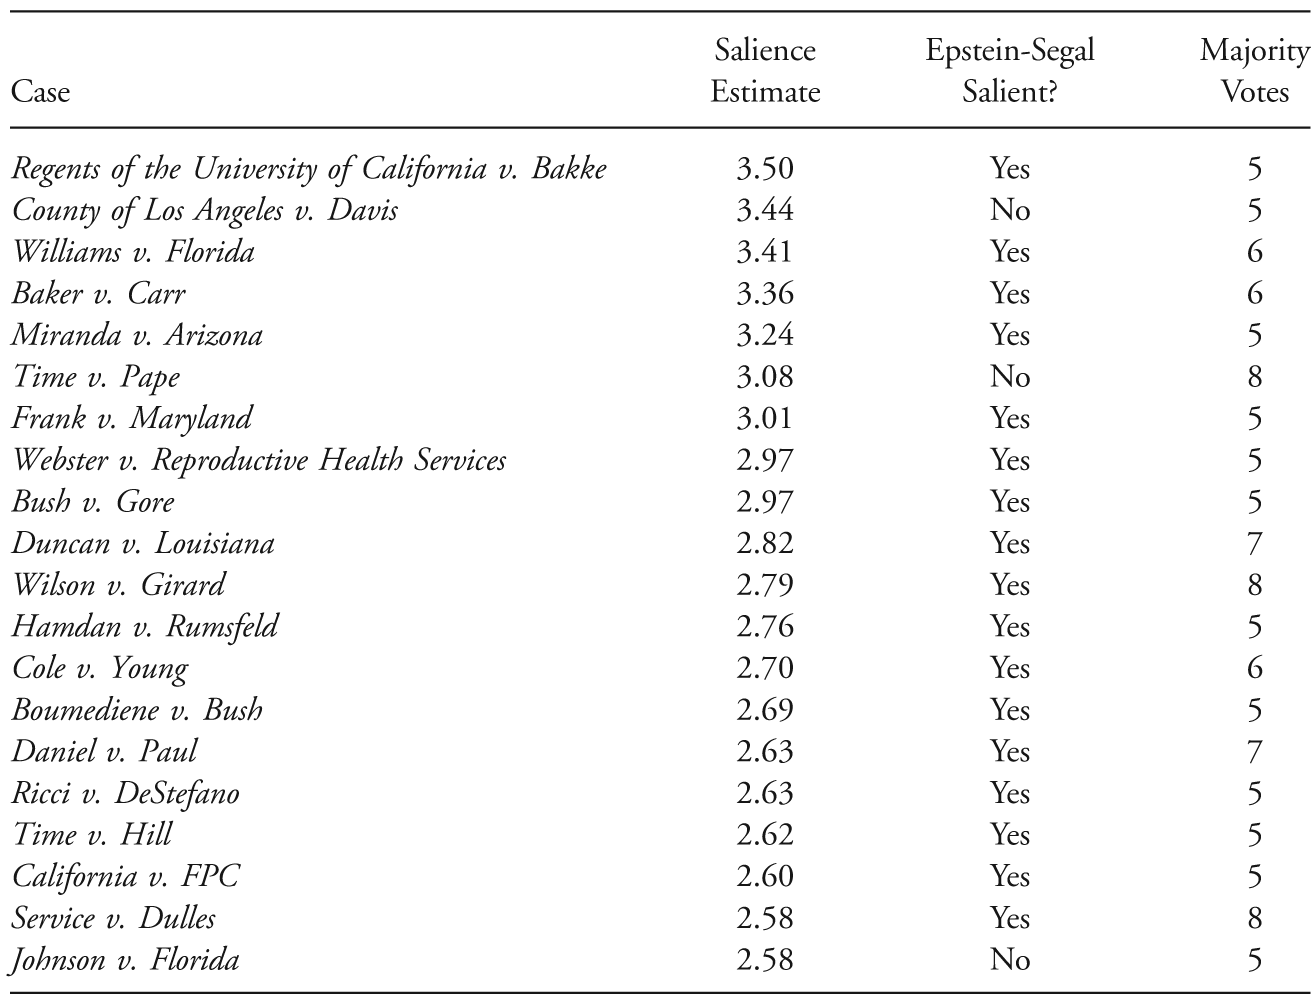
In order to provide additional corroborative evidence of the validity of our measurement approach, in table A1 we list the 20 cases with the highest latent salience estimate as derived from a latent variable model of all stages of coverage. Note first that most of the cases are generally recognized as some of the most politically salient cases to have come before the Court in the past 60 years, providing evidence of the face validity of our measurement approach. Moreover, in the majority of cases, our measure corresponds with the Epstein and Segal NYT measure, offering evidence of convergent validity (Quinn et al. 2010). Where our approach diverges from Epstein and Segal’s approach also speaks to the viability of our approach. For instance, in County of Los Angeles v. Davis, the Court divided 5–4 over the issue of racial discrimination by the Los Angeles County Fire Department. The case enjoyed extensive attention in the Los Angeles Times, coverage of a divisive case missed by focusing only on the New York Times. Similarly, Time v. Pape—a case based on libel accusations related to Time’s reporting of police brutality allegations—featured extensive decision coverage in both the Washington Post and the Los Angeles Times, but none in the New York Times. Time v. Pape and the third case in which our measure diverges, Johnson v. Florida, illustrate the importance of considering the many periods of potential coverage before the Court. In both cases, the decision was covered extensively, but predecision coverage was notably absent. Johnson v. Florida was covered in all three newspapers, but none of the papers covered predecision stages of the case. Computing latent salience across only predecision newspaper coverage leads to drastically reduced estimates of salience for both of these cases, demonstrating the utility of considering multiple time periods. In all, the results provide evidence supporting our contention that researchers should consider multiple indicators in arriving at their measure of salience.
 αsnt[c]
 βsn