1. Introduction
Territorial user rights in fisheries (TURFs) as a management tool of fishery resources are attracting increasing attention as an alternative to command-and-control and market-based tools (Christy,Reference Christy1982; Ostrom et al., Reference Ostrom, Dietz, Dolšak, Stern, Stonich and Weber2002; Wilson et al., Reference Wilson, Nielsen and Dengbol2003; Cunningham and Bostock, Reference Cunningham and Bostock2005; Townsend et al., Reference Townsend, Shotton and Uchida2008). TURFs in general are defined as community-based or individual-based rights of use (or tenure) and exclusion over the fishery resources within a specific area and for a set period of time (Christy, Reference Christy1982). In many cases, TURFs are also combined with self-governance of fisheries; local communities establish and impose a set of rules on themselves. TURFs are established to create an appropriate environment for self-governance through community ‘ownership’ of common property resources. The owners of these property rights, having an interest in the resource's current and future productivity, are inclined to manage the fishing effort so that they maximize the net benefits from the resource. Self-governance under a TURF could be advantageous over command-and-control in parts of the world where the cost of enforcement and monitoring is high, or where institutional capacity to implement a market-based tool such as an individual transferable quota system is lacking (Cancino et al., Reference Cancino, Uchida and Wilen2007).
Self-governance has been practiced in many parts of the world for centuries (Jentoft, Reference Jentoft, Wilson, Nielsen and Dengbol2003) and many such arrangements have involved TURFs of one type or another. The Japanese have a long history of self-governance of fisheries under TURFs that they call fishing rights (Uchida and Makino, Reference Uchida, Makino, Townsend, Shotton and Uchida2008) and a similar system was introduced to the Chilean loco fishery in the early 1990s (Cancino et al., Reference Cancino, Uchida and Wilen2007). The Pacific Basin is especially rich in TURF systems, also known as customary marine tenure systems, that are firmly integrated into the overall social, economic and cultural life of communities in the region (Ruddle et al., Reference Ruddle, Hviding and Johannes1992). New England lobster fishermen in the United States have been exercising similarly exclusive territorial use rights. South Korea's maul fishery, the subject of this study, also functions under a TURF system.
For self-governance of natural resources to be successful, however, merely establishing a set of rules for users of the natural resource is not sufficient. Based on the theory of clubs, a group of natural resource users must be ‘privileged’ (Buchanan, Reference Buchanan1965). That is, managing the natural resource as a group must bring a higher present value of benefits to its members than to non-members and, preferably, a value that exceeds the status quo without self-governance. This higher present value of net benefits from a given fishery, therefore, is an incentive constraint on forming and maintaining a self-governance group. Fishermen should clearly perceive that their actions have a direct and pronounced beneficial effect on the state and productivity of their portion of the resource and hence on their future profits.
Despite the importance of this incentive constraint, the current literature has not examined empirically the impact of forming a self-governance group on profitability. In the past, many case studies have examined self-governance and TURF systems in terms of their economic efficiency and equity, but few have been quantitative and used data that were collected systematically from both self-governing and non-self-governing fishermen. One exception is Gaspart and Platteau (Reference Gaspart and Platteau2007), who compared self-governing and non-self-governing fishermen's perceptions of the success of self-regulation of fishing efforts for small-scale fisheries in Senegal.Footnote 1 However, the study was limited to examining perceptions of an indirect measure of success. Our study, in contrast, focuses on a direct measure of success – profitability – for several reasons. First, anecdotal evidence from Japanese cases of fishery self-governance has indicated that increased profitability was most persuasive in convincing the most skeptical fishermen and thus contributed the most to sustaining self-governance (Uchida and Baba, Reference Uchida, Baba, Townsend, Shotton and Uchida2008). Second, profitability as the measure of success is most consistent with the theory of clubs, which is the basis of our conceptual framework. Finally, it seems most plausible to think that, in the context of commercial fisheries, maximizing profit is the most important objective for most, if not all, fishermen.
The principal contribution of this study is empirical evidence of the impact of self-governance on fishermen's profitability. To the best of our knowledge, this is the first study to quantitatively test the economic impact of a self-regulatory approach to fish resources using data that have been systematically collected at the fishery group level and that cover groups both with and without self-governance. To meet this goal, we capitalize on a unique setting in South Korea that offers an appealing institutional setting in which to study these questions. In 2001, South Korea instituted a policy to encourage voluntary self-governance groups for fishery management. By 2007, nearly 300 such groups had been formed in South Korea for inshore (maul) fishery, or TURF, fisheries. These fisheries are comprised of clams and other sedentary species in designated areas.Footnote 2 Regulated by the Ministry of Marine Affairs and Fisheries' minister's decree, licenses are assigned to fishing village societies and local fishery cooperatives comprised of fishermen who live in the designated areas (Lee et al., Reference Lee, Gates and Lee2006). These groups are richly varied in terms of targeted species and gear types and have introduced a variety of self-imposed rules. At the same time, numerous other fishermen engage in the same or similar fisheries in those regions and are not members of any self-governance group.
To understand the changes in perceptions of the economic impacts of forming these self-governance groups, we utilize a unique set of data from a survey that we designed and conducted with leaders of 157 groups, 77 of which manage fisheries as a TURF with self-governance and 80 communities (ochongye) that have TURFs and engage in the same or similar fisheries but do not have a formally established or registered self-governance group. In identifying the effect of self-governance on economic outcomes, we control for self-selection by employing a covariate matching method.
Overall, we find strong evidence that self-governance groups perceive greater benefits in terms of both revenue and cost compared to non-self-governance groups. One important caveat, however, is that the outcomes are based on an ordinal measure of changes in revenues, costs and prices instead of changes in their levels. We therefore do not measure the monetary magnitude of the effect of self-governance. Nevertheless, our systematic data collection and analysis approach gives some of the first quantitative evidence of the effects of self-governance.Footnote 3
The rest of the paper is organized as follows. Section 2 provides a conceptual framework based on the theory of clubs. Section 3 describes background and current information on the status of self-governance groups in maul fisheries in South Korea. Section 4 describes our data collection effort. Section 5 provides descriptive statistics and other survey results for the self-governance groups and individual fishermen in our sample. Section 6 examines the economic outcome of self-governance by first outlining our identification strategy and then discussing the results from the matching models. Section 7 concludes.
2. Conceptual framework: theory of clubs
Our conceptual framework is based on the theory of clubs (Buchanan, Reference Buchanan1965). Club goods are a subset of impure public goods, a type of goods that lies between private goods (with complete rivalry and costless exclusion) and pure public goods (complete non-rivalry and infeasible exclusion). A club is defined as a group of individuals deriving mutual benefits from sharing impure public goods characterized by non-excludability and some rivalry in the form of congestion. As such, a club is viewed as a private, non-governmental alternative provider of such impure public goods.
Fish resources can be categorized as impure public goods. Unlike pure public goods, fish harvests are subject to rivalry – fish that were harvested by one fisherman cannot be harvested by another. If the fish resources have open access, the resource remains non-excludable. With limited access, however, such as through licensing or establishment of TURFs, fish resources can be made excludable to varying degrees. However, even with limited access and some excludability, they can still be subject to overexploitation. For example, if the number of incumbent fishermen is too large, as is often the case, then non-excludability of the resource among license holders or TURF members creates an incentive structure that is similar to open access, i.e., a race to fish. This will lead to overexploitation of the resource, overinvestment (capital stuffing) and rent dissipation.
One way to overcome overexploitation is to convert the fish resource to a club good. If the resource is successfully converted, members of the resulting club would reap a stream of rents from the resource. Members would have exclusive rights and the size of the club and the resource would be optimal when the resource is used efficiently to sustain the rents over time. However, based on the theory of clubs, three conditions must hold in order to transform a fishery resource into a club good. First, the boundaries of the fishing ground must be defined, preferably in accordance with the ecology of the targeted fish, so that members have the exclusive right to the fish. Second, membership in the club – a fishermen's group – must be well defined and controlled. Finally, and most importantly from the perspective of this study, the group must be ‘privileged’ – it must bring a higher present value of benefits to its members than is received by non-members (i.e., status quo). The first two conditions are related to excludability, while the third is related to profitability or an incentive-compatibility constraint of forming and maintaining a club. These conditions are also interrelated. Whether a club is privileged or not depends on how well the benefits are made exclusive to its members.
The excludability condition can be achieved in several ways. One example is the license system – membership is defined by the possession of a license. Another example is the formation of a fishermen's group such as a cooperative and, in the case of the US Northeast's groundfish fishery, establishment of sectors. In both cases, monitoring for violators and enforcement are essential, and the cost of that enforcement relates to the issue of affordability. Theory suggests that exclusion methods need to be affordable for a club to function.
More challenging to meet is the privileged condition. In the context of fisheries, the theory of clubs defines several ways in which clubs can bring higher profits to their members after controlling for other factors that affect profit, such as targeted species and gear type used. Importantly, many activities that could increase revenues and/or reduce costs often require some critical mass to be effective or have a public-good nature so that no individual alone would voluntarily pursue them. Reducing the harvest as a way of rebuilding the fish stocks is certainly one such activity. It is effective only if done by most, if not all, harvesters, and no single fisherman will do it solo voluntarily. Other activities that could yield positive results but that require cooperation among members to be effective are:
• Direct marketing and sales. Direct sales by the group would eliminate middlemen, thereby allowing fishermen to increase their profit margins. A steady and sufficient supply of various fish is essential for this tactic to be successful so it requires small-scale fishermen to coordinate as a group to do this efficiently.
• Quality control. As another means of marketing and sales, quality control requires a high level of cooperation among group members since just a handful of incidents of mixing low-quality product into high-quality product can destroy the fishers' reputations. Quality control can technically be done individually, but the prospect of measurable success is slim without a sufficient and consistent supply of high-quality products.
• Fishing ground maintenance. A well-kept fishing ground can enhance revenue if it leads to improved stock levels. Alternatively, it could lead to cost reductions by decreasing incidents of gear damage from debris underwater. However, maintenance is more likely to be successful if the effort is coordinated as a group and thereby avoids free-riding.
• Monitoring illegal fishing. By reducing incidents of poaching and other illegal fishing activities, a group can enhance its catch and thus its revenue. Monitoring will be much more effective if done as a group, especially if covering a wide area.
• Information sharing. If information about the location of good fishing spots is shared among group members, this will contribute to reduced costs (e.g., search costs). Group members can also share market information, such as inventory levels of processors and buyers and scheduled arrivals of large tourist groups to the region. Members can use such information to decide when the best time to land the fish would be.
It needs to be emphasized that greater economic returns are necessary for incentive-compatibility, not excludability of fish. Although the targeted species of the maul fisheries are predominantly sedentary ones such as shellfish, non-members residing in the same region could free-ride on members' efforts to increase the stock, thereby jeopardizing the self-governance scheme. However, it is not the fish per se that need to be exclusive; rather, it is the benefit – specifically, economic returns – from the fishery. This explains why many self-management groups engage in marketing activities such as quality control and developing a private brand (Uchida and Baba, Reference Uchida, Baba, Townsend, Shotton and Uchida2008; Uchida and Watanobe, Reference Uchida, Watanobe, Townsend, Shotton and Uchida2008; Uchida et al., Reference Uchida, Uchida, Lee, Kim and Ryu2010). Moreover, excludability does not need to be spillover-proof. As long as group members receive a greater net benefit than they did prior to forming the group and greater than current non-members, it is incentive-compatible for members to maintain the group. Studies have shown that benefits from rationalized fishery management systems often come from output markets and are generated quickly, as opposed to often-cited cost reductions through capital adjustments that take a longer time to realize (Homans and Wilen, Reference Homans and Wilen2005). This relatively quick return and the privileged condition of the theory imply that collective activities aiming to enhance fishery revenues are an important component in sustaining self-governance groups, which are essential to achieving mid- to long-term objectives such as recovered fish stocks and capital adjustments.
This manuscript seeks to understand whether self-governance groups in maul fisheries that exist today have achieved the privileged condition, i.e., higher profitability compared to non-self-governance groups. If they have achieved the condition, then they have a chance of sustaining their self-governance regimes (i.e., clubs).
3. Self-governance of inshore TURFs in South Korea
We examine the outcomes of self-governance groups in the context of South Korea's maul fishery that operates under the TURF system. South Korea provides a unique opportunity to study the impact of the formation of self-governance groups on economic outcomes. As elsewhere, despite the government's efforts to manage fisheries primarily through licensing and permit systems, South Korea has still suffered from the problems of ‘race to fish’ and stock depletion (Cheong, Reference Cheong2004). The profitability of its fisheries has declined due to the vicious cycle of over-competition, stock depletion and capital stuffing (Lee et al., Reference Lee, Gates and Lee2006). Despite costly monitoring and enforcement efforts, illegal fishing has persisted and aggravated stock depletions. Fishing grounds have also suffered from conflicts among fishermen, who have tended to rely on government subsidies and other favorable policies. Rising international competition from cheaper imported seafood has led to lower output prices. All of these conditions created a growing need for an alternative approach to the traditional command-and-control regulations.
In 2001 the Ministry of Maritime Affairs and Fisheries initiated a policy to encourage South Korean fishermen to form voluntary self-governance groups and manage fisheries through self-regulated regimes (jayul gwanry fishery). Under the new policy, fishermen could voluntarily form self-governance committees, propose a set of self-regulations to the government and, if the regulations were approved, implement the rules. In response, the government gives greater responsibility and authority to the groups to manage fishing grounds, stocks and harvests. In the case of maul fisheries, excludability of the fish resource (i.e., limited access) is provided to members of groups primarily through TURFs (Uchida et al., Reference Uchida, Uchida, Ryu, Kim and Lee2008). In addition to administrative and technical support to implement the self-governance plans, the government provides financial rewards to self-governance groups that have a good performance record to induce more fishermen to form-4pt groups. In 2007 the government provided ₩ 11.8 billion to 90 communities (20 per cent of the total number of self-governance groups).
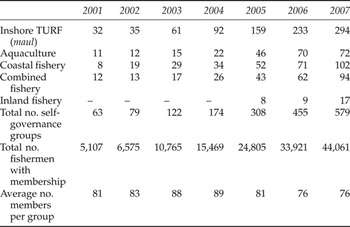
As a result of these efforts, the number of self-governance groups and their members grew rapidly (table 1). There were 63 groups in 2001. By 2007, the number had grown to 579 groups made up of more than 44,000 fishermen. Of the 579 groups, more than 50 per cent were engaged in maul fisheries. This high proportion is not surprising given that TURFs have emerged most commonly around the world for sedentary marine resources in inshore areas where TURF boundaries are relatively easy to define. Maul fisheries are followed by coastal fisheries (18 per cent), combined fisheries (maul and coastal fisheries) (16 per cent) and aquaculture (12 per cent). The number of participating fishermen has steadily increased from 5,407 in 2001 to 10,765 in 2003 and 44,061 in 2007. Currently, the average number of member fishermen in each community is 70–80. The government aims to establish 1,000 self-governance groups by 2011.
Growth in self-governance groups in South Korea, 2001–2007

Notes: The numbers are cumulative.
Source: Ministry of Maritime Affairs and Fisheries, 2008.
Despite expansion in the number of self-governance groups, there is little evidence of the economic performance of this new approach to fishery management. Lee, Gates and Lee (Reference Lee, Gates and Lee2006) provided examples of several successful case studies and a website on self-regulated fisheries by the Korean Ministry of Food, Agriculture, Forestry and Fisheries also had a list of case studies.Footnote 4 To date, however, there has not been a systematic and quantitative study measuring the effect of self-governance on economic outcomes. The present study attempts to fill this gap.
4. Data
We use a data set from surveys that we designed and implemented in 2008. The surveys were conducted via telephone with leaders of communities engaged in inshore TURFs. In total, we interviewed leaders of 157 groups, 77 of which manage a fishery as a TURF with self-governance (hereafter called self-governance groups) and 80 that have TURFs and engage in the same or similar fisheries but do not have self-governance rules as a group (hereafter called non-self-governance groups). The self-governance group sample of 77 comes from a total of 294 groups that existed at the end of 2007.
In conducting the sampling, we first eliminated self-governance groups that were established in 2006 or later because it would be too soon to evaluate their effect. The groups were sampled in proportion to the number of self-governance groups in the 13 metropolitan cities and provinces in South Korea. Non-self-governance groups were sampled from a list of all communities with inshore TURFs that was provided by the Ministry of Marine Affairs and Fisheries. To sample the non-self-governance group, for each of the 77 self-governance groups we selected a non-self-governance group in the same area that primarily targeted the same or similar species so that the two groups were most comparable to each other.Footnote 5 This data set is believed to be the only one in existence that includes self-governing and non-self-governing communities engaging in inshore TURFs in South Korea.
The survey included data on fishery activities, socioeconomic characteristics of the fishermen, perceptions of the status of their fisheries and changes in those perceptions over time, and economic and production trends. The survey instruments were pretested and revised prior to full implementation. The surveys were conducted by telephone by experienced and trained enumerators.
5. Survey results
5.1. Self-imposed rules
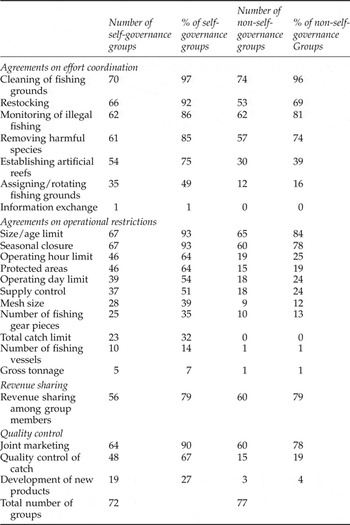
Our survey revealed a stark contrast between self-governance and non-self-governance groups in how their maul fisheries are managed (table 2). We asked the group leaders whether or not they have adopted any of 22 types of rules, which can be grouped into four categories: effort coordination, operational restrictions, revenue sharing and quality control measures.
Number and proportion of groups adopting specific rules: self-governance groups vs. non-self-governance groups, 2007

Notes: 72 of the 77 self-governance groups and 77 of the 80 non-self-governance groups gave a valid response to this question.
Source: Authors' survey.
By comparing adoption rates for the two groups, several features stand out. First, a larger proportion of self-governance groups adopt all 22 types of rules. The biggest differences in adoption rates appear in agreements on operational restrictions, especially limits on operation hours (64 vs. 25 per cent) and days (54 vs. 24 per cent), total catch limits (32 per cent vs. none) and protected areas (64 vs. 19 per cent). All of these differences exceed 30 per cent. Moreover, differences arise in the adoption of quality control of catch (67 vs. 19 per cent). Rules that have a 20–29 per cent percentage point difference include restocking, establishing artificial reefs, assigning/rotating fishing grounds, seasonal closures, supply controls, mesh size restrictions, limits on the number of pieces of fishing gear and development of new products.
Interestingly, several rules are adopted equally by both groups. For example, more than 95 per cent of both groups coordinate efforts in cleaning the fishing ground. More than 80 per cent of both groups also monitor illegal fishing and nearly 80 per cent do some sort of revenue-sharing among group members.Footnote 6
5.2. Characteristics of the groups
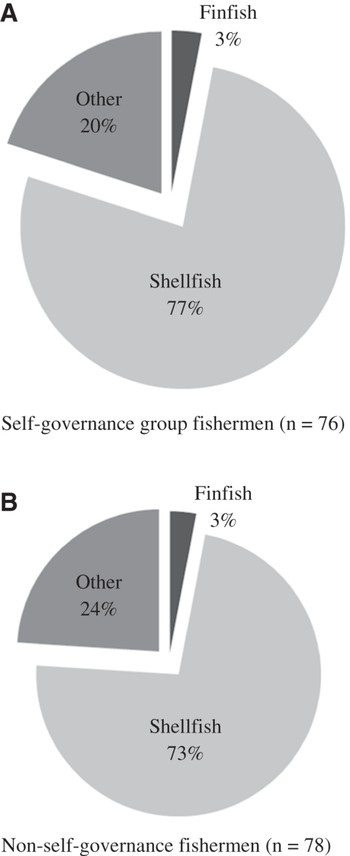
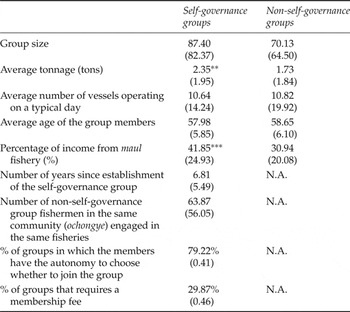
The group leader survey revealed that the two groups share some common characteristics in terms of group structure and fishing characteristics (table 3). The average group size is around 87 fishermen for self-governance groups and 70 for non-self-governance groups, which is similar to the national average. Eleven vessels go out on an average fishing day. This number is substantially lower than the group size because much of the maul fisheries in the TURF are done by hand collection or diving. The vessel size is relatively small for both groups with an average of two tons. The type of targeted species also is similar. Among the co-management and non-co-management groups, the proportion of surveyed groups targeting shellfish is 77 and 73 per cent, respectively, and the proportion targeting finfish is 3 per cent for both (figures 1A and B).
Proportion of the primary target species type; self-governance groups vs. non-self-governance groups, 2007.

Descriptive statistics of fishermen's performance, fishing activities and socioeconomic characteristics: self-governance vs. non-self-governance fishermen, 2007

Notes: *** The difference in means is significant at the 1% level; ** the difference in means is significant at the 5% level. All other mean comparisons are statistically insignificant. The sample size is 77 for the self-governance groups and 80 for the non-self-governance groups. The number of valid responses differs depending on the variable.
Source: Authors' survey.
As to characteristics pertaining only to self-governance groups, the average number of years since establishment of the group is seven, suggesting that many of these groups were established shortly after the government enacted its policies in 2001 which introduced monetary incentives for fishermen to form self-governance groups. Interestingly, on average, there are more than 60 fishermen in any given community (ochongye) engaged in the same fisheries. For most self-governance groups, membership is not mandatory (79 per cent) and only 30 per cent of the groups require some sort of a membership fee.
5.3. Reasons why the self-governance group was established
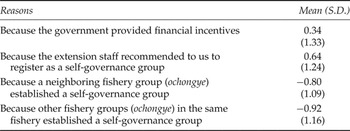
The self-governance groups' leaders revealed several reasons why the fishermen established self-governance groups (table 4). Most influential was that extension staff recommended groups to fishermen (row 2). The second most important reason was the government's financial incentive (row 1). Not as many groups adopted self-governance because other communities had established groups earlier; we therefore do not detect any peer effects from our sample.
Summary statistics for why the self-governance groups were established

Note: These questions were asked only of leaders of the self-governance groups. The sample size of the self-governance groups is 77. The leader was asked to answer using a five-step Likert scale that was then converted to values between –2 and 2 where –2 is ‘strongly disagree’ and 2 is ‘strongly agree’. Standard deviation is shown in parentheses.
Source: Authors' survey.
5.4. Perceptions of fishery management
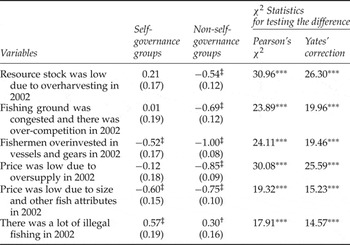
Through our survey, we find that the leaders of self-governance groups view the status of the fishery as bleaker than non-self-governance group leaders. However, the situation is improving more for self-governance groups (tables 5 and 6). In the survey, we asked group leaders to describe the status of their fisheries in 2002 and how the conditions had changed since 2002, one year prior to implementation of self-governance groups. We asked them to evaluate statements regarding their fisheries on a five-point scale where –2 indicates strong disagreement and 2 indicates strong agreement.
Perceptions of group leaders about the status of their fisheries in 2002

Notes: Standard error in parentheses.
All perception questions were asked in five categories and coded as follows: −2 = strongly disagree to 2 = strongly agree. †, ‡ in columns 1 and 2 indicate that the mean is statistically different from 0 (neutral) at the 5% and 1% significance levels, respectively.
Because the survey responses are based on the Likert scale, the differences between the responses from self-governance and non-self-governance groups were tested using the Pearson's χ 2 statistics with degrees of freedom = 4 (Plackett, Reference Plackett1983, columns 3 and 4). Yates' correction for continuity was also performed since several cells contained less than five counts (Yates, Reference Yates1934).
Significance levels are indicated as ***, 1% and **, 5%. The sample size of the self-governance group is 77 and of the non-self-governance group is 80. The number of valid responses differs depending on the variable.
Source: Authors' survey.
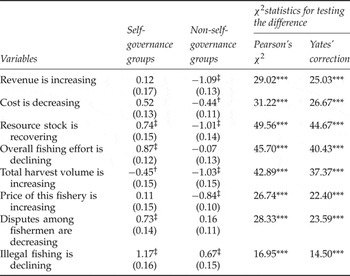
Perceptions of group leaders about changes to their fisheries since establishment of the self-governance group or during the past five years for the non-self-governance group

Notes: Standard error in parentheses. All perception questions were asked in five categories and coded as follows: −2 = m strongly disagree to 2 = strongly agree. †, ‡ in columns 1 and 2 indicate that the mean is statistically different from 0 (neutral) at the 5% and 1% significance levels, respectively.
Because the survey responses are based on the Likert scale, the differences between the responses from self-governance and non-self-governance groups were tested using the Pearson's χ 2 statistics with degrees of freedom = 4 (Plackett, Reference Plackett1983, columns 3 and 4). Yates' correction for continuity was also performed since several cells contained less than 5 counts (Yates, Reference Yates1934).
Significance levels are indicated as ***, 1% and **, 5%. The sample size of the self-governance group is 77 and of the non-self-governance group is 80. The number of valid responses differs depending on the variable.
Source: Authors' survey.
We find that more leaders in self-governance groups perceived that the status of their fisheries was bleaker in 2002 (i.e., prior to the establishment of self-governance groups, table 5). For example, more leaders of the self-governance groups thought that illegal fishing was prevalent (row 6). They also thought that resource stock before the group establishment was low due to overharvesting, and that fishing grounds were congested and there was over-competition. Interestingly, leaders of non-self-governance groups, on average, perceived that none of these issues were a serious problem in 2002. Importantly, the differences in the means between the non-self-governance groups are significant. A Pearson's χ 2 test, both with and without Yates' correction for continuity, was performed to test whether the responses from the two groups differed significantly.Footnote 7 The results show the means for all six statements; the two groups' responses were different at the 1 per cent significance level.
We also asked group leaders about what changes they perceived in the fisheries' conditions since establishment of self-governance groups or, in the case of non-self-governance groups, over the five years (2002–2007). We chose this time period to be comparable with the self-governance groups since the majority of them were established around 2002. The results show that leaders of self-governance groups, on average, believe that the fisheries are improving for five of the eight aspects we inquired about in the survey (table 6).Footnote 8 For example, more self-governance group leaders indicated that the resource stock is recovering and the overall fishing effort is declining, both of which could decrease their costs. Disputes among fishermen and illegal fishing are also declining more in the view of self-governance groups. Of the 73 self-governance groups in our sample, 11 agreed or strongly agreed (i.e., answered ‘1’ or ‘2’ in Likert scale) with improvements in all eight aspects; only 3 group leaders answered the scale ‘2’ in all aspects. The vast majority of our sample indicated that some measures have improved while the other did not. These findings are consistent with the case studies showcased by the Korean government on self-governance, many of which indicated that the profit has increased, stocks have increased and price has increased (MOMAF, 2008). However, the differences in responses between the two groups are statistically significant for all eight statements at a 1 per cent level based on the Pearson's χ 2 test with and without Yates' correction for continuity. In the subsequent analysis, we will attempt to identify the effect of self-governance on these eight factors as the outcomes of interest.
5.5. Logit model
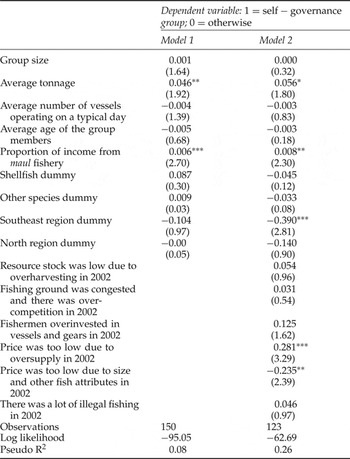
To further understand the factors associated with the decision to establish a self-governance group, we estimate and compare results from two logit models. The dependent variable is a binary indicator of whether the respondent is in a self-governance group or not.Footnote 9 The specification of the model is derived from the literature, which discusses several key determinants of group formation for self-governance of natural resources (c.f., Agrawal, Reference Agrawal2001; Ostrom et al., Reference Ostrom, Dietz, Dolšak, Stern, Stonich and Weber2002; Wilson et al., Reference Wilson, Nielsen and Dengbol2003; Townsend et al., Reference Townsend, Shotton and Uchida2008). These include group size (the smaller the group size, the more likely), production capacity (the smaller the scale, the more likely), fish type (the more sedentary the target species, the more likely) and dependency on the revenue source (the higher the income share, the more likely). We include these factors plus demographic characteristics (average age of the group members) in the model. There are, of course, unobservable factors that also affect the decision to form a group, including some that we control for in our model. For example, there could be regional differences in implementation of the national policy to promote self-regulation of fisheries in Korea or differences in overall stocks. We have included regional dummy variables as a covariate to absorb these factors. However, there are other unobservable factors at the sub-regional level that may play an important role in fishermen's decisions, such as the degree of trust among community members. We acknowledge this limitation. In our specification, we include variables related to socioeconomic characteristics of the fishermen, fishery characteristics and regional fixed effects.
Overall, there are two key findings (table 7). On one hand, many of the coefficients are insignificant, suggesting that the two groups are somewhat similar, which supports comparability of these groups. On the other hand, there are several significant variables associated with establishment of self-governance groups, which suggests that the two groups differ in some aspects. Those differences must be controlled for when examining the effects of self-governance on outcomes. In our subsequent analyses to identify the effect of self-governance groups on outcomes, we control for all of these variables.
Factors associated with establishing a self-governance group based on the logit model

Notes: Reported coefficients are marginal effects. The absolute value of z-statistics is shown in parentheses. *significant at 10%; **significant at 5%; ***significant at 1%.
In the perception questions added in Model 2, the leaders of comanagement groups were asked about the period before establishing the group and the leaders of non-comanagement groups were asked about 2002.
The omitted category for target species is finfish. The omitted category for region is South/Central region. The sample size of the self-governance group is 77 and of the non-self-governance group is 80. However, a non-response to one or more of the variables in the regression model resulted in 150 observations in Model 1.
6. Economic outcomes of self-governance
6.1. Empirical strategy
In an ideal world, we could identify the impact of self-governance groups on economic outcomes using the following model:

where y i is an outcome for group i; SG i is a dummy variable with a value of 1 if the group is self-governing and 0 otherwise; and the coefficient of our interest is β1. We investigate eight indicators of outcomes as reported in table 6.
Ideally, we would want to identify the effect of each rule or combination of rules discussed in the previous section. However, all of the groups except one non-self-governance group have adopted one or more rules. Moreover, the 147 groups with valid data adopted 136 unique combinations of rules. Consequently, in this study we could not identify the impact of a specific rule or a combination of rules on economic outcomes.
Given this limitation, we examine the effect of self-governance groups as a whole on economic outcomes. However, what we attempt to identify is more subtle than the effect of self-governance per se. By estimating the coefficient β1, we capture two effects. The first is the effect of stronger effort coordination, fishing restrictions and quality controls exemplified by the higher rate of adoption of many of the rules by self-governance groups. The second is the effect of formally registering as a self-governance group through the Ministry of Marine Affairs and Fisheries. This process involves considerably more than paperwork. As described in Lee et al. (Reference Lee, Gates and Lee2006) and in Uchida et al. (Reference Uchida, Uchida, Ryu, Kim and Lee2008), fishermen and the central government share the authority and responsibility in planning, implementing and enforcing the fisheries. Cooperatives, fishery associations and other fishery groups develop their own regulations. The fishery committees formed by these groups plan and implement the management scheme. In turn, the Ministry of Marine Affairs and Fisheries (MOMAF) provides administrative, legal and technical support. Local governments, the regional MOMAF office and the National Fisheries Research and Development Institute supervise implementation of the project. We speculate that this formal process leads to better enforcement and monitoring of the self-imposed rules relative to unregistered groups.
The key problem in identifying β1 is self-selection bias. Since TURFs were not randomized into a self-governance group, there could be systematic differences between TURFs that established self-governance and those that did not, and those differences may be correlated with the outcomes. Although the descriptive statistics shown in the previous section indicate that the two groups are similar in many respects, the results from the logit models show that a socioeconomic characteristic (proportion of income from a maul fishery) and a fishery characteristic (average tonnage) are positively associated with the establishment of self-governance groups. These factors also could affect the outcomes of interest to this study. For example, groups with larger vessels may have greater revenue, which could lead to a positive selection bias. Although the combined selection bias effect of these variables is an empirical question, it is unlikely to be zero. Hence, applying ordinary least squares to equation (1) is unlikely to give an unbiased treatment effect.
To deal with self-selection bias, we utilize a covariate matching method.Footnote 10 This method is used to examine the impact of a treatment (in our context, whether a self-governance group is formed or not) on an outcome (e.g., trends in revenues and costs since 2002) when selection takes place on observable characteristics (Rosenbaum and Rubin, Reference Rosenbaum and Rubin1984). Measuring the effect of group membership on economic outcomes without bias by using the matching method requires the so-called Conditional Independence Assumption: that the outcome in the base state (outcome if the group had not established a self-governance group) is independent of the treatment (being a self-governance group), conditional on observed covariates. If this assumption holds, we can say that, given the observable covariates, the outcome of the non-self-governance groups is what the outcome of the self-governance groups would have been if the group had not been established as a self-governance group.
Matching works by finding a non-self-governance group that is very similar to the self-governance one by conditioning on covariate variables non-parametrically (Black and Smith, Reference Black and Smith2004). Moreover, with matching methods, we can impose ‘common support,’ which excludes self-governance groups for which we cannot find a reliably similar non-self-governance group.
We follow the recent literature and use covariate matching and its variants. Covariate matching matches directly on covariates. In our analysis, we choose to match the two nearest neighbors with the same (similar) covariates (Z i). Self-governance and non-self-governance groups are matched on group size, average vessel tonnage, average number of vessels operating on a typical day, average age of the group members, proportion of income from the TURF fishery, the region in which the group is located and the target species. In particular, we do exact matching on region, gear type and target species since we believe that groups' performances could be quite different if these characteristics are not exactly the same. Within these matched groups, we can then directly estimate E(y 1i|SG i = 1, Zi) and E(y 0i| sG i = 1,Z i). Once we have a matched sample, we compare the economic outcome of the self-governance group with that of the non-self-governance group.
We report the estimated coefficients that use the post-matching bias correction factor developed by Abadie and Imbens (Reference Abadie and Imbens2006). This factor is needed to correct for conditional bias in finite samples when there are three or more continuous variables. Based on recent work that demonstrates that bootstrapping standard errors are invalid with non-smooth nearest-neighbor estimators, we use Abadie and Imbens's variance formula for nearest-neighbor estimators as it is heteroskedasticity-consistent. With covariate matching, we report the results using two weighting matrices. One approach uses the inverse variance weighting scheme; the other uses the Mahalanobis metric weighting scheme.
6.2. Estimation results
There are two key questions of interest. First, are the self-governance groups better off than they would have been if they had not started self-governance? In other words, given that a group, i, is a self-governance group, is the group better off? This estimate can be expressed as E[y 1i − y 0i|SG i = 1] and is the average treatment effect of the treated (ATT). Second, we are interested in whether the formation of a self-governance group will yield a greater benefit on average. That is, if current non-self-governance groups were to start self-governance, how much of an impact would be expected on average? This estimate is called the average treatment effect (ATE) and is expressed as E[y 1i − y 0i].
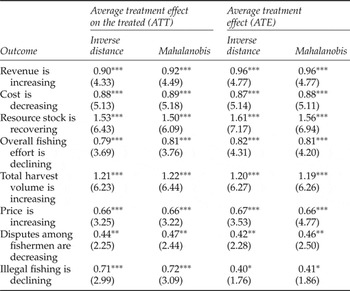
In summary, the eight outcomes of interest as described in table 8 are based on questions about trends in revenues and costs, perceptions of resource stocks, overall fishing efforts, total harvests, prices, disputes among fishermen and illegal fishing and they compare the period prior to establishment of self-governance groups (or the year 2002 for non-self-governance groups) to conditions in 2007. Responses to questions were in the form of a five-level Likert scale (2 = strongly agree, −2 = strongly disagree,0 = neutral). For each of the outcomes, we show the estimates that use inverse distance and Mahalanobis metrics for matching. In addition, we show both ATT and ATE for all outcomes with estimates from 32 matching models.
Estimated effect of self-governance on performance of the groups from covariate matching models

Notes: N=133. The absolute value of z-statistics is shown in parentheses. ***significant at 1% level; **significant at 5% level; *significant at 10% level. All estimates use bias-corrected matching estimator. Standard errors are heteroskedasticity-consistent.
Each treated sample is matched against four control samples using nearest-neighbor matching based on the following covariates: group size, average tonnage, average number of vessels operating on a typical day, average age of the group members and proportion of income from a maul fishery. The treated and control samples are exactly matched based on primary target species and region. Twenty-four observations were dropped due to non-response to either the dependent variable and/or one of the covariates.
The covariate matching estimates for the effect of self-governance on economic outcomes suggest that being part of a self-governance group improves both revenue and costs (table 8). All of the ATT estimates are positive and statistically significant. Take, for example, the estimate for the statement regarding changes in revenue. When we compare self-governance and non-self-governance groups that are similar or exactly the same in the covariates, the self-governance group is more likely to have experienced an increase in revenue (row 1, columns 1 and 2). Moreover, the ATT estimates for the statement about costs is also positive and statistically significant, suggesting that establishing a self-governance group is likely to lead to a decrease in costs (row 2, columns 1 and 2). These results are generally consistent regardless of the metrics used for matching (inverse distance vs. Mahalanobis).
Among other outcomes, two coefficients have a large magnitude: resource stock recovery and increasing harvest volume (rows 3 and 5, columns 1 and 2). Large, positive and statistically robust coefficients suggest that revenue may be increasing particularly because of recovering stocks and increased harvest volumes.
The ATE estimates show that some of the benefits arising from forming or becoming a member of a self-governance group may also extend to other groups who are not currently organized as self-governance groups. The ATE estimates for the eight outcomes are mostly positive and significant, and the magnitudes are similar to those for ATT (columns 3 and 4). This result suggests that, on average, the matched non-self-governance group could benefit as much as the self-governance group if it were to start self-governance. The only exception is the trend in illegal fishing. The ATT estimates are around 0.72 whereas the ATE estimates are around 0.41. Both are statistically significant, but the magnitude of the treatment effect is reduced for the ATE compared to that of the ATT. One interpretation of this result is that there is something that affects the establishment of self-governing groups that also affects the reduction of illegal fishing. From table 7, we see that the more income-dependent an average fisherman in the group is to the maul fishery, the more likely it is that he will join the self-governance group. Greater income-dependency also motivates a fisherman to protect the fishery and therefore to endeavor to reduce illegal fishing.
7. Conclusion
Self-governance of natural resources through groups of resource users who establish and impose management rules on themselves has been gaining increasing attention in the policy arena as an alternative to command-and-control and market-based mechanisms. Whether managing the resource as a group results in economic gains for the group's members is critical incentive-compatibility criteria for such groups to be sustained in the long run. This paper uses a unique set of data from South Korea to provide some of the first quantitative evidence that self-governance is benefiting those groups. Overall, we find that establishing a self-governance group benefits its members in terms of both revenue and the cost of fishery activities. We find that the establishment of a self-governance group leads to a better chance of stock recovery and larger harvests, as well as reductions in fishing efforts, disputes and illegal fishing. These findings are encouraging indications that support the incentive-compatibility condition for self-governance groups to function as clubs.
Our descriptive results show that one of the key motivations in establishing a self-governance group was the government's financial incentive program. Generally speaking, one would expect that such groups would not be successful in generating benefits since they may have lacked a strong motivation in better management of the fishery and that they would likely return to previous fisheries management once the incentive program ended. In this sense, it is thus surprising to find that fishermen groups perceived such positive effects of self-governance groups across our sample. This result indicates that, while their motivation might not have been better fishery management per se, members came to realize the benefits of collective self-governance. This finding suggests an interesting policy implication: what is important to successful self-governance is to first get it started, even if it requires external incentives; once group members realize the benefits of self-governance, it will be in their best interest to continue and manage the fishery better. Transitioning from limited access to a self-governance regime entails uncertainty (because it is new for them) and transaction costs, and it is conceivable that extension staff's recommendations and government financial incentives were helpful in making that transition. This result is consistent with the theory of clubs. Once a club member finds herself in a privileged position as a club member and perceives the benefits of the club, she has an interest in maintaining that status.
The data and the results of the empirical analysis show that the self-governance groups have been more successful than non-self-governance groups in the recovery of resource stock (tables 6 and 8). The results also imply that self-governance groups were at least not worse off relative to the non-self-governance groups in terms of changes in revenue and prices. More precisely, if the self-governance groups had not implemented the activities as groups, they could have been worse off. These outcomes can partly be attributed to self-governance groups' investment in joint marketing and quality control (table 2). This is a trend that also has been observed in Japanese coastal self-governance groups (Uchida, Reference Uchida2009) and was found more generally in rights-based fishery management schemes (Homans and Wilen, Reference Homans and Wilen2005). However, it is important that the self-governance groups experience actual increases in revenue rather than merely being better off relative to the non-self-management groups, because an increase in revenue (as opposed to a resource stock recovery) is a clear and tangible benefit for fishermen that often plays an important role in sustaining the collective fishery management scheme.
One important caveat is that these outcomes are based on perception questions, not actual levels of change in revenue, costs, prices, production and resource stocks. Therefore, while the covariate matching results are encouraging, the significance of their magnitudes remains an open question. Future research may successfully collect the type of data needed to answer those questions through cooperation with fishermen groups.
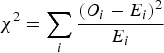 , where i is the cell index, O is the observed count data, and E is the expected count (Plackett,
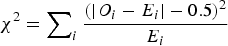 (Yates,