Implications
Average IgG1 concentration was studied in Holstein dairy cow colostrum to better understand between- and within-animal variations and the importance of sampling procedures. Colostrum from each quarter and a mix of four quarters was collected just after calving and/or every minute over the first milking. The results of this experiment indicated that the colostrum quality could be assessed on samples collected at any time during first milking. It could be performed from any quarter or by mixing colostrum samples on only 56% of cows.
Introduction
Colostrum is defined as the secretion from the mammary gland during the first 24 h after birth (Jaster, Reference Jaster2005), but the consensus is that only secretion from the first milking after parturition should be called colostrum (Park and Jacobson, Reference Park and Jacobson1993). Colostrum contains fat, protein, vitamins and minerals of importance for early neonate nutrition, and it is the only source of immunoglobulins (Ig) at birth in species like cattle and swine. IgG types account for over 75% of total Ig in bovine colostrum (Korhonen et al., Reference Korhonen, Marnilla and Gill2000), with IgG1 types being the most frequent. Research consistently shows the importance of a sufficient amount of colostrum containing high levels of IgG1 (50 g/l or higher) to feed newborn calves immediately after birth (Jaster, Reference Jaster2005; Conneely et al., Reference Conneely, Berry, Murphy, Lorenz, Doherty and Kennedy2014). Colostral IgG1 concentration varies between breeds (Muller and Ellinger, Reference Muller and Ellinger1981) and between same-breed cows within the same herd (Pritchett et al., Reference Pritchett, Gay, Besser and Hancock1991; Maunsell et al., Reference Maunsell, Morin, Constable, Hurley, McCoy, Kakoma and Isaacson1998). Optimal colostrum management therefore hinges on knowing each cow’s individual IgG1 concentrations (see Godden (Reference Godden2008) for a complete review).
However, regardless of the method used, sampling procedures can also influence IgG1 concentration in the collected colostrum. Measurements are usually based on whole colostrum (or composite samples). In Holstein dairy cows, Gomes et al. (Reference Gomes, Madureira, Soriano, Melville, Della Libera, Garcia Blagitz and Benesi2011) reported no difference in median IgG values in colostrum collected from right and left front and hind quarter teats. In practice, when calving occurs during the night, some farmers use frozen stored colostrum or milk the cow by hand to quickly feed the newborn calf, as absorption is the greatest within the first hours of life (Weaver et al., Reference Weaver, Tyler, VanMetre, Hostetler and Barrington2000). In some cases, the colostrum comes from only two or three quarters and/or a partial milking. Partial milking is known to alter milk quality, especially fat content (Guinard-Flament et al., Reference Guinard-Flament, Michalski and Rulquin2001), but the effect of this practice on colostral IgG1 concentration remains unknown, and the issue of potential differences in IgG1 concentrations between quarters remains unanswered. Given the cost of the analysis, it is important to find out whether IgG1 concentration in the colostrum is repeatable from one lactation to another. If so, then even if literature shows that IgG1 concentration usually increases with parity, a cow producing a colostrum of good quality at parity one would be expected to produce a better or at least equivalent colostrum at parity n+1. From a practical standpoint, if IgG1 concentrations are repeatable from lactation to lactation, then expensive lab analysis would not be required at each calving.
To resolve this issue, we carried out studies in cows to analyze variations in average IgG1 concentration between the four quarters, changes in IgG1 concentration during milking, and the repeatability of colostral IgG1 concentrations between successive lactations.
Material and methods
The data came from experiments performed during the 2009 and 2010 calving seasons (September to January) at the INRA’s experimental farm at Mejusseaume–Le Rheu, in western France (48°11'N; 1°71'W; altitude 35 m).
Animal management
Holstein cows, regardless of parity, BW or body condition score (BCS), were used in this study. In this experimental farm, cows were grouped 3 weeks before expected day of parturition and did not change groups for at least the next 15 days. The cows selected calved from 30 September 2009 to 24 February 2010, but 72% of calves were born in October, November and December. Throughout the experiment, all cows were housed indoors in groups of 30 to 60 animals depending on parturition date. All cows underwent the same management in the 3 weeks before expected day of parturition. As expected calving date approached, each cow was observed twice a day, and when parturition became imminent, moved to individual straw-bedded box stalls a few days before calving. Calvings were observed and attended by trained technicians. Calves were separated from their dams immediately after birth, so that no suckling occurred. If a calf was suspected to have suckled, the dam data was removed from the final analysis. Cows were milked within the first 2 h post-calving.
All information on calves at birth (date and time of birth, sex, weight, health status, presentation and calving difficulties) were recorded but not used here. For the pluriparous cows (n=63), data included parity, previous lactation performances, that is milk yield and composition, length of lactation and length of preceding dry period. Under routine herd management, cows were dried at either 2 to 2.5 months before expected day of parturition if they still produced 15 to 25 kg milk per day, or at around 3 months before expected day of parturition if they produced <15 kg milk/day. For all cows (primiparae and pluriparae), BW was measured the week following parturition. BCS was recorded on all cows by specially trained technicians on the first Thursday of each month, regardless of parturition date. As these measures were sometimes effectively 3 to 4 weeks after calving, this information was not used here.
All cows followed the same feeding program during the dry period. They received a total mixed ration (TMR) of 84.5% corn silage, 4% concentrate, 9% soybean meal and 2.5% straw on a DM basis. This TMR was designed to supply 6.41 MJ/kg DM of net energy (NEL) and 91 g/kg DM of protein truly digested in the small intestine limited by energy supply (PDIE) (INRA 1989 and 2007). Total amount corresponded to 10 kg of DM per day and per cow. After calving, all cows received a TMR of 52.5% corn silage, 24.7% concentrate, 8% soybean meal, 10% dehydrated alfalfa, 2.5% straw, 0.8% urea and 300 g of minerals per kg DM to supply 6.69 MJ/kg DM of NEL and 109 g/kg DM of PDIE. Concentrate composition was 20% wheat, 20% corn, 20% barley, 20% sugar beet pulp, 15% wheat bran, 3% sugar cane, 1% vegetable oil and 1% salt. Animals were fed ad libitum at 0800 and 1700 h and had free access to water, fresh straw and salt licks. During dry and lactation periods, refusals were recorded before 0800 h every day.
Colostrum sampling and analysis
To study whether IgG1 concentration differed between quarters, a fresh colostrum sample from each quarter was hand-collected into 5-ml plastic tubes before milking, after discarding the first jets. Thereafter, the remaining colostrum of each quarter was pooled and mixed, and another 5-ml sample was collected. After milking, another 25-ml sample was collected from the bucket. This first trial used a total of 77 healthy cows regardless of their parity at calving. Only cows that never suffered from health problems or mastitis were selected. Multiparous cows that had produced milk that contained more than 400 000 cells/ml in the previous lactations were not selected.
To study variations in IgG1 concentration during the first milking after calving, colostrum was sampled every 60 s from the start of the milking, that is four to nine times according to milking duration. Each milking station had an individual autosampler and a milk meter (DeLaval Milk Meter MM25, DeLaval, Tumba, Sweden). Every 60 s, the amount of colostrum collected was recorded and a sample from the autosampler was collected and stored. The collection container was renewed every minute. Colostrum was collected from nine multiparous healthy cows. Samples were collected into 5-ml plastic tubes as described above. All 5-ml samples were stored and used for IgG1 and density measurements whereas the 25-ml samples were tested for fat, urea and protein concentration and somatic cell count (SCC). Samples were frozen at −20°C until laboratory analysis.
Before infrared analysis of fat, protein, urea and SCC (Milkoscan; Foss Electric A/S, Hillerod, Denmark), each colostrum sample was thawed at 20°C, mixed and diluted four times with distilled water. Colostral IgG1 concentration was determined via a semi-automated single radial immunodiffusion technique (Mancini et al., Reference Mancini, Carbonara and Heremans1965; Levieux and Ollier, Reference Levieux and Ollier1999) using commercial kits (ID Ring BOV IgG; ID Biotech, Issoire, France). Sample dilution was adjusted to meet the manufacturer’s recommendations (1000 times). Between- and within-assay repeatability was 5% and 9%, respectively, according to ID Biotech, and 10% and 15%, respectively, according to our own in-lab tests run before performing the analyses. Furthermore, in order to gauge colostrum quality, the colostrum density of each sample was also determined in-lab under standard temperature and humidity conditions by analyzing weight-to-volume ratios five times per sample.
Statistical analysis
R Software was used for all analyses (Venables and Smith, Reference Venables and Smith2010). Distributions of continuous variables were examined and, if necessary, log-transformed (SCC to somatic cell score (SCS), but only SCC data are reported and discussed). To study IgG1 concentration and its average variation between quarters, ANOVA model was used including the effect of quarter and cow. In this approach, type-I error rate was controlled, and once the effect of the quarter on IgG1 levels was proven, a Student–Newman–Keuls test was used to compare all pairs of quarters to inform the interpretation. A similar approach was used to compare left v. right quarters and hind v. front quarters.
For the study on factors influencing colostral IgG1 levels, the model tested BW, calving date, parity, dry period length, fat, protein and urea levels in the colostrum, SCS, and all information on previous lactation (duration, milk yield, fat and protein concentration). Principal component analysis was also performed to visualize the correlations between variables. These variables were tested for association with IgG1 concentration in a series of univariate analyses. Multiple regressions were also performed (with most variables transformed from continuous to categorical variables) but are not reported here as the aim was to study the separate impacts of variation in each variable on IgG1 concentration, with all other variables considered fixed.
The repeatability of IgG1 concentrations was estimated by a single model correlation that used the effect of year and cow.
Results
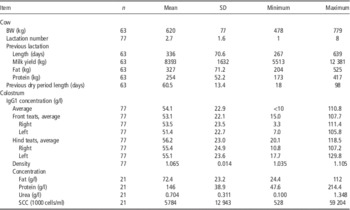
Parity at calving was 2.7 (±1.6) but ranged from 1 to 8 (Table 1). Average BW at calving (mean and standard deviation) of the 63 multiparous cows was 620 (±77) kg, but ranged from 478 to 779 kg. Previous lactation yield of multiparous cows was 8393 (±1632) kg/cow, for an average lactation length of 336 (±71) days. Dry period length averaged 60.5 (±13.4) days, but ranged from 35 to 98 days.
Main descriptive characteristics of the cows and colostrum

SCC=somatic cell count.
Colostral IgG1 concentration averaged 54.1 (±22.9) g/l. Colostrum density analyzed on total samples (i.e. not on a quarter basis) averaged 1.065 (±0.014) g/ml and varied from 1.035 to 1.105 g/ml in relation to IgG1 concentration (R 2=0.43). Fat, protein, urea and SCC analyzed on 21 cows averaged 72.4 (±23.2) g/l, 146 (±38.9) g/l, 0.704 (±0.31) g/l and 5784 (±12 943)×1000 cells/ml.
IgG1 variability within a cow udder
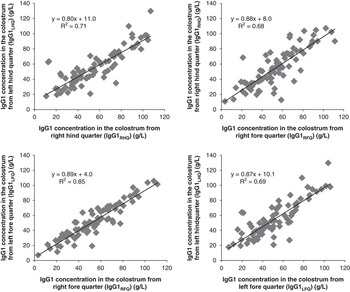
Analysis performed on 77 cows showed a positive linear relationship between quarters of all cows tested (Figure 1), with the highest correlation found between left-front and right-front quarter IgG1 concentrations (R 2=0.85). However, front quarter IgG1 concentrations were slightly but significantly lower than hind quarter IgG1 concentrations (53.1 v. 56.1 g/l, respectively). Analysis performed on a quarter basis found that average IgG1 concentration was lower in the left-front quarter than the left-hind quarter (51.3 v. 55.3 to 55.4 g/l; P<0.05) but not different to right-front quarter (53.5 g/l). Average IgG1 concentration in the left-hind quarter (IgG1LHQ, g/l) appeared to be the best predictor of whole-colostrum IgG1 concentration (IgG1TOT, g/l), as estimated using the following equation: IgG1TOT, g/l=0.84× IgG1LHQ g/l (R 2=0.95). For all other quarters, correlation coefficient was <0.84 (from 0.75 to 0.77) and R 2 value was also lower (0.92 on average).
Relationship between average IgG1 concentrations in the different quarters (n=77 cows; Y=aX+b).

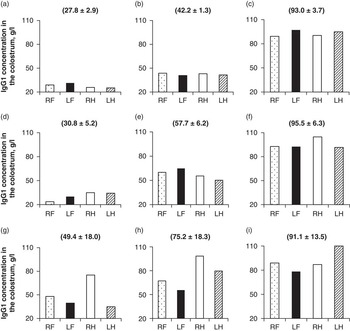
For 56% of cows, relative standard deviation (RSD) on average IgG1 concentration between quarters was <11%, and there were no significant differences in average IgG1 concentration between quarters (Figure 2a to c). In this 56% subgroup, maximum standard deviation (SD max) within-udder was 8.7 g/l, which corresponded to a 21 g/l maximum difference (MD max) between quarters. Average colostrum IgG1 value was 61.7 g/l in this subgroup, but as shown in Figure 2a, some animals had low average value (27.8±2.9 g/l for cow an e.g.). For the 44% remaining animals, IgG1 concentration differed significantly between quarters, and this difference varied between animals. For example, average IgG1 concentrations were higher in front-left quarters for some cows but higher in hind-teat quarters for others. Thus, for 30% of cows, RSD varied between 11% and 20%, and corresponded to an SD max of 14.7 g/l and an MD max of 32 g/l (Figure 2d to f). Average colostrum IgG1 value was 59.9 g/l in this subgroup. In the remaining 14% of cows for which RSD was over 20%, SD max was 21 g/l and MD max was 45 g/l (Figure 2g to i). Average colostrum IgG1 concentration was 48.3 g/l in this subgroup. As in the first subgroup, there were huge variations between average levels, that is between animals, in these two subgroups (Figure 2).
Examples of IgG1 concentration in the right-front (RF), left-front (LF), right-hind (RH) and left-hind (LH) udder quarters of nine cows, with either low (a to c), medium (d to f) or high (g to i) values of standard deviation between quarters (in brackets, mean IgG1 concentration±SD).

Repeatability of IgG1 concentration during milking and parity-to-parity
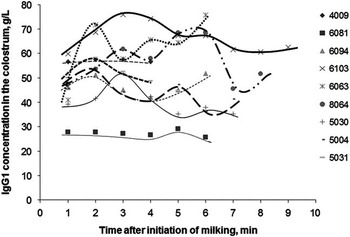
The analysis performed during milking showed no statistical variation in average IgG1 concentrations between samples collected every 60 s from nine cows, despite large variations in at least one cow (Figure 3).
Time-course evolution of IgG1 concentrations in cow colostrum over the first lactation milking (nine cows).

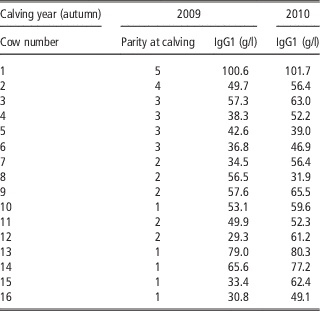
Table 2 presents the repeatability between two successive lactations of average colostral IgG1 concentration measured in 16 cows. Average IgG1 concentration for these animals was 43.2 (±19.1) in 2009 and 62.9 (±16.6) g/l in 2010. Analysis showed that colostrum IgG1 concentration was affected by cow (P<0.001) and year (P<0.05). For these 16 cows, average IgG1 concentration increased by 8.8 g/l between parity n and parity (n+1) (P=0.019). However, for two cows, average IgG1 concentration decreased from 2009 to 2010: the decrease was slight for one cow (−3.6 g/l i.e. −8.5%) but huge for the other (−24.6 g/l i.e. −43.6%). The lowest parity-to-parity increases (+1 or 2%) were found in cows that produced high colostral IgG1 concentrations at parity n (>70 g/l). Conversely, the highest parity-to-parity increases (>25% more) were found in cows that produced low colostral IgG1 concentrations during the previous parity (<40 g/l).
IgG1 concentrations in the colostrum of 16 cows milked in 2009 and 2010

Other factors potentially affecting affect colostrum quality
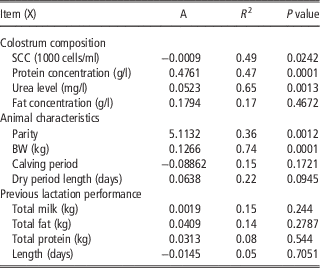
Table 3 reported the factors potentially affecting colostrum composition. Colostral IgG1 concentration was correlated to protein and urea concentration (R 2=0.47 and 0.65, respectively; P<0.001) and tended to positively correlate to length of dry period (R 2=0.22; P<0.1). Length of previous dry period had a limited impact on IgG1 concentration: a decrease from 90 to 30 days led to a decrease of 3.8 g/l. Colostral SCC was slightly negatively correlated to IgG1 concentrations (R 2=0.49; P<0.05). Average IgG1 concentration was positively correlated to both parity and BW at calving: an extra 10 kg of BW at calving resulted in a 1.23 g/l increase in IgG1 concentration, and a one-unit increase in parity resulted in a 5.1 g/l increase in IgG1 concentration. As these factors were analyzed separately, we cannot conclude on whether the effects were additive. Calving period and previous lactation performance had no effect on IgG1 concentration in colostrum.
Impact of selected factors on colostrum IgG1 concentrations using a single regression

SCC=somatic cell count.
Discussion
Sources of IgG1 variations between cow colostrums
The average IgG1 concentration (54.1 g/l) observed here indicated that most cows produced a good quality colostrum. This average was higher than values reported by Foley and Otterby (Reference Foley and Otterby1978) and Baumrucker et al. (Reference Baumrucker, Burkett, Magliaro-Macrina and Dechow2010) (32.0 and 37.5 g/l, respectively) but close to values reported by Pritchett et al. (Reference Pritchett, Gay, Besser and Hancock1991) and Gulliksen et al. (Reference Gulliksen, Lie, Solverod and Osteras2008) (48.2 and 51.7 g/l, respectively). A recent study by Conneely et al. (Reference Conneely, Berry, Murphy, Lorenz, Doherty and Kennedy2014) found a mean IgG value of 112 g/l, but with a range from 13 to 256 g/l, and 96% of samples contained >50 g/l of IgG. Here, IgG1 concentration varied from <10 g/l up to 111 g/l. But, one has to be careful with the average value, because it is hiding variations, since in around 60% of samples analyzed, average IgG1 concentration was <50 g/l, a value usually considered as the baseline threshold for adequate colostrum in terms of immune quality. Gulliksen et al. (Reference Gulliksen, Lie, Solverod and Osteras2008) also reported a high proportion of colostrum that had <50 g/l of IgG1 in Norway, whereas Quigley et al. (Reference Quigley, Lago, Chapman, Erickson and Polo2013) reported that only 16% of 183 colostrum samples from seven different US farms had <50 g/l of IgG1. All these previous studies reported a wide range of IgG1 concentrations, but also a wide range of variation in IgG1 concentrations. These variations are well known and confirm that a per-herd average IgG1 concentration value is not sufficient to gauge the quality of colostrum produced.
The milk yield of cows in the present experiment (8400 kg) was similar the 9079 kg value reported by Pritchett et al. (Reference Pritchett, Gay, Besser and Hancock1991) but much higher than the 5256 kg reported by Conneely et al. (Reference Conneely, Berry, Sayers, Murphy, Lorenz, Doherty and Kennedy2013), which may at least partially explain the difference in mean IgG1 value between these studies. Differences in lab analysis techniques and/or sample preparations may also partly explain part of the differences in mean IgG1 value between studies, along with breed and/or nutritional management (Conneely et al., Reference Conneely, Berry, Sayers, Murphy, Lorenz, Doherty and Kennedy2013). The length of calving to collection interval has also been proposed to explain differences between animals and/or studies, but the interval here was very short as all cows were milked within 2 h of calving.
Large between-cow variation may be at least partially due to parity which is generally closely connected to BW and/or cow development, at least during the first lactation (Muller and Ellinger, Reference Muller and Ellinger1981; Pritchett et al., Reference Pritchett, Gay, Besser and Hancock1991; Maunsell et al., Reference Maunsell, Morin, Constable, Hurley, McCoy, Kakoma and Isaacson1998; Tyler et al., Reference Tyler, Steevens, Hostetler, Holle and Denbigh1999). As BW increases with parity, we tested the relationship between IgG1 concentration and BW, but the correlation was weak (R 2=0.20). In addition, the maximal difference between animals found in this experiment (<20 g/l up to 121 g/l) could not be explained by parity or BW only. In many cases, mean IgG1 concentration of first-lactation cows was higher than 50 g/l, with which supports Conneely et al.’s (Reference Conneely, Berry, Sayers, Murphy, Lorenz, Doherty and Kennedy2013) conclusion that colostrum from these animals should not be discarded. Other factors, such as genetic merit for colostrum production and/or high immune response, are probably important but could not be analyzed here as relevant data was unavailable.
Results from this study indicated that a dry period of over 5 to 6 weeks had no or limited impact on colostral IgG1 levels, which usually start to increase 2 to 3 weeks before parturition (Sordillo and Nickerson, Reference Sordillo and Nickerson1988). The start of colostrogenesis also results in an accumulation of other IgG, proteins, fat and carbohydrates and the importance of the dry period length cannot then be summarized by the concentration of IgG1 in the colostrum at calving. Overly-short dry periods (3 weeks or less) may affect body reserves and subsequent lactating performance, and that is the reason why a dry period of at least 5 weeks is generally recommended. The observed negative impact of cell level, estimated through SCC, on IgG1 concentration suggested that for efficient immune protection, high-cell-content colostrum should not be used to feed newborn calves (Dardillat et al., Reference Dardillat, Trillat and Larvor1978), as recommended in many countries. Finally, neither average colostral IgG1 concentration nor colostrum composition were affected by previous performance, in agreement with Robinson et al. (Reference Robinson, Moorby and Gisi2009).
Within-cow IgG1 variations
Average IgG1 concentrations were slightly but significantly different between quarters. Baumrucker et al. (Reference Baumrucker, Stark, Wellnitz, Dechow and Bruckmaier2014) also concluded that both IgG1 concentration and total mass were different between udder quarters based on an experiment performed on eight animals. However, Gomes et al. (Reference Gomes, Madureira, Soriano, Melville, Della Libera, Garcia Blagitz and Benesi2011) reported no significant difference between quarters (median Ig concentrations per udder quarter of 78, 64, 78 and 64 g/l for right-front, right-hind, left-front and left-hind quarters, respectively) in an experiment on 53 Holstein cows. The average between-quarter values found here were below previous values and also differed from cow-to-cow, with some having higher IgG1 concentrations in front udder quarters and others in hind udder quarters. The difference in IgG1 concentrations between front and hind udder quarters was also reproduced when comparing left v. right sides. Maximum difference between quarters was 21 g/l in 56% of cases but reached up to 45 g/l in 14% of cases. According to Baumrucker et al. (Reference Baumrucker, Stark, Wellnitz, Dechow and Bruckmaier2014), sampling fluid or tissue from one mammary gland for analysis of colostrogenesis may not reflect the processes occurring in the other quarters of the udder. Based on these observations, colostrum to be delivered to calves should be collected from all four quarters. However, in practice, colostrum may be collected from only two or three quarters, since within-udder between-quarter variations in IgG1 concentration tend to be low (56%) or moderate (30%) in most cases.
Average IgG1 concentration did not change significantly mid-colostrum-milking. We hypothesized that the lab method might be responsible for this result. Indeed, we estimated the variability during lab analysis as around 15%, which is similar to the variations in IgG1 concentration noted during the milking process. The risk of falsely assessing colostrum quality by sampling the wrong fraction (cisternal v. alveolar colostrum) was therefore low. Hostetler et al. (Reference Hostetler, Douglas, Tyler, Holle and Steevens2003) compared colostral IgG1 concentrations from samples collected before milking, in the bucket after milking and from hand-extracted samples after milking, and found no difference between samples. This points to the conclusion that an incomplete first milking does not affect the IgG1 quality of colostrum. From a practical point of view, as partial milking does not alter IgG1 concentration in the colostrum, this practice used by some farmers when calving occurs in the night becomes a reasonable option.
Repeatability of IgG1 concentration
Despite the small sample population (n=16), our results suggest that year-on-year variations in average IgG1 colostrum concentration may exist but are mostly due to increased parity and/or, in close connection, BW at calving. These results are in agreement with Dardillat et al. (Reference Dardillat, Trillat and Larvor1978) and Norman et al. (Reference Norman, Hohenboken and Kelley1981) who found relatively high repeatability of IgG1 concentration in cow colostrum (h2 from 0.20 to 0.30). In terms of on-farm practice, this means that a healthy cow producing good-quality colostrum (from an IgG1 concentration point of view) will likely continue producing good-quality colostrum after subsequent parturitions. For farmers who want to deep-freeze colostrum, this information indicates that annual analysis of IgG1 concentration through lab analysis, which remains the reference method for precise determination of IgG1 concentration, is probably not necessary for all animals. As some animals may show a strong drop in IgG1 concentration between parities, a rapid on-farm estimation of IgG1 concentration should be performed, using methods based on density or refractometry measurements. Nevertheless, high IgG1 concentration in the colostrum does not necessary signify high IgG1 in the calf sera (Norman et al., Reference Norman, Hohenboken and Kelley1981), which underlines the importance of housing and management conditions to ensure optimal calf survival (Jégou et al., Reference Jégou, Porhiel, Brunschwig and Jouanne2006).
Conclusion
This study demonstrated that an incomplete first milking does not affect IgG1 concentration in the colostrum. Colostrum extracted from one or two quarters was representative of all four quarters in only half of the animals studied here. If feasible for the farmer, colostrum quality should be assessed on composite colostrum samples collected at any time during the first milking. As this measure appears to be repeatable for healthy cows, a single analysis just after calving in primiparous cows should be sufficient to classify the cow’s ability to continue producing a good (or not) colostrum (from an IgG1 concentration standpoint) for the rest of her productive life.
Acknowledgments
The authors thank the technical staff at the Dairy Research Station at Méjusseaume, Le Rheu for taking care of the animals and running the colostrum and serum samplings. They also thank C. Doré for running the laboratory analysis, M. Kloareg for running the statistical analysis and A-T-T Scientific Editing Services (Clermont-Ferrand, France) for proofreading the manuscript.