





Fiscal policies such as taxes on unhealthy foods have been recommended by the WHO to promote healthy nutrition and prevent non-communicable diseases(1). Overweight and nutrition-related factors have been reported as one of the largest causes of health loss(2), premature deaths and health inequities(Reference Teng, Atkinson and Disney3,Reference Disney, Teng and Atkinson4) . There is a direct association, for example, between exposure to ultra-processed food consumption and multiple health outcomes including mortality, cancer, cardiovascular and mental health(Reference Lane, Gamage and Du5).
A growing number of jurisdictions have responded to increases in obesity and nutrition-related non-communicable diseases with fiscal policies. Sugar-sweetened beverage taxes are commonly used(6), and in a similar vein, a number of jurisdictions are adopting excise taxes on foods high in fat, salt and sugar (HFSS). There are 41 countries with examples of these taxes identified by the Global database on the Implementation of Food and Nutrition Action(7). However, only a limited number of policies have been evaluated(Reference Pfinder, Heise and Hilton Boon8), with observational studies examining HFSS food tax effects in Mexico, Hungary, Denmark and selected jurisdictions in the United States(Reference Pfinder, Heise and Hilton Boon8,Reference Pineda, Gressier and Li9) . Food tax levels were generally less than 10 %, and tax impacts reflected this with small declines in purchasing or intake (e.g. 5 %(Reference Batis, Rivera and Popkin10), 3 %,(Reference Bíró11), 4 %(Reference Smed, Scarborough and Rayner12)). No evaluations were available from Asia or the Pacific, Small Island Developing States or Low-Income Countries. Further HFSS tax research has been recommended for more informed policymaking(Reference Pfinder, Heise and Hilton Boon8,Reference Pineda, Gressier and Li9) .
Tonga is a middle-income country in the South Pacific which has some of the highest obesity and diabetes rates in the world(Reference Kessaram, McKenzie and Girin13), a modern phenomenon driven by globalisation and the availability of highly processed energy-dense imported food. Tonga introduced excise taxes and tariffs from 2013 to 2018 that targeted foods HFSS. Tax increases were generally excise taxes, moderate to high levels, volumetric in nature (per kg), and they targeted a broad range of commonly consumed unhealthy food options, the vast majority of which are imported into the country. Tariff waivers on fish, fruit and vegetables were also introduced in 2013, 2015 and 2016, respectively. There was generally a low level of public awareness about fiscal policy changes (<20 % population were aware about the 2017 tax changes)(6).
However, excise tax and tariff increases were expected to pass-through to prices and reduce the demand for taxed foods. On the other hand, taxing some HFSS foods and not others might increase the risk that consumption would shift towards other unhealthy food items that are not taxed (substitution)(Reference Aguilar, Gutierrez and Seira14). Experts have recommended: broadening the tax base to include a broad range of HFSS foods, introducing a larger 20 % to 50 % level of tax increase(Reference Powell and Chaloupka15,Reference Franck, Grandi and Eisenberg16) , introducing waivers for healthy foods at the same time as excises and improving the saliency (awareness) of the tax, with the expectation of improved effects(Reference Pineda, Gressier and Li9). Tonga’s tax policy aligns with several of these principles, presenting an opportunity to evaluate its real-world impact.
The aim of this study was therefore to quantify how Tongan food taxes affected food prices and import supply. Our focus was on foods that were taxed, with reporting also on potential substitute foods. It was expected that tax changes of over 10 % will typically increase the shelf price of taxed foods, and that subsequently the importation volumes of taxed foods will decline, compared to pre-existing trends.
Methods
For each food tax, an interrupted time series(Reference Lopez Bernal, Cummins and Gasparrini17,Reference Penfold and Zhang18) design was used to compare observed food prices and import volumes after the tax, with a ‘counterfactual,’ that is the average expected projected outcomes with no tax change. An interrupted time series analysis is a commonly applied method for analysing natural experiments where the same population is compared before and after a population-level intervention. The method was selected based on its strength of design in reducing the risk of selection bias, time-varying confounding and suitability for assessing tax policy changes and population-level outcomes(Reference Lopez Bernal, Cummins and Gasparrini17). Analysis was pre-planned and reported in a pre-published protocol(Reference Teng, Wilson and Puloka19).
Food excise taxes
Any excise or tariff targeting food was eligible for evaluation if it was introduced (or increased) between 2009 and 2019, the tax increase comprised more than 10 % of import value, and there were outcome data for at least 12 months pre- and post-tax. The level of excise taxes (T$/kg) was compared to imported food value in the year of the tax change from (T$/kg) to give an ad valorem equivalent (AVE, %) tax rate(Reference Stawowy20). This AVE enabled concurrent changes in excise and tariff to be combined (excluding consumption taxes) and was used to calculate tax elasticities (%change in import volume for each %change in tax). Tax elasticities were used to compare outcomes across different food tax rates and estimate the average impact of the food tax policies.
Price data
Price data were provided by the Tonga Department of Statistics covering the period from September 2010 to December 2019 (i.e. before the disruption associated with the Covid-19 pandemic in 2020). Monthly prices (inclusive of taxes) were collected from retail surveys for commonly consumed foods. The retail survey was redesigned in September 2017, thus interrupting the time series for some foods. Indicator foods were selected (Additional File: Table C) if they were subject to excise tax or were potential substitute foods, and they had a year of data available pre- and post-tax (uninterrupted by changes in survey method). Focus was given to prices collected in Tongatapu, the largest island with 74 % of the population of Tonga, to ensure comparability in price data over time.
Trade and revenue data
Customs datasets with import data were provided by the Tonga Ministry of Revenue & Customs for the period of January 2010 to December 2019. The dataset included date of payment, trade type (import/export), food type description, trade code (international Harmonised System of coding used for analysing trade flows), warehouse description, quantity (e.g. kg or L), cost, insurance and freight value, and tax paid (tariff, excise, consumption tax, total in T$). The customs and revenue dataset also included rows for the revenue collected from local manufacturers of excise-taxed foods. Identical duplicate rows were removed.
Import data were classified into food groups using the Harmonised codes described in the legislation for each tax (Additional File: Table B), and keywords from the food type description were used for consistent categorisation of foods over time if pre-tax Harmonised System codes were not specific to the taxed food. Trade data quality was checked to identify any unusual missing data, trends and outliers. Data were cleaned using an automated process to recalculate outlying values from the warehouse description, with manual checks of remaining outliers (Additional File: Further Methods).
Analysis
The primary study outcomes were (1) average price changes in selected indicator foods (T$ per item) and (2) import volumes into Tonga (kg per population) for taxed foods, in the first-year post-tax. Outcomes for potential substitute foods and outcomes two years post-tax were also reported as secondary outcomes. Potential substitutes comprised foods that were not subject to tax increases or tax decreases or waivers during the study period. We report findings for potential substitute food if they could have replaced taxed foods in the usual consumption pattern and diet.
Interrupted time series analysis can be used to investigate the change in an underlying outcome trend and can control for other factors affecting this trend. Generalised least squares regression was used to fit a segmented linear model to monthly data. A level and a trend term were included to model, the latter controlling for short-term fluctuations in the series and any secular trend(Reference Lopez Bernal, Soumerai and Gasparrini21). Observed post-tax trends were compared with pre-tax trends projected forward. Testing and adjustment for autocorrelation and moving averages was informed by the unadjusted model using a graph of the residuals and a plot of the autocorrelation function and partial autocorrelation function. If the autocorrelation-adjusted model was significantly different from the unadjusted model (log-likelihood ratio test), then the model with the best fit to the data was selected (lowest AIC). If the autocorrelation-adjusted model was significantly different from the unadjusted model (log-likelihood ratio test), then the model with the best fit to the data was selected (lowest AIC).
The model was adjusted for potential (pre-selected) time-varying influences from factors that predict import volumes and prices of taxed foods. These were exchange rate (T$/US$), international oil prices (proxy for shipping costs), GDP, international visitor numbers, season and international food prices (for chicken, mutton, beef, sugar and oranges if the outcome aligned with one of these products). The time-varying seasonal effect was modelled using the month of the data. If a more complex model including cyclones causing substantial damage in Tonga (e.g. February 2018 Cyclone Gita, dummy variable) or price survey method change (September 2017, level and trend change) was a significantly better model fit, assessed using likelihood ratio tests, then these variables were also added to the model. The following equation provides an example of the fitted linear time series regression model for mutton flaps.
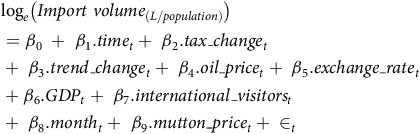 $$\eqalign{ & {\rm{lo}}{{\rm{g}}_e}\left( {Import\;volum{e_{\left( {L/population} \right)}}} \right)\; \cr & = {\beta _0}\; + \;{\beta _1}.tim{e_t} + \;{\beta _2}.tax\_chang{e_t} \cr & + \;{\beta _3}.trend\_chang{e_t} + \;{\beta _4}.oil\_pric{e_t} + \;{\beta _5}.exchange\_rat{e_t} \cr & + {\beta _6}.GD{P_t} + \;{\beta _7}.international\_visitor{s_t} \cr & + \;{\beta _8}.mont{h_t} + \;{\beta _9}.mutton\_pric{e_t} + \;{ \in _t} \cr}$$
where time is the baseline time trend, tax_change is the level change at the tax was introduced (dummy variable pre-tax = 0 and post-tax = 1), trend_change is the change in the trend post-tax (slope). If there were multiple intervention points for the same food, these were evaluated within the same model. Both import volumes and prices were expected to only have positive values. The import outcome values were log-transformed to predict non-negative average outcomes and stabilise variances. Multiplicative effects were estimated and interpreted as percentage changes and elasticities. Parametric multivariate simulation and bootstrapping were used to estimate percentage change outcomes and their 95 % CI (using the coefficients and their se from the generalised least squares model and allowing for correlation between correlates) to estimate the average tax effect in the first-year post-tax compared to counterfactual. A random effects meta-analysis technique was used to pool these percentage change effect sizes across different excised taxed foods to give an overall average tax effect. Tax pass-through was calculated as the modelled post-tax change in price compared to counterfactual (T$/kg) divided by the level of the tax in T$/L (Additional File: Table F).
Sensitivity analyses assessed the robustness of the key food price and trade results in pre-specified scenarios:
-
1. A two-month time lag between tax legislation and change in outcome was added to reflect the extra time it took for excise collection to begin after legislation was changed for some taxes.
-
2. Pre-tax data were limited to three years pre-tax change, to limit the influence of potential long-term historical trends(Reference Lopez Bernal, Cummins and Gasparrini17).
An additional sensitivity analysis scenario:
-
3. Exchange rate was removed from the model to assess impact of potential collinearity between covariates
The change in government tax revenue was calculated from the summed excise, tariff and consumption tax revenue in the 12 months after each tax increase compared to the 12 months before.
All analyses were done using R version 4.3.1 [R Statistical Foundation, Vienna, AT]. Generalised least squares regression was fitted using the nlme package(Reference Pinheiro, Bates and DebRoy22).
Results
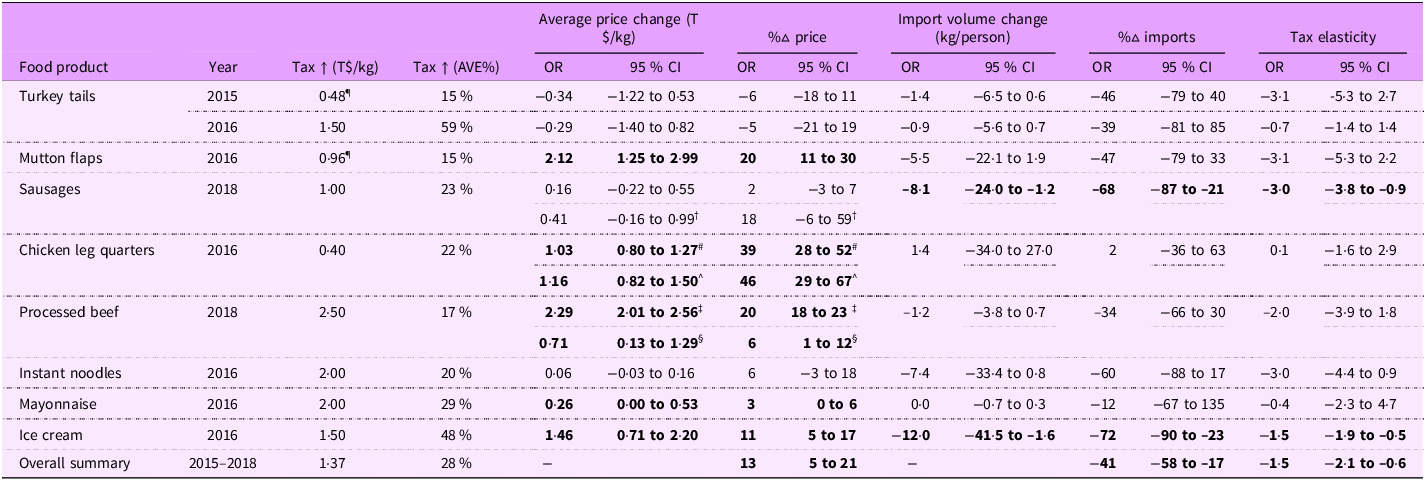
From 2015 to 2018, Tonga implemented nine tax increases that were eligible for evaluation, of which seven were volumetric excise taxes and two were increases in ad valorem import tariffs. There was an average tax increase of 28 %, as a proportion of a food’s import value (Table 1). Evaluated volumetric tax levels varied from T$0·40/kg (US$0·17) to T$2·50/kg (US$1·08) (Additional File: Table A).
Impact of tax increases on taxed food prices and import volumes, for the first-year post-tax, Tonga
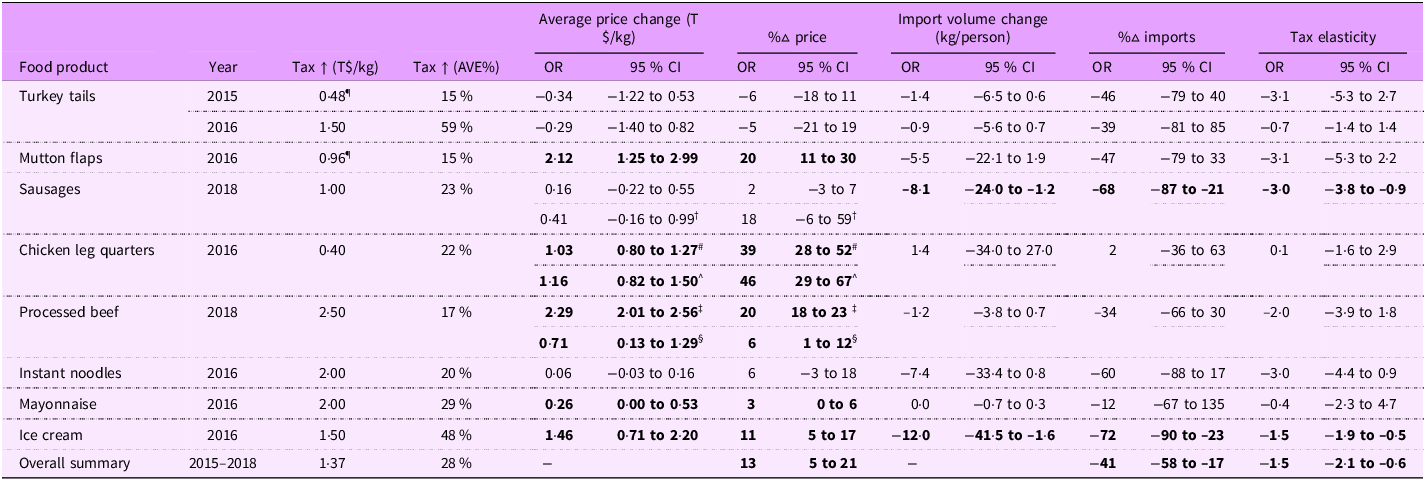
Table 1. Long description
The table has 10 rows and 10 columns. The columns are labeled as Food product, Year, Tax ↑ (T $/kg), Tax ↑ (AVE%), Average price change (T$ /kg), %Δ price, Import volume change (kg/person), %Δ imports, and Tax elasticity. The rows list different food products and their respective data for the specified years. Each row provides specific values for the tax increase, average price change, percentage change in price, import volume change, percentage change in imports, and tax elasticity. The table captures the impact of tax increases on various food products over the specified period.
† Price change for hot dogs.
‡ Corned beef.
§ Salted beef.
¶ These were increases in import tariffs, not excise taxes like the remainder. Tariff increases were converted into T$/kg using import unit value for the same year.
# Price for frozen chicken pieces.
^ Price for fresh chicken pieces.
AVE is the ad valorem size of the tax change as a percentage of import value. GLS segmented linear model adjusted for GDP, month, international visitor numbers, exchange rates and oil prices and autocorrelation effects if relevant, followed by bootstrapping to estimate the sum of difference between modelled and counterfactual import volumes in the year following the tax change. Overall summary presents meta-analysis random effects summary measures for the percentage change in price and imports. Tax elasticity is the percentage change in import volume divided by the tax increase (AVE%) and the summary measure of each in the case of the overall value. Bolded results were statistically significant, p < 0·05.
Taxed foods
Indicator food prices
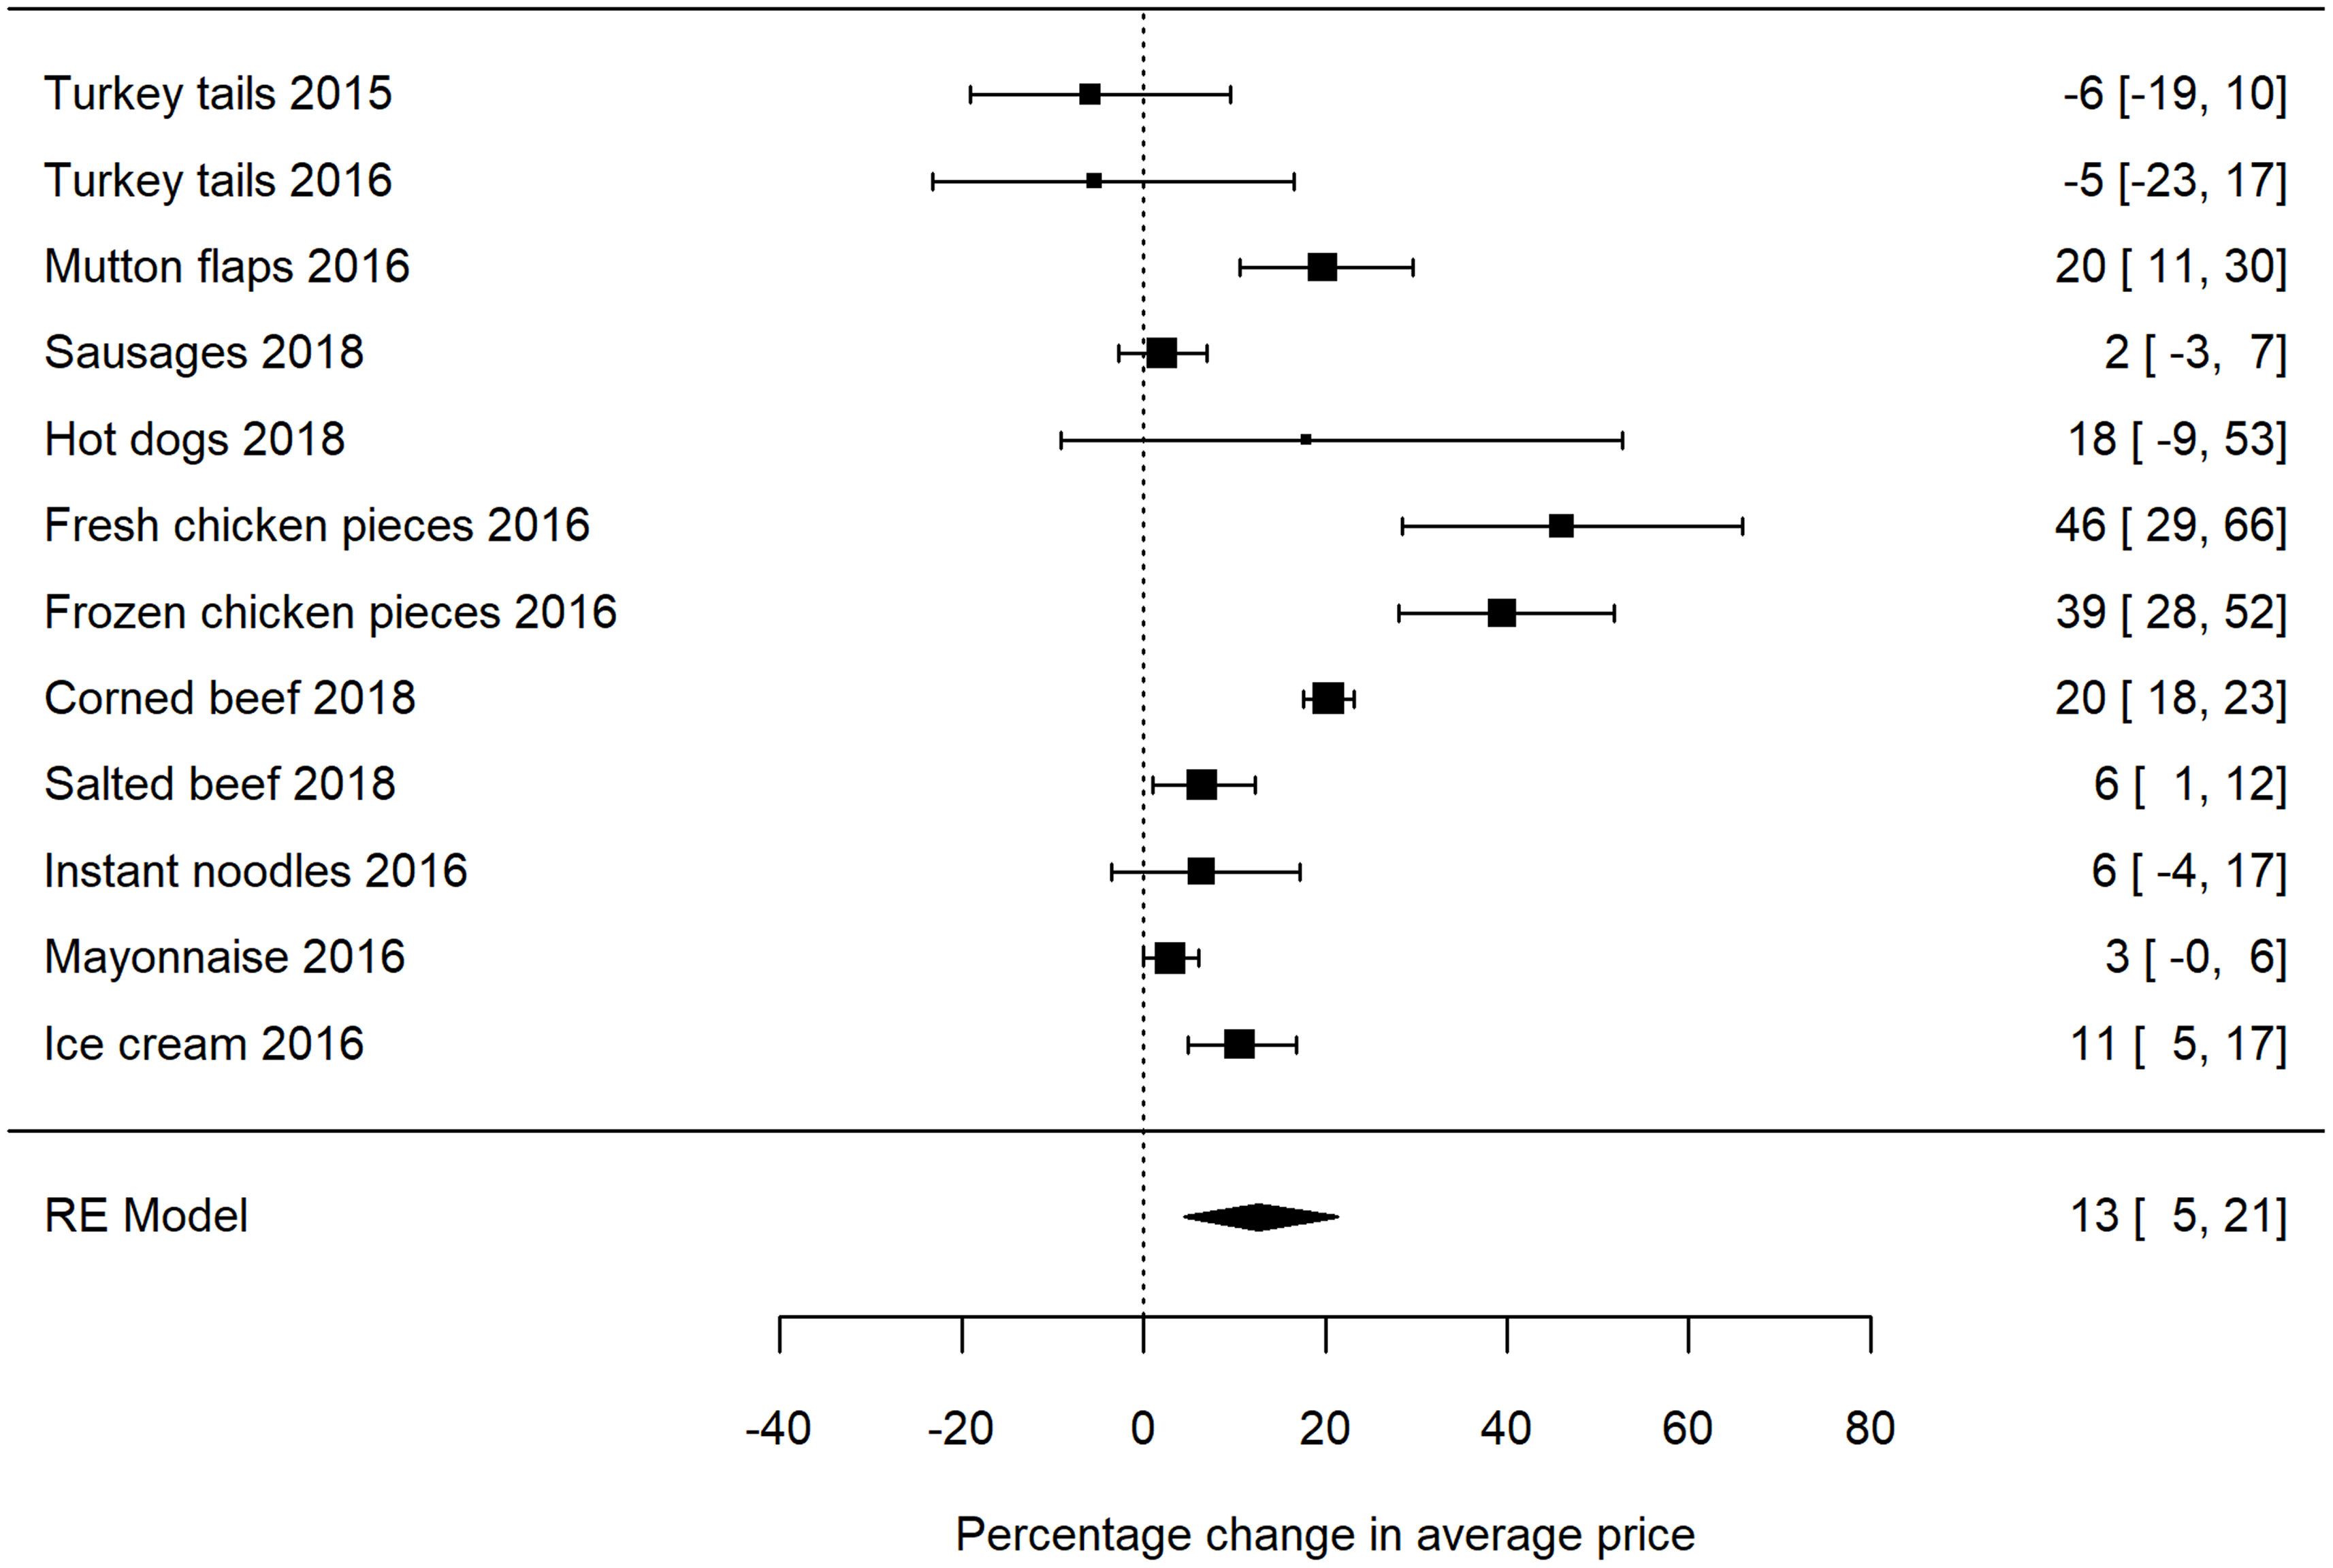
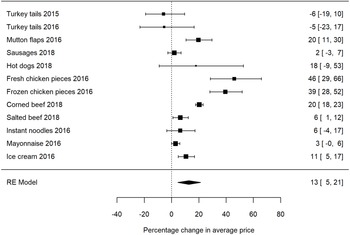
Prices of taxed indicator foods all increased compared to the predicted counterfactual without tax, with turkey tails being the one exception (Table 1, Figure 1, Additional File: Figure A). The largest price increases were T$2·29/kg in the price of corned beef, T$2·12 for mutton flaps and T$1·46/kg for ice cream (all statistically significant increases). The increases in indicator food prices were largest for fresh and frozen chicken pieces (46 % and 39 %), mutton flaps (20 %), corned beef (20 %) and ice cream (11 %), with smaller increases for salted beef (6 %) and mayonnaise (3 %) (all significant). The 18 % increase in the price of hot dogs had a CI of −6 % to 59 %, suggesting a moderate but imprecise effect estimate. Price changes were small and not statistically significant for turkey tails (−6 % in 2015 and −5 % in 2016), sausages (2 %) and instant noodles (6 %). Random effects meta-analysis summarised the price changes across taxed foods and found an overall average 13 % (95 %CI: 5 % to 21 %) increase in taxed indicator food prices, with a high level of heterogeneity (I 2 = 95 %, p < 0·0001).
Forest plot summarising the association between excise tax and taxed food retail prices in the first-year post-tax. Note: Data sourced from Tonga Department of Statistics.
Tax pass-through followed a similar variability with an average pass-through of 68 % across the taxed indicator foods (Table F) and levels ranging from −71 % to 258 %. Under-shifting was most common, but there was significant over-shifting of the taxes on mutton flaps and chicken leg quarters.
Import volumes
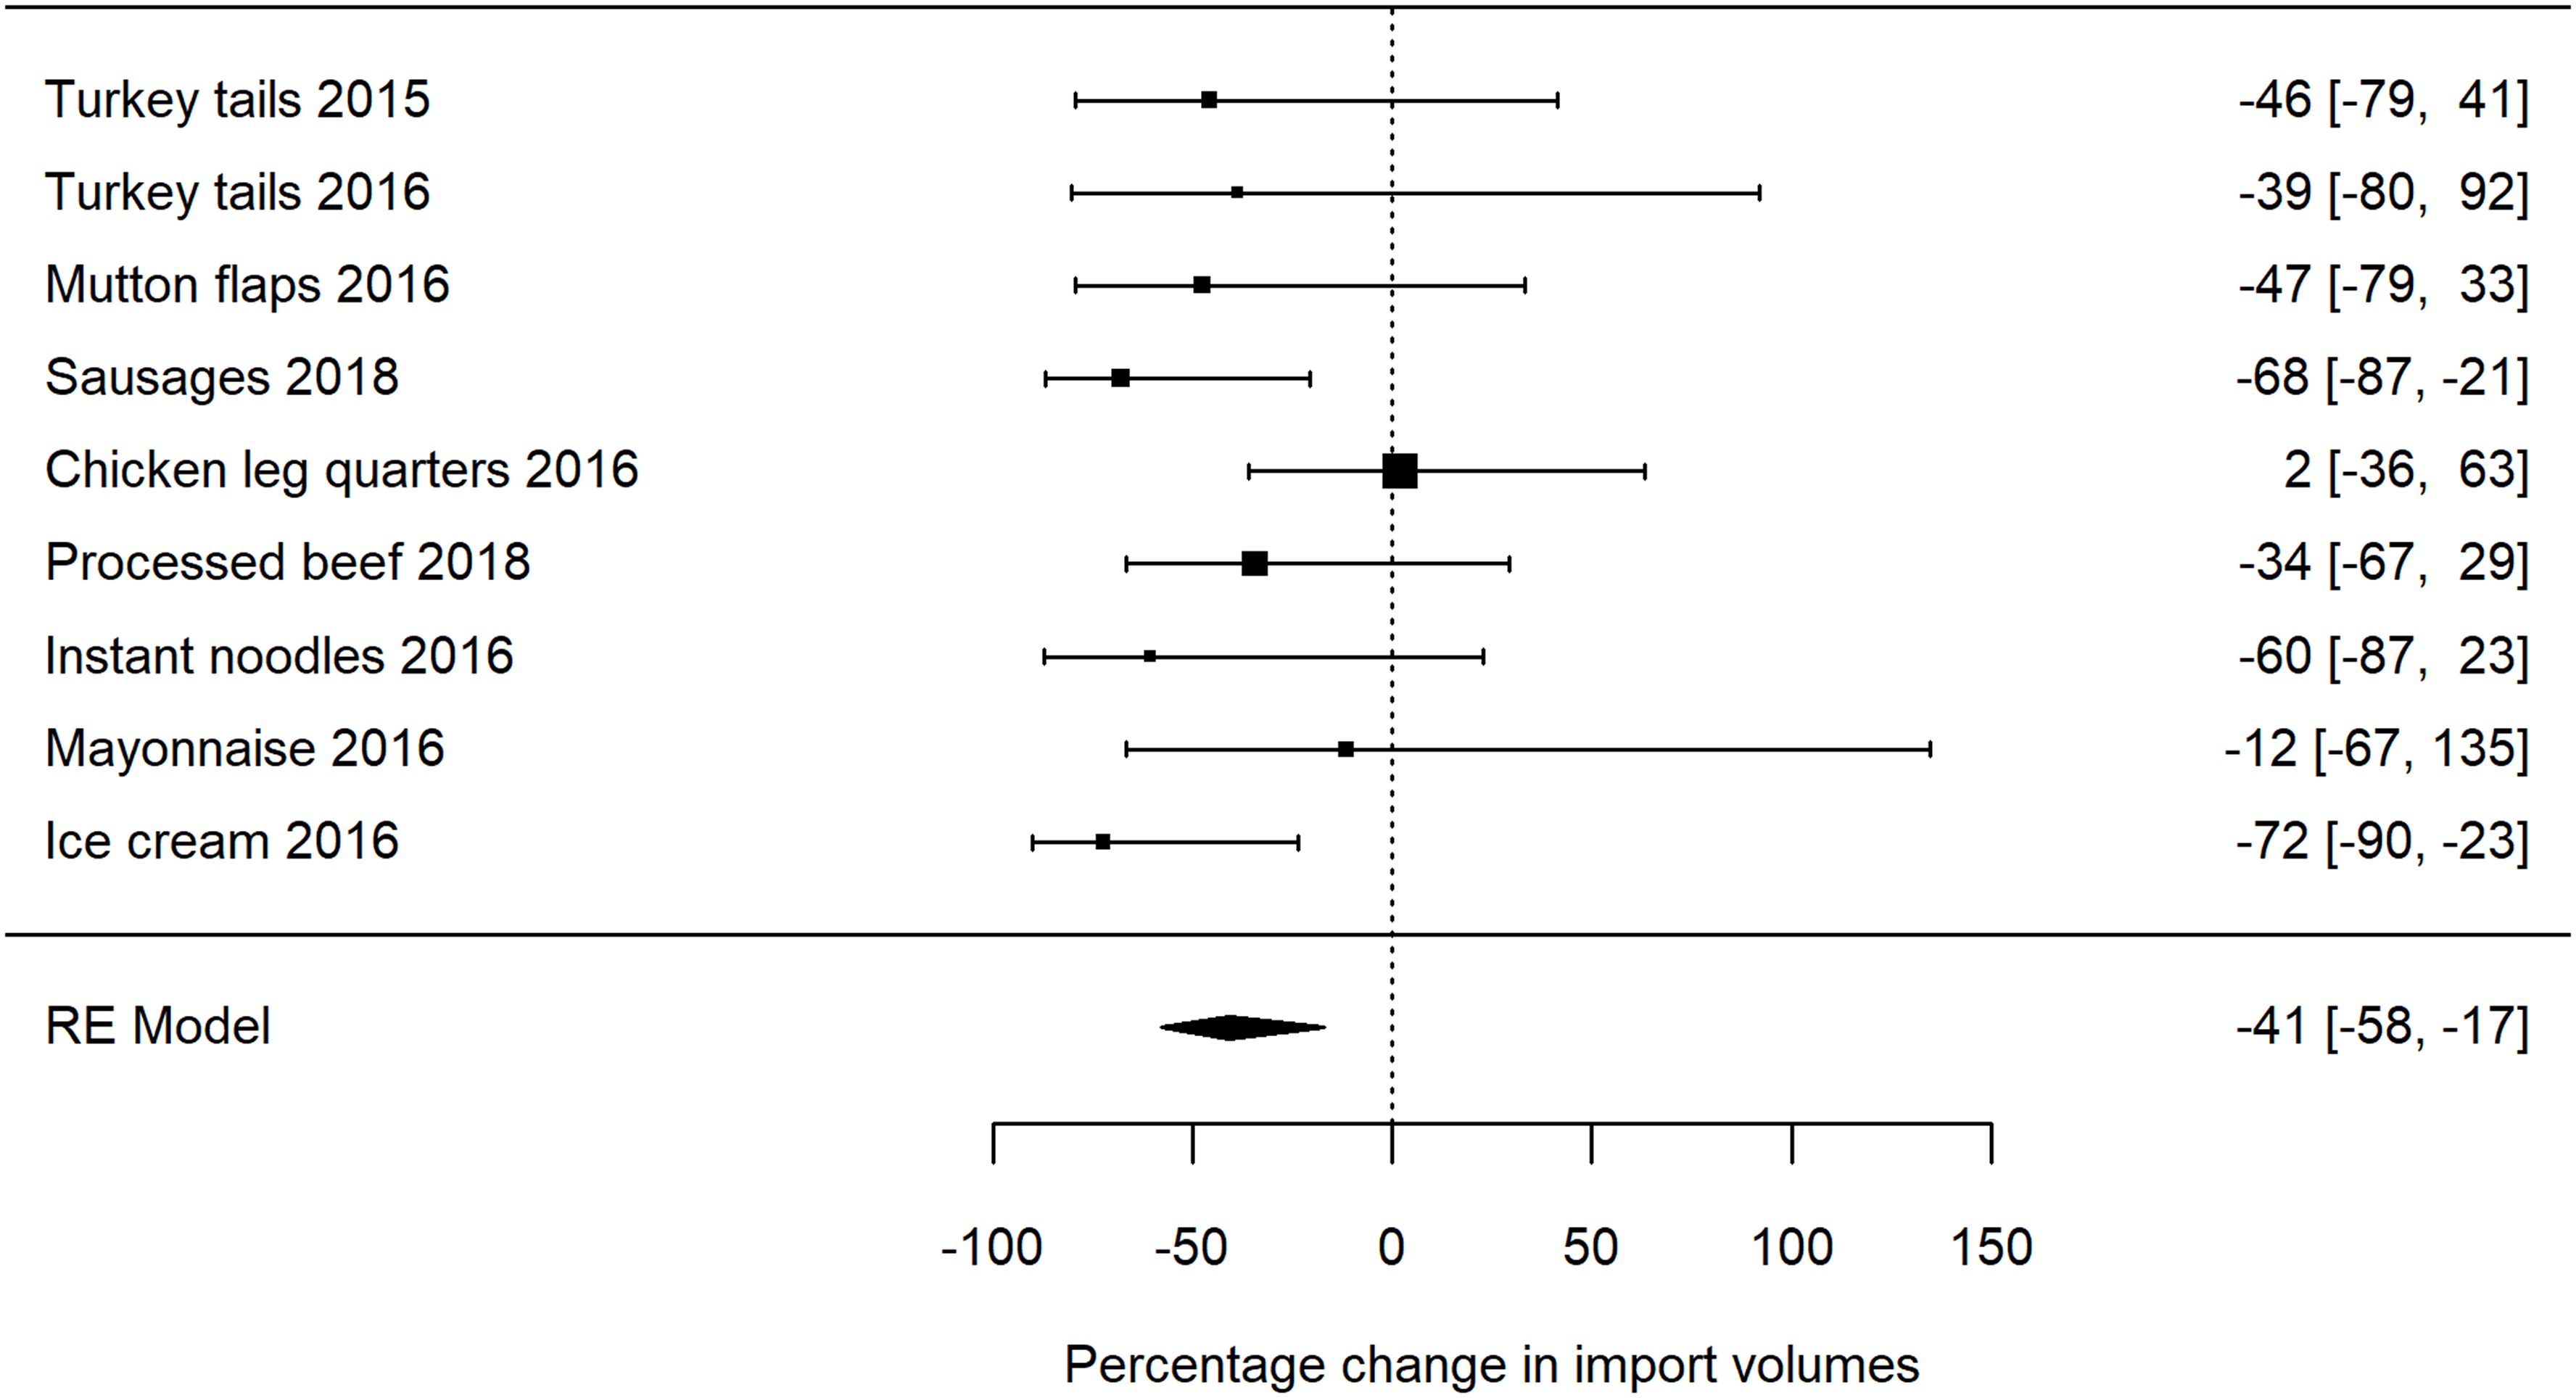
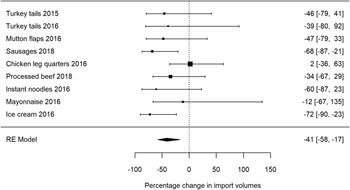
Compared to the counterfactuals, there was a decrease in import volumes (percentage change) after eight of the nine tax increases (Table 1, Figure 2, Additional File: Figure A), with chicken leg quarters the only exception (2 % non-significant increase). The largest decreases in imports were for sausages (−68 %, 95 % CI: −87 to −21 %) and ice cream (−72 % CI: −90 to −23 %). Meta-analysis revealed an average decrease of 41 % (CI: 17 % to 58 %) in import volumes across the nine food tax changes (moderate heterogeneity I 2 = 30 %). For taxes where two years of follow-up were possible, the changes in import volumes were very similar to the changes in the first year (Additional File: Figure B).
Tax elasticities of import volumes varied from 0·1 for chicken leg quarters to −3·1 for mutton flaps, with sausages, instant noodles and turkey tails (in 2015) also at −3·0 (Table 1). The average tax elasticity (calculated from the meta-analysis on import volume changes) was approximately −1·5 (CI: −2·1 to −0·6), which is a 1·5 % average decrease in imports for every 1 % increase in tax (as a proportion of import value) and indicates that import volumes were relatively elastic to tax changes.
Post-tax price increases corresponded to post-tax decreases in import volumes (as a percentage change) for mutton flaps, sausages, processed beef, instant noodles, mayonnaise and ice cream. Chicken leg quarters were a notable exception with large price increases but no evidence of change in import volumes. The pattern for turkey tails also varied, where even though there were increases in tax and decreased imports, the corresponding turkey tail indicator price declined.
Forest plot summarising the association between excise tax and taxed food import volumes in the first-year post-tax. Note: Data sourced from Tonga Ministry of Revenue & Customs.
Local food manufacturing
Of the three excise-taxed foods that were also locally produced in Tonga as well as being imported, only sausages (taxed at half the level of imports) may have had increased local production. The tax revenue collected on locally produced sausages had an increasing post-tax trend, but initially incomplete revenue collection may underestimate early volumes. Excise-taxed locally produced sausages, made up 13 % of the total supply of excise-taxed sausages by volume in the 2019 calendar year. The equivalent level of market share by volume for locally produced ice cream was 2·1 % in 2019 and 0·03 % for instant noodles.
Tax revenue to government
Generally consistent with tax increases, there were large increases in total food tax revenue in the year following each of the tax changes, compared to the year prior. The exception was for instant noodles, which at the same time had a large decline in imported volume (Additional File: Table E). The total revenue increase on imported taxed products was T$6 576 218 (US$2 791 276, or US$28 per resident in Tonga).
Revenue changes, as a percentage of import values, approximated the level of the tax increases with two main exceptions. The revenue increases were more than the tax increases for the 2016 turkey tail excise (99 % revenue v. 59 % tax) and for the 2016 mayonnaise excise (45 % revenue v. 29 % tax).
Sensitivity analyses
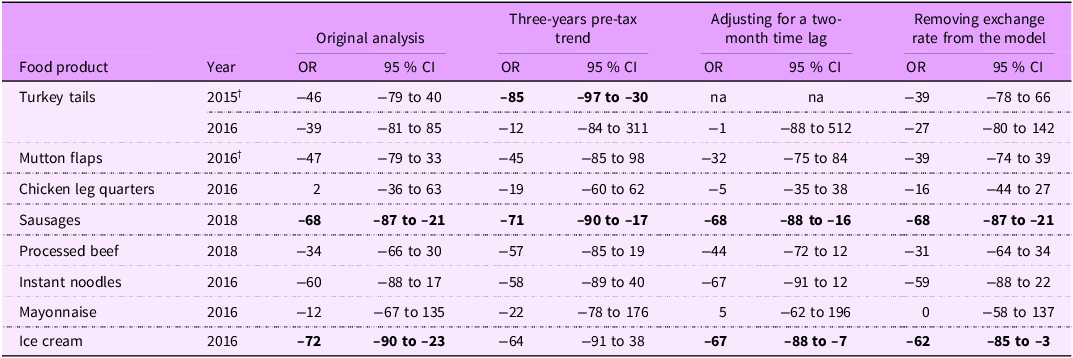
Sensitivity analyses are reported in Table 2 and show a relatively similar pattern of results for a shorter pre-trend timeframe, a two-month transition period for the tax to take effect and removal of exchange rate from the model. Revenue was not collected until September after the July introduction of excise taxes on turkey tails, chicken leg quarters and ice cream in 2016 and processed beef in 2018. The impact of modelling a two-month time lag on the findings for these foods was mixed and did not impact overall study conclusions.
Sensitivity analyses of tax increases on taxed import volumes, for the first-year post-tax, Tonga
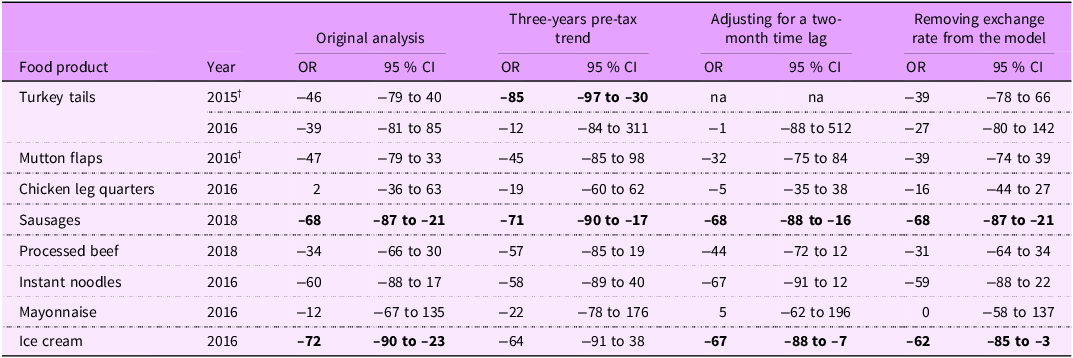
Table 2. Long description
The table presents sensitivity analyses of tax increases on taxed import volumes for the first-year post-tax in Tonga. It includes data for various food products across different years. The columns show the original analysis, a three-year pre-tax trend, adjustments for a two-month time lag, and the impact of removing exchange rates from the model. Each row corresponds to a specific food product and year, with values indicating the odds ratio (OR) and 95 percent confidence interval (CI). Row 1: Turkey tails, 2015†, Original analysis OR -46, 95% CI -79 to 40, Three-years pre-tax trend OR -85, 95% CI -97 to -30, Adjusting for a two-month time lag na, Removing exchange rate from the model OR -39, 95% CI -78 to 66. Row 2: Turkey tails, 2016, Original analysis OR -39, 95% CI -81 to 85, Three-years pre-tax trend OR -12, 95% CI -84 to 311, Adjusting for a two-month time lag OR -1, 95% CI -88 to 512, Removing exchange rate from the model OR -27, 95% CI -80 to 142. Row 3: Mutton flaps, 2016†, Original analysis OR -47, 95% CI -79 to 33, Three-years pre-tax trend OR -45, 95% CI -85 to 98, Adjusting for a two-month time lag OR -32, 95% CI -75 to 84, Removing exchange rate from the model OR -39, 95% CI -74 to 39. Row 4: Chicken leg quarters, 2016, Original analysis OR 2, 95% CI -36 to 63, Three-years pre-tax trend OR -19, 95% CI -60 to 62, Adjusting for a two-month time lag OR -5, 95% CI -35 to 38, Removing exchange rate from the model OR -16, 95% CI -44 to 27. Row 5: Sausages, 2018, Original analysis OR -68, 95% CI -87 to -21, Three-years pre-tax trend OR -71, 95% CI -90 to -17, Adjusting for a two-month time lag OR -68, 95% CI -88 to -16, Removing exchange rate from the model OR -68, 95% CI -87 to -21. Row 6: Processed beef, 2018, Original analysis OR -34, 95% CI -66 to 30, Three-years pre-tax trend OR -57, 95% CI -85 to 19, Adjusting for a two-month time lag OR -44, 95% CI -72 to 12, Removing exchange rate from the model OR -31, 95% CI -64 to 34. Row 7: Instant noodles, 2016, Original analysis OR -60, 95% CI -88 to 17, Three-years pre-tax trend OR -58, 95% CI -89 to 40, Adjusting for a two-month time lag OR -67, 95% CI -91 to 12, Removing exchange rate from the model OR -59, 95% CI -88 to 22. Row 8: Mayonnaise, 2016, Original analysis OR -12, 95% CI -67 to 135, Three-years pre-tax trend OR -22, 95% CI -78 to 176, Adjusting for a two-month time lag OR 5, 95% CI -62 to 196, Removing exchange rate from the model OR 0, 95% CI -58 to 137. Row 9: Ice cream, 2016, Original analysis OR -72, 95% CI -90 to -23, Three-years pre-tax trend OR -64, 95% CI -91 to 38, Adjusting for a two-month time lag OR -67, 95% CI -88 to -7, Removing exchange rate from the model OR -62, 95% CI -85 to -3.
† These were increases in import tariffs, not excise taxes like the other tax changes. GLS segmented linear model adjusted for GDP, month, international visitor numbers, exchange rates and oil prices and autocorrelation effects if relevant.
Untaxed potential substitute foods
Changes in import volumes of untaxed meat (such as chicken, beef, pork and lamb, but not fish) were examined after increased taxes on turkey tails, mutton flaps and chicken leg quarters (July 2016), and sausage and corned beef taxes (July 2018). In 2016, import volumes of untaxed meat increased by 115 % (CI: −17 % to 459 %) consistent with a substitution effect, but in 2018 untaxed meat import volumes decreased by 46 % (CI: −80 % to 46 %, the same time tax was waivered on chicken leg quarters). The corresponding decreases in the price of whole frozen chicken and lamb chops in 2016 may have contributed to the suggested substitution effect.
There was no evidence of any substitution to imported and untaxed types of crisps and snacks, sugar, sauces or other processed foods (including pasta), after taxes were increased on instant noodles, ice cream and mayonnaise in July 2016. This was despite decreases in the price of potential substitute products such as bongos (a type of snack in the crisps and snacks group). Conversely, a significant increase in price of sugar may have contributed to the apparent lack of substitution. (Additional File: Figures C and D)
Discussion
Summary and comparisons with the international literature
Taxed foods
Consistent with basic economic theory, this study found that taxes targeting unhealthy food HFSS in Tonga from 2015 to 2018 were associated with significant increases in taxed food prices and reduced import supply of these foods. Given the almost exclusive supply of these foods by international trade, decreased imports suggest likely reductions in sales and purchasing of taxed foods in Tonga. For example, among taxed foods, only locally produced sausages (taxed at half the level of imports) had a significant market share, reaching 13 % of the total excise-taxed sausage market by volume in 2019.
The average tax level was 28 % of the import value for the foods examined in this study. In response, the average corresponding retail price increases were 13 % (CI: 5 % to 21 %) and the average tax pass-through was 68 %. At the same time, there was a large drop in import volumes averaging 41 % (CI: 17 % to 58 %). Even with the decline in imports, there remained a substantial increase in tax revenue for the Tongan Government in the first year after each tax, totalling T$6 576 218 (US$2 791 276), or T$65 per resident in Tonga.
The average HFSS food tax pass-through in Tonga was equivalent to average pass-through rates for sugar-sweetened beverage taxes reported in the literature, e.g. 67 % and 70 % in meta-analyses(Reference Freeman23,Reference Powell, Marinello and Leider24) , albeit that there was substantial variation, e.g. by study, food type and levels of competition(Reference Campos-Vazquez and Medina-Cortina25), similar to what was seen across food taxes in Tonga.
Some foods appeared to be more responsive to taxation. Tax increases on turkey tails (in 2015, tax elasticity −3·1), mutton flaps (−3·1), sausages (−3·0), processed beef (−2·0), instant noodles (−3·0) and ice cream (−1·5), appeared to be particularly impactful in reducing import supply, although results were only statistically significant for ice cream. The high declines in import volumes (46 %, 47 %, 68 %, 34 %, 60 % and 72 %) were associated with moderate to high tax increases, respectively (15 %, 15 %, 23 %, 17 %, 20 % and 48 %), indicating relatively elastic demand. The corresponding indicator foods all increased in price, at least a little (except for turkey tails), and half were statistically significant increases. It may be that these food groups comprise more ‘luxury’ foods that are therefore more sensitive to price changes than staple foods(Reference Green, Cornelsen and Dangour26,Reference Femenia27) .
There are other reasons the elasticities reported in this study are generally larger than those seen elsewhere(Reference Green, Cornelsen and Dangour26). The tax increases in Tonga were moderate to large compared to elsewhere, and consumers in this middle-income country may be relatively more price sensitive(Reference Green, Cornelsen and Dangour26). The availability and supply of cheaper local food options may have facilitated switching away from imported to locally sourced foods. There also may be a potential ‘Giffen effect’(Reference Jensen and Miller28) whereby taxes on luxury foods result in reduced consumption of more basic foods, due to increased food budget constraints. Budget constraints may help to explain the reduced spending on many imported foods around the time taxes were introduced.
Foods with least sensitive tax elasticities were chicken leg quarters (0·1), mayonnaise (−0·4) and turkey tails (in 2016, −0·7). There were very small changes in price for mayonnaise (3 %) and turkey tails (−5 %) with a low tax pass-through. It is also possible that there is less price sensitivity for low volume condiments like mayonnaise that consumers may typically use sparingly or if the product is complementary to another food like mayonnaise and potatoes in potato salad. The low tax elasticity for chicken leg quarters occurred despite large statistically significant price increases of 39 % and 46 %. Chicken leg quarters are one of the cheapest forms of protein in Tonga and remained a staple in the diet post-tax(6) contributing to the low tax elasticity(Reference Green, Cornelsen and Dangour26). The excise on chicken leg quarters was subsequently reversed in 2018, not least because low-income households continued to purchase them increasing the likely fiscally regressive nature of the tax on this food(6).
A World Bank report(6) gives price elasticities after four of the 2016 Tonga food tax increases: −1·9 for mutton flaps, −1·4 for ice cream (the only two to be statistically significant), −0·4 for chicken leg quarters and −0·4 for instant noodles(6). Our tax elasticity findings for ice cream (−1·5) and chicken leg quarters (0·1) were approximately consistent with this; however, instant noodles (tax elasticity of −3·0) and mutton flaps (−3·1) in our analysis were associated with relatively greater declines in import volumes (likely due to adjustment for pre-existing trends and time-varying factors).
In the Tonga setting, the price signal which discourages purchasing appears to be a major pathway for how food taxes may be working. Taxes may also act via public awareness about which foods are taxed (and why), industry reformulation of foods and increased availability of healthier options. However, public awareness of the existence of the taxes was low in Tonga, and there was limited ability for industry to avoid taxation (e.g. via reformulation) given the nature of the tax design being based on volume of products and Tonga being a small market. The availability of healthier options is considered to remain a major challenge(6), but we note that Tonga has a local seafood industry and relatively low-priced locally produced vegetables and fruits (with home gardens being common).
Substitution
The question of whether consumers switched from taxed imported foods to cheaper and/or other less healthy products is relevant when considering tax policy. There was a suggestion of substitution to untaxed imported meat after the 2016 taxes on mutton flaps, turkey tails and chicken leg quarters. In 2016, there was also an increasing trend in imports of sausages, after the import tariff on sausages was removed. However, there was no evidence of untaxed meat substitution in 2018 when the taxes were broadened to sausages and processed beef, though imports of chicken leg quarters did increase after they were exempted from excise tax in the same legislation change. We found no evidence of substitution to untaxed imported foods like snacks and crisps that also may be HFSS.
Participants in interviews and focus groups for the World Bank study reported switching to substitutes like corned beef and locally manufactured instant noodles and ice cream after the 2016 tax changes(6). This is consistent with the increasing trend in processed beef import volumes from July 2016 (Additional File: Figure A). But we did not identify any large shift to the corresponding locally manufactured products, although we could not rule it out given potentially incomplete revenue collection(6).
The decline in import volumes of untaxed imported foods compared to the counterfactuals in both 2016 and 2018 suggests that consumers may have been obtaining more food from local sources not subject to excise, including purchasing locally grown foods, and growing their own food (e.g. taro, yams, bananas, coconuts and fish). Other locally sourced food includes bread and rolls, and other baked goods. Retail price trends for common locally sourced foods (such as seafood, vegetables and eggs) were mixed (Additional File: Figure E).
Study strengths and limitations
This interrupted time series analysis is a natural experiment design evaluating a food excise tax strategy implemented in Tonga from 2015 to 2018. Advantages of studying these taxes in Tonga are: (i) the relatively high level and breadth of the food taxes; and (ii) as an island nation, the imported food is relatively well-measured as it comes via cargo shipping (no land-border trade). The analysis pieces together historical trade and statistical data to compare pre- and post-tax trends in price and import volumes adjusted for time-varying factors and directly estimates tax pass-through to consumers. Prices and import volumes are proximal outcomes to taxes and so are less prone to errors or bias than more distal outcomes or longer-term outcomes. The research team (which included a Tongan doctor) met with local stakeholders to understand contextual factors that may have influenced study findings. Meta-analysis techniques were used to overcome the limited power in many of the single food analyses and to estimate an overall effect of tax change across food types.
There were still potential limitations with this study that mean that the findings need to be considered alongside imperfect study methods. The import dataset was affected by changes in coding over time and changes in the quality of data entry. This was addressed by using keyword searches, automated checks to ensure consistent units and excluding poor quality data (e.g. confectionery imports). If measurement error remains and occurs randomly, it is likely to have a conservative impact on the reported results. Model specifications can affect results; however, sensitivity analyses were reassuring. Occasionally, counterfactuals were influenced by the most recent data points, e.g. the modelled counterfactual for sausage imports after the 2018 tax was influenced by the upward 2017 to 2018 pre-tax trend, potentially overestimating the decline in imports. To avoid any bias from changing model specifications, we stuck closely to the pre-planned analysis.
This study could not include a concurrent geographical control group, and thus, findings remain susceptible to contemporaneous changes, including tax waivers, price controls, local food promotion, weather shocks, or changes in customs practice. Although we did adjust for several potential time-varying confounders, adjustment may still be incomplete. International food prices were not available for every model. There may have been public promotion of purchasing local food or growing food that promoted a move away from imports. Price controls may have reduced the price changes in some imported goods.
The AVE% calculation of tax level is expected to overestimate tax size as a proportion of retail prices, because the import unit value is lower than retail price. Therefore, the reported tax elasticity may underestimate true effects.
We did not have adequate data with which to assess pre- and post-tax trends in consumption of locally sourced foods and manufacturing. Other research assesses the impact of tax waivers on prices and import volumes(Reference Teng, Kim and Puloka29) and heterogeneity of purchasing outcomes by household income.
Potential implications for food tax policy design
These findings add to the limited international evidence(Reference Batis, Rivera and Popkin10–Reference Smed, Scarborough and Rayner12) that food excise taxes can be effective in raising prices and reducing supply of unhealthy foods in different settings. This may be particularly relevant in this middle-income country where the tax impact has largely occurred via price changes, and tax elasticities appear to be relatively high (−1·5 on average). There was no major shift to other unhealthy imports after these broad-based taxes were introduced, except for the suggested increase in untaxed meat imports when turkey tails, mutton flaps and chicken leg quarters were taxed in 2016.
To improve food tax policies, the scope of included products in excise taxes on food HFSS could be broadened to include a wide range of commonly consumed HFSS and energy-dense food products. In Tonga, for example, this may include processed foods and sugars that are not currently subject to excise taxes.
Inbuilt mechanisms to allow routine annual adjustments for inflation would ensure the real value of the taxes is maintained over time, sustaining their effectiveness in discouraging unhealthy food consumption. Without a shift to such adjustment for inflation, the impact of excise taxes is likely to decline over time in Tonga.
Revenue from excise taxes can be a stable source of government income, useful for investing in health and supporting local food production. A dedicated proportion of the tax revenue could be used to fund the health system, health and equity initiatives and local farmers to increase food production. This could include improving access, availability and affordability of local fruit and vegetables as well as local fish and seafood. The availability and affordability of healthy foods has been cited as a major issue in Tonga(6).
Public awareness campaigns are recommended to inform the population about the rationale and benefits of HFSS food taxes, emphasising their role in improving health outcomes and supporting local food sector development. This could further help to build and sustain public acceptance of fiscal measures.
Finally, tax design refinements could include targeting the levels of fat, salt or sugar in taxed foods, to more precisely address the unhealthiest options. This would incentivise better quality imported food and may motivate reformulation(Reference Scarborough, Adhikari and Harrington30) of locally manufactured products. The sugar-sweetened beverage excise in Tonga for example is levied based on thresholds of sugar content. Nutrient profiling tools, such as that produced for Tonga(Reference Mounsey, Reeve and Thow31), can be used to precisely categorise which foods are taxed and regulated, such as limits on which places foods can be sold, e.g. in schools. Verification requirements on nutrient level policies require resourcing. Similarly, implementation of excise collection from local manufacturers requires resourcing for improved nutrition outcomes, and equal levels of excise taxes on imported and locally manufactured foods would support this.
Conclusion
HFSS food excise taxes in Tonga were associated with increased prices and decreased imports of taxed foods, consistent with basic economic theory. These findings strengthen the limited international evidence that food excise can be effective in raising prices and reducing the supply of unhealthy foods. Tongan analyses extend the number of settings where HFSS taxes have been evaluated and found to have positive effects. These policies are likely to lead to improved population nutrition and a lower burden of non-communicable diseases. Study findings should encourage policymakers to consider adopting and refining HFSS food tax policies.
Supplementary material
For supplementary material accompanying this paper visit https://doi.org/10.1017/S1368980026103553
Acknowledgements
Tonga Ministry of Revenue & Customs provided the trade dataset and expertise. Tonga Department of Statistics provided data on population projections, GDP, international visitor numbers, for differing time periods. Thank you to Dr Si Thu Win Tin (Pacific Community), Dr Viliami Manu (Ministry of Agriculture), Feleti Lynch (Ministry of Revenue & Customs) and Sandra Fifita (Ministry of Trade and Economic Development) for comments on the final draft. Special thanks to Tutulu Finau for assistance with price data, who has sadly passed.
Author contributions
AT led the application for funding, supported by VP, AK and NW. ST and FM extracted the datasets and supported the interpretation of the datasets. AT and AK did the data analysis. AT prepared the tables and figures, and wrote the first draft of the manuscript. AT, VP and NW talked with key stakeholders in Tonga. KF supported dissemination of preliminary results. All authors read, reviewed and edited the manuscript and approved the final version.
Financial support
Marsden Project from Royal Society 23-UOO-157. University of Otago Research Grant 2022. The funder had no role in the design of the study and collection, analysis and interpretation of data and in writing the manuscript.
Competing interests
The authors declare no conflicts of interest.
Ethical standards
Research did not involve human participants; however, ethics approval was awarded by the Tonga National Health Ethics and Research Committee and the University of Otago Human Ethics Committee (D21/406). Research permits approval as given by the Tonga Prime Minister’s Office.


 Open access

