A substantive body of research has established that experiencing various forms of adversity can have a deleterious effect on human physiology across a range of bodily systems, including cardiovascular, neuroendocrine, metabolic, and immune functioning. Important theoretical work has articulated the manner in which an organism achieves stability via brain circuitry mediating continual physiological adjustment to environmental factors, termed allostasis (Ganzel, Morris, & Wethington, Reference Ganzel, Morris and Wethington2010; McEwen, Reference McEwen1998, Reference McEwen2007; Sterling & Eyer, Reference Sterling, Eyer, Fisher and Reason1989). Since its inception in the early 1990s, the term allostatic load (McEwen & Stellar, Reference McEwen and Stellar1993) has been used to represent the incurred, cumulative biological costs of homeostatic responses to stressor exposure across physical, social, and cultural contexts. Allostatic load theories posit that, although accommodations to stressors may serve an adaptive or protective function in the short term, chronic or inefficient activation of stress response systems may contribute to growing biological “wear and tear” that results in the emergence of pathophysiology and subsequent, long-term disease outcomes. The allostatic load construct has been a useful heuristic and shown to predict disease risk in adulthood (Seeman et al., Reference Seeman, Gruenewald, Karlamangla, Sidney, Liu and McEwen2010; Seeman, McEwen, Rowe, & Singer, Reference Seeman, McEwen, Rowe and Singer2001), as well as in children (Evans, Kim, Ting, Tesher, & Shannis, Reference Evans, Kim, Ting, Tesher and Shannis2007). Much work remains, however, to elucidate early life processes that contribute to allostatic load, particularly as they may relate to developmental psychopathology. In this paper, we aspire to advance the literature on allostatic load by examining prospectively assessed contextual stressors in early childhood and their relations to kindergarten children's cumulative adrenocortical activation. We also aim to deepen understanding of these processes by incorporating tests of curvilinear relations between stressors and physiological adaptation.
Curvilinear Theories
Allostatic load theory posits a “cost” of continual biological adaptation to stressors and adversities within the central and peripheral stress response pathways. Implicit in the theory is a positive, monotonic relation between stress exposure and allostatic load and an assumption that stress vulnerability later in life increases linearly as a function of the severity of the stressors experienced earlier in life. Some research, however, has demonstrated that the effects of prior stress do not increase vulnerability in a graded or linear fashion, but rather as a U- or J-shaped, curvilinear function, with the highest levels of vulnerability among those with the lowest and highest level of previous stress exposure. Whereas severe early life stress can inhibit the development of resilience and contributes to vulnerability for disease, moderate exposures are thought to provide sufficient challenge to provoke competence and to increase capacities for coping with subsequent stressors. Thus, although some effects of adversity are universally damaging, under the proper conditions, sustaining manageable life adversity can foster protection and resilience (Seery, Holman, & Silver, Reference Seery, Holman and Silver2010).
Curvilinear associations between stress and mental health
Although not an initial focus of allostatic load theory (McEwen, Reference McEwen1998), more recent elaborations have posited a U-shaped association between stressor exposure and health outcomes (e.g., Ganzel et al., Reference Ganzel, Morris and Wethington2010; Nielsen, Seeman, & Hahn, Reference Nielsen, Seeman and Hahn2007). Rooted in the seminal animal work of Levine (Levine, Reference Levine1957), theoretical constructs such as “psychophysiological toughness” (Dienstbier, Reference Dienstbier1989), “stress inoculation” (Lyons & Parker, Reference Lyons and Parker2007; Lyons, Parker, & Schatzberg, Reference Lyons, Parker and Schatzberg2010), and “steeling” (Rutter, Reference Rutter2006) suggest that limited exposures to stressors can help an organism gain experience and coping strategies (both mental and physiological) that provide advantages in future stressful encounters. It is further proposed that excessive sheltering of individuals from experiences of adversity precludes opportunities to develop long-term adaptive skills and augments risk for later life vulnerability, despite short-term protection (Dienstbier, Reference Dienstbier1989).
Recent research offers provisional support for the claim that moderate exposure to adversity can predict better psychological adaptation later in life. A recent review of evidence for this phenomenon in animal models suggests that brief intermittent exposure to stress promotes the development of physiological arousal regulation and resilience to later life stress (Lyons et al., Reference Lyons, Parker and Schatzberg2010). Recent work in human samples is supportive as well. In a nationally representative sample of 2398 predominantly White adults aged 18–101 years, Seery and colleagues (Reference Seery, Holman and Silver2010) found U-shaped quadratic relations showing that a history of some lifetime adversity (relative to none or a lot) predicted lower levels of distress, functional impairment, and posttraumatic stress disorder symptoms, as well as diminished impact of recent adverse events. In addition, emerging work from Meaney and colleagues investigating Gene × Environment interactions among Singaporean children reveals a V-shaped pattern of association between birth weight and internalizing symptoms. Specifically, allelic variation in genes involved in serotonergic signaling pathways moderated associations between categories of birth weight and parent-reported internalizing symptoms, such that for each of four single nucleotide polymorphisms, birth weight in the optimal third quartile above the midpoint had significantly lower levels of reported internalizing (M. Meany, personal communication, 2011).
Curvilinear associations between stress and physiology
The potential importance of nonlinear relationships between stress and health is also supported by another line of theoretical work. Burgeoning empirical evidence suggests a “differential susceptibility” to environmental conditions among some individuals who manifest an exaggerated sensitivity or “permeability” to both negative and positive environmental conditions (Belsky, Reference Belsky1997; Boyce, Chesney, Alkon, et al., Reference Boyce, Chesney, Alkon, Tschann, Adams and Chesterman1995; Boyce & Ellis, Reference Boyce and Ellis2005; Ellis, Boyce, Belsky, Bakermans-Kranenburg, & van IJzendoorn, Reference Ellis, Boyce, Belsky, Bakermans-Kranenburg and van IJzendoorn2011). Specifically, biological sensitivity to context (BSC) theory suggests that higher levels of physiologic stress reactivity may be maladaptive in the context of midlevel adversity but protective in both exceptionally supportive and exceptionally stressful childhood environments (Boyce, Reference Boyce, Bornstein and Genevro1996, Reference Boyce and Masten2007; Boyce, Chesney, Alkon, et al., Reference Boyce, Chesney, Alkon, Tschann, Adams and Chesterman1995; Boyce & Ellis, Reference Boyce and Ellis2005; Ellis, Essex, & Boyce, Reference Ellis, Essex and Boyce2005). Within this body of work, Boyce and Ellis (Reference Boyce and Ellis2005) argue for the importance of considering U-shaped associations, predicted from evolutionary principles, between the stressful versus supportive character of early rearing environments and the proportion of individuals evincing highly reactive phenotypes. In other words, the nature of contextual experience likely plays a role in shaping the development of children's physiology. Children raised in stimulating and nurturing contexts may disproportionately develop heightened biological sensitivity as a means of maximizing the advantages of resources and opportunities encountered through enhanced engagement and openness to environmental influences. At the same time, children reared in harsh, threatening environments might also develop greater biological sensitivity in order to cope with stressors and challenges through greater vigilance. In contrast, the majority of children, raised in environments that fall within neither of these two extremes, may acquire diminished biological sensitivity, as the environments to which they are exposed are neither highly nurturing nor highly threatening (for the full argument in this regard, see Ellis & Boyce, Reference Ellis and Boyce2011; Ellis et al., Reference Ellis, Boyce, Belsky, Bakermans-Kranenburg and van IJzendoorn2011). Boyce and colleagues thus suggest that high-reactivity phenotypes will be most prevalent in the contexts of low and high adversity exposure. In accordance with this theory, a U-shaped association between adversity and physiologic reactivity could provide for diverging trajectories of subsequent mental health over time. For example, although high reactivity may be adaptive across low and high stress contexts in the short term, as high reactivity becomes established (i.e., canalized), subsequent exposures to adversity over time would predispose the highly reactive individual to disorders of mental health.
Although several lines of research have tested differential susceptibility models by demonstrating interactive effects between contextual stress and reactivity in the prediction of health (e.g., Belsky & Pluess, Reference Belsky and Pluess2009; Boyce, Chesney, Alkon-Leonard, et al., Reference Boyce, Chesney, Alkon-Leonard, Tschann, Adams and Chesterman1995; Obradović, Bush, Stamperdahl, Adler, & Boyce, Reference Obradović, Bush, Stamperdahl, Adler and Boyce2010), limited research has examined such U-shaped associations in ways that will inform measures of allostatic load. However, two recent studies do explore curvilinear effects of environmental stressors on physiologic systems, specifically the hypothalamic–pituitary–adrenocortical (HPA) axis. Gunnar, Frenn, Wewerka, and Van Ryzin (Reference Gunnar, Frenn, Wewerka and Van Ryzin2009) reported that children with moderate levels of early life adversity demonstrated lower cortisol reactivity to laboratory stressors than did children with either low or high levels of adversity, providing some of the first evidence for curvilinear associations between early life stress and HPA axis regulation. A second study, using a sample of young adults, found a curvilinear effect in the opposite direction from that proposed by BSC theory and found in Gunnar et al.'s study. Engert and colleagues (Reference Engert, Efanov, Dedovic, Duchesne, Dagher and Pruessner2010) found evidence for an inverted U-shaped relation between retrospective self-report of levels of maternal care received in childhood and young adults' cortisol stress reactivity, such that stress-induced cortisol levels for low and high maternal care groups were lower than for those in medium-care group. Both studies examine effects on reactivity to laboratory stressors, which may not generalize to daily levels of physiologic load that are more relevant to allostatic load. Nonetheless, the findings from these two studies support further consideration of curvilinear associations between early life stress and HPA axis regulation.
In sum, there is much to be gained from understanding with greater precision the shape of associations between contextual stressors and the biological systems that contribute to allostatic load. The bulk of allostatic load research has assumed a linear association between load and disease, yet there is emerging evidence that associations between stress and disease (Meany, Reference Meany2011; Seery et al., Reference Seery, Holman and Silver2010) and stress and physiology (Engert et al., Reference Engert, Efanov, Dedovic, Duchesne, Dagher and Pruessner2010; Gunnar et al., Reference Gunnar, Frenn, Wewerka and Van Ryzin2009) take a nonlinear form. This limited body of work has shown both U- and inverted-U associations, making it difficult to discern the structure of the pattern of association between early stress exposure and developing physiologic activity. The different findings may be due to large differences in developmental timing of the stressors and the assessment of outcome, or variation in quality and ranges of stressors and adversity in the different samples. Further research is needed to clarify these associations.
Neuroendocrine Regulation as a Marker of Allostatic Load
The specific measures used to determine allostatic load have varied considerably across studies, many of which have relied on available or easily assessed measures rather than obtaining repeated assessments of physiology related directly to specific health outcomes. In addition, the measures often have simply been summed, assuming an additive effect despite the fact that systems may vary in their function and the manner in which they might relate or interact. Although cumulative indices of physiologic markers may be powerful predictors of developmental and health outcomes (McEwen, Reference McEwen2000; McEwen & Seeman, Reference McEwen and Seeman1999; Seeman, Epel, Gruenewald, Karlamangla, & McEwen, Reference Seeman, Epel, Gruenewald, Karlamangla and McEwen2010), they prevent careful consideration of the nuanced manner in which those associations occur. Various biological systems mature at different rates throughout development, and accommodations in one physiologic system can have cascading effects in other systems (McEwen, Reference McEwen2007; Sapolsky, Romero, & Munck, Reference Sapolsky, Romero and Munck2000). These processes are lost by simple aggregation of measures of multiple physiologic systems. The importance of differentiating systems is particularly salient in childhood where much remains to be understood about the way in which physiological systems refine their function and critical periods for those processes. Over time, the functioning of various biological systems may contribute to a combined cumulative “wear and tear” that we call allostatic load, but that maladaptive synchronization may not yet be present in early childhood. Given these issues and the emerging evidence that some links between stress exposures and physiology are curvilinear, we believe that much might be gained from focusing on functional patterns within specific physiological systems relevant to child psychopathology. For example, in this report we utilize a multiday measure of physiologic load in a stress system critical to developmental psychopathology: the HPA system.
The HPA system plays an important role in mammalian stress responses (Gunnar & Vazquez, Reference Gunnar, Vazquez, Cicchetti and Cohen2006; Levine, Reference Levine2005; Sapolsky et al., Reference Sapolsky, Romero and Munck2000; Selye, Reference Selye1950, Reference Selye1956) and is often identified as a key biological mechanism by which chronic stress “gets under the skin” (Hertzman & Boyce, Reference Hertzman and Boyce2010; Miller, Chen, & Zhou, Reference Miller, Chen and Zhou2007). Regulation of the HPA response to stress has been proposed as a vital biological intermediary in the effects of chronic stress on morbidity in general (Cohen, Kesler, & Underwood, Reference Cohen, Kesler, Underwood, Choen, Kessler and Underwood1995) and more specifically on psychiatric disorders such as depression (McEwen, Reference McEwen2000). Cortisol is the human glucocorticoid hormone secreted by the adrenal cortex. It plays a key role in central nervous system activity, contributing to processes of learning, memory, emotion, metabolism, and immune response (Sapolsky et al., Reference Sapolsky, Romero and Munck2000), yet persistent high concentrations of cortisol can damage or functionally alter brain structures (Sapolsky, Reference Sapolsky1994). Cortisol is passively diffused into saliva, where it reflects the level of unbound and biologically active cortisol circulating in the blood.
Researchers have linked individual differences in both basal and reactive cortisol expression to indices of mental health (Gunnar & Vazquez, Reference Gunnar, Vazquez, Cicchetti and Cohen2006). In general, in both clinical and community samples, elevated daily cortisol levels have been associated with internalizing symptoms (Goodyer, Herbert, & Altham, Reference Goodyer, Herbert and Altham1998; Klimes-Dougan, Hastings, Granger, Usher, & Zahn-Waxler, Reference Klimes-Dougan, Hastings, Granger, Usher and Zahn-Waxler2001) including social wariness and symptom severity in kindergarten community samples (Essex, Klein, Cho, & Kalin, Reference Essex, Klein, Cho and Kalin2002; Smider et al., Reference Smider, Essex, Kalin, Buss, Klein and Davidson2002); whereas lower levels of daily cortisol have been associated with externalizing symptoms (Hardie, Moss, Vanyukov, Yao, & Kirillovac, Reference Hardie, Moss, Vanyukov, Yao and Kirillovac2002; King, Barkley, & Barrett, Reference King, Barkley and Barrett1998; McBurnett et al., Reference McBurnett, Lahey, Frick, Risch, Loeber and Hart1991; Moss, Vanyukov, & Martin, Reference Moss, Vanyukov and Martin1995; Oosterlaan, Geurts, Knol, & Sergeant, Reference Oosterlaan, Geurts, Knol and Sergeant2005; Shirtcliff, Granger, Booth, & Johnson, Reference Shirtcliff, Granger, Booth and Johnson2005). In addition, studies examining cortisol changes over a day in childcare or preschool in community samples have linked elevated cortisol to impulsivity, poor effortful control, peer rejection, and aggression (Dettling, Gunnar, & Donzella, Reference Dettling, Gunnar and Donzella1999; Dettling, Parker, Lane, Sebanc, & Gunnar, Reference Dettling, Parker, Lane, Sebanc and Gunnar2000; Gunnar, Sebanc, Tout, Donzella, & van Dulmen, Reference Gunnar, Sebanc, Tout, Donzella and van Dulmen2003), although findings sometimes suggest a more complex picture depending on timing of assessment and contextual factors such as school settings (Gunnar, Tout, de Haan, Pierce, & Stansbury, Reference Gunnar, Tout, de Haan, Pierce and Stansbury1997). Comprehensive understandings of cortisol production view both overactivation (hypercortisolemia) and deficiency in signaling (hypocortisolemia) as potentially detrimental, with both elevations and declines pathogenic, depending upon the disease measured (Miller et al., Reference Miller, Chen and Zhou2007).
Given that cortisol has both promotive and suppressive effects and has demonstrated associations with the development of psychopathology, it may be a perfect indicator for examining curvilinear relations with contextual stressors. Yet there is a paucity of studies testing for curvilinear associations between contextual stressors and cortisol response. Moreover, large, multiethnic sample studies examining multiple days of cortisol response in young children are rare, precluding the ability to test these associations in measures of chronic arousal or testing for subgroup differences in these patterns.
Contextual Stressors, Stress Physiology, and Health
It is well known that a broad array of contextual stressors can contribute to the activation and dysregulation of physiological systems designed to maintain the allostatic balance. The identification of factors contributing to allostatic load is essential for the design of prevention/intervention efforts (Lupien et al., Reference Lupien, Ouellet-Morin, Hupbach, Tu, Buss, Walker, Cicchetti and Cohen2006). Social factors such as socioeconomic status (SES), family adversity, and ethnic minority status are examples of factors that have all been linked to human development and disease disparities.
SES
The SES of adults is associated with increased risk of a number of diseases and higher rates of mortality, whereas the SES of one's parents is a powerful predictor of health during childhood as well as in later life (Adler et al., Reference Adler, Boyce, Chesney, Cohen, Folkman and Kahn1994; Chen, Martin, & Matthews, Reference Chen, Martin and Matthews2006). A variety of mechanisms have been posited for these associations (Adler & Stewart, Reference Adler and Stewart2010), among which psychosocial processes play a major role (American Psychological Association, 2007; Hertzman, Reference Hertzman1999; Marmot, Bosma, Hemingway, Brunner, & Stansfeld, Reference Marmot, Bosma, Hemingway, Brunner and Stansfeld1997). For example, disparities in health can result from differential exposure to acute and chronic stress (American Psychological Association, 2007; Evans & English, Reference Evans and English2002), such as neighborhood violence (Richters & Martinez, Reference Richters and Martinez1993) or family and parenting risk factors (Repetti, Taylor, & Seeman, Reference Repetti, Taylor and Seeman2002). SES and relative social status have been found to predict cumulative biological risk, including measures of cortisol, in adults (Seeman, Epel, et al., Reference Bird, Seeman, Escarce, Basurto-Davila, Finch and Dubowitz2010; Seeman et al., Reference Seeman, Crimmins, Huang, Singer, Bucur and Gruenewald2004; Seeman & McEwen, Reference Seeman and McEwen1996) and children (Lupien, King, Meaney, & McEwen, Reference Lupien, King, Meaney and McEwen2000). More recently, studies have examined effects of SES on changes in physiological reactivity. For example, low family SES has also been shown to predict muted sympathetic reactivity across the year in a sample of 338 kindergarten children (Bush, Adler, & Boyce, Reference Bush, Adler and Boyce2011), but increases in daily cortisol across 2 years within a sample of 50 children 9–18 years old (Chen, Cohen, & Miller, Reference Chen, Cohen and Miller2010). This emerging work provides some of the first evidence demonstrating that low SES can alter biological profiles among children over time, making it an important early factor in childhood origins of allostatic load.
Family adversity
It is important to understand the unique effects of dynamic indices of daily family stressors and adversity, over and above the more structural and static measures of income and education disparity (Obradović, Shaffer, & Masten, in press). Exposure to adverse, stressful events, such as marital conflict, maternal depression, and financial stress, has been linked to various socioemotional behavior problems and cognitive deficits (Boyce, Reference Boyce and Masten2007; Boyce et al., Reference Boyce, Quas, Alkon, Smider, Essex and Kupfer2001; Burchinal, Roberts, Hooper, & Zeisel, Reference Burchinal, Roberts, Hooper and Zeisel2000; Cummings & Davies, Reference Cummings and Davies2002; Essex et al., Reference Essex, Klein, Cho and Kalin2002; Lengua, Bush, Long, Kovacs, & Trancik, Reference Lengua, Bush, Long, Kovacs and Trancik2008; Masten & Shaffer, Reference Masten, Shaffer, Clarke-Stewart and Dunn2006). The link between adversity and adaptive functioning may be mediated by changes in neurobiological sensitivity as a result of early adversity exposure. Indeed, animal models show that variations in early rearing conditions can have long-term effects on stress physiology and related behavior (Gunnar & Vazquez, Reference Gunnar, Vazquez, Cicchetti and Cohen2006). In humans, adversity has also been found to alter the pattern of daily cortisol secretion, such that adversity is associated with both upregulation and downregulation of the HPA axis.
In general, chronic stressors and adversity have been associated with elevated cortisol expression (Evans & English, Reference Evans and English2002; Evans & Kim, Reference Evans and Kim2007; Lupien, King, Meaney, & McEwen, Reference Lupien, King, Meaney and McEwen2001). Maltreated children, especially those who exhibit internalizing symptoms, show elevated basal cortisol levels across the day when compared to nonmaltreated children (Cicchetti & Rogosch, Reference Cicchetti and Rogosch2001; Tarullo & Gunnar, Reference Tarullo and Gunnar2006). Similarly, a meta-analysis (Miller et al., Reference Miller, Chen and Zhou2007) has revealed that exposure to chronic stress in adults was associated with a higher daily volume of cortisol output. In contrast, blunted early morning cortisol and flattened diurnal rhythms have been detected in children raised in Romanian and Russian orphanages (Carlson & Earls, Reference Carlson and Earls1997; Gunnar & Vazquez, Reference Gunnar and Vazquez2001) and in children living in foster homes in the United States (Dozier et al., Reference Dozier, Manni, Gordon, Peloso, Gunnar and Stovall-McClough2006). Moreover, in a recent study of children living in low-income, urban areas of Mexico, exposure to maternal depression was linked to lower baseline cortisol and lower cortisol reactivity in response to cognitive testing (Fernald, Burke, & Gunnar, Reference Fernald, Burke and Gunnar2008). Given the established links between childhood adversity and later health and well-being (Caspi, Harrington, Moffitt, Milne, & Poulton, Reference Caspi, Harrington, Moffitt, Milne and Poulton2006; Felitti et al., Reference Felitti, Anda, Nordenberg, Williamson, Spitz and Edwards1998; Obradović et al., Reference Obradović, Bush, Stamperdahl, Adler and Boyce2010), it is important to further examine how early family context shapes an individual's neurobiological sensitivity as indexed by activity of the HPA axis.
Ethnic minority status
Ethnic minority groups often face discrimination and other social stressors that may make them more vulnerable to disease. Not surprisingly, such groups have been found to have higher allostatic loads. For example, Mexican and African Americans have been found to have higher levels of biological risk or allostatic load in adult samples (Bird et al., Reference Bird, Seeman, Escarce, Basurto-Davila, Finch and Dubowitz2010; Crimmins, Johnston, Hayward, & Seeman, Reference Crimmins, Johnston, Hayward and Seeman2003) and higher daily cortisol levels in adolescent samples (DeSantis et al., Reference DeSantis, Adam, Doane, Mineka, Zinbarg and Craske2007). Work by Geronimus, Hicken, Keene, and Bound (Reference Geronimus, Hicken, Keene and Bound2006) has documented higher allostatic load scores for Blacks, even after adjusting for SES. However, more recent examinations using nationally representative studies that oversample for Blacks and Mexican Americans (e.g., the National Health and Nutrition Exam Survey) have found gradients between SES and biological risk profiles to be similar across ethnic subgroups (Seeman et al., Reference Seeman, Merkin, Crimmins, Koretz, Charette and Karlamangla2008).
SES, family adversity, and ethnic minority status are often correlated, yet each may operate individually and in a unique manner to predict physiologic response. It is important to examine these effects concurrently in diverse samples if we are to unpack the diverse causal processes that likely operate for different individuals.
Present Study
The field of developmental psychopathology places strong emphasis on a multiple levels of analysis approach to understanding the interplay among the biological, psychological, and social–contextual aspects of the development of psychopathology and resilience across the life course (Cicchetti & Toth, Reference Cicchetti and Toth2009). Although examination of the early life origins of allostatic load has potential to meaningfully contribute to this interdisciplinary body of work, the preponderance of allostatic load research focuses exclusively on adult samples, when disease is more prevalent/measureable, and relies on retrospective accounts of early life stress. Physiologic burden arguably begins as these systems are developing, contributing to organismic stress vulnerability and resilience that shapes later trajectories of developmental psychopathology and other disease risk. In addition, allostatic load studies typically use one-time measures of physiology, which precludes examination of stability and change in these associations. In contrast, the current study investigates the nature of the association between contextual stressors and children's developing HPA responses that might contribute to the development of later life allostatic load. We focused our study on longitudinal measures of stress physiology in kindergarten children, because biological embedding processes that subserve the development of stress response systems occur early in life. Because the accumulation of allostatic load is not likely to be confined to clinical populations, and should affect healthy individuals as well (Ganzel et al., Reference Ganzel, Morris and Wethington2010), we examine these associations within a community sample. Toward those aims, this study examined the unique and cumulative effects of a range of contextual stressors, including ethnic minority status, SES, and family adversity on children's daily cortisol activity across the fall and spring of the kindergarten year.
Based on the broad literature addressing contextual risk effects on physiology, we hypothesized negative main effects of ethnic minority status, low SES, and family adversity across fall and spring cortisol levels. It is more important that, in light of stress inoculation and BSC/differential susceptibility theories, we also expected to find evidence for U-shaped curvilinear associations between the continuous variables of SES and adversity on children's cortisol. Given extant literature that suggests that stress physiology may differ with race/ethnicity, we have also examined how the links between contextual disadvantage and activity of HPA axis differ between ethnic minority and White children.
Method
Participants
Participants were a community sample of 338 children (163 females, 175 males) who participated in a larger, longitudinal study of social dominance status, family disadvantage, biological responses to adversity, and child mental and physical health (see Bush, Alkon, Stamperdahl, Obradović, & Boyce, Reference Bush, Alkon, Stamperdahl, Obradović and Boyce2011; for a detailed description of the study, see Obradović et al., Reference Obradović, Bush, Stamperdahl, Adler and Boyce2010). The children in the sample averaged 5.32 years of age at kindergarten entry (SD = 0.32, range = 4.75–6.28). The sample was ethnically diverse, with 19% African American, 11% Asian, 43% European or White, 4% Latino, 22% Multiethnic, and 2% identified as other ethnicity by their caregiver. Eighty-seven percent of primary caregivers who provided information on family and child characteristic were biological mothers, 9% biological fathers, 2.5% adoptive mothers, 0.6% biological grandmothers, and 0.9% “other” relations to the child (all caregivers are heretofore referred to as parents). Family demographic information was not provided by 16 families. Average annual household income ranged from less than $10,000 to greater than $400,000 (M = $60–79,999, Mdn = $80–99,999). Highest level of educational attainment in the household ranged from less than a high school diploma (8 individuals) to advanced degrees (145 individuals), with 75% of households having a member with at least a college degree. This level of income and education is representative of populations in Berkeley and the surrounding communities.
Procedures
Participants were recruited in three waves from 29 kindergarten classrooms within six public schools in the San Francisco Bay Area during the fall of 2003, 2004, and 2005. Schools were selected to represent a variety of sociodemographic and ethnic/racial characteristics of the metropolitan area. Schools were provided with $20 per child enrolled in the study. Data for the current study were collected in the fall (Time 1) and spring (Time 2) during the kindergarten year. Parents' informed consent and children's assent were obtained prior to the start of the data collection, and participants were assured of the confidentiality of their responses. Parent report of family adversity was collected through mailed questionnaires; families were compensated with $50 for each completed time point. This study was approved by the Committee for the Protection of Human Subjects of the University of California, Berkeley, and the Committee on Human Subjects of the University of California, San Francisco.
Measures
Ethnic minority status
Distribution across ethnic and racial groups is unbalanced in our sample, and over one-quarter of participants identified as multiethnic. Thus, to optimize our ability to account for ethnic group membership yet retain the full sample for analyses, two categorical variables were formed based on child ethnicity: White and ethnic minority. However, it is important to note that combining multiple ethnicities into one group should not imply that all members within that group share experiences or conditions (Helms, Jernigan, & Mascher, Reference Helms, Jernigan and Mascher2005) and is only intended to capture some of the explanatory power of the relations of racial or ethnic minority status to contextual stressors and physiologic responses for groups with very limited sample size.
SES
Because assessing the different dimensions of SES allows for understanding how each contributes to an outcome under study, we assessed both family income and education (American Psychological Association, 2007). Parent respondents were asked to provide information on the education level of all adults in the household using a 6-point scale ranging from less than a high school degree to professional or graduate degree. We used the highest education level of any adult in the household. Total household annual income, including all sources, was assessed via parent report on an 11-point scale ranging from less than $10,000 to more than $200,000. SES was calculated as the average of standardized highest household education of adults in the home and standardized total annual household income.
Adversity
Children's exposure to adversity was assessed by six indices of potential sources of family stress. All measures of adversity were based on parent report, and reliability statistics are reported for the current sample.
Financial stress was assessed with four items derived from Essex et al. (Reference Essex, Klein, Cho and Kalin2002) that measured parents' thoughts about money problems, difficulty paying bills, and limited opportunities due to lack of finances (α = 0.81). Parenting overload was assessed with five items derived from Essex et al. (Reference Essex, Klein, Cho and Kalin2002) that measured feelings of being overwhelmed with parenting duties, juggling conflicting obligations, and lacking time to rest or do things the parents want to do (α = 0.79). Marital conflict was assessed using the 10-item O'Leary–Porter Overt Hostility Scale (α = 0.72) that measured how often parents openly argue, display physical and verbal hostility, and criticize each other in the presence of their children (Johnson & O'Leary, Reference Johnson and O'Leary1987; Porter & O'Leary, Reference Porter and O'Leary1980). Negative/anger expressiveness in the family was assessed using both the Family Expressiveness Questionnaire (FAQ; Halberstadt, Reference Halberstadt1986) and the Anger Expression Inventory (AEI; Spielberger, Reference Spielberger1988). The FAQ consists of a 10-item negative dominant subscale (α = 0.83), measuring the frequency of overt anger, contempt, and hostility among family members, and a 10-item negative subdominant subscale (α = 0.75), measuring the frequency of passive sulking, crying, and disappointment among family members. The two FAQ subscales were averaged (r = .55, p < .001) to yield one measure of negative family expressiveness. The total AEI score was calculated using three 8-item subscales that assessed parents' tendency to express overtly toward other people (α = 0.69), hold angry feelings inside (α = 0.68), and control the experience and expression of anger (α = 0.74). The overall scores based on FAQ and AEI were standardized and averaged (r = .48, p < .001) into one indicator of exposure to negative/anger expressiveness. Maternal depression was assessed with a 20-item Center for Epidemiological Studies Depression Scale (Radloff, Reference Radloff1977; α = 0.81). Harsh and restrictive parenting was assessed using a questionnaire version of Child-Rearing Practice Report (Block, Reference Block1965). The 18-item scale (α = 0.83) was based on previous studies (Deković, Janssens, & Gerris, Reference Deković, Janssens and Gerris1991; Rickel & Biasatti, Reference Rickel and Biasatti1982).
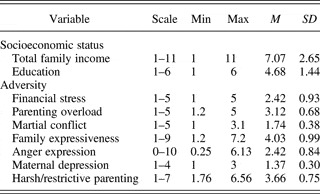
Descriptive statistics for adversity measures are shown in Table 1. As we were interested in capturing children's overall exposure to family adversity, the six indices of adversity were standardized and composited into one adversity index.
Descriptives for continuous predictors, prior to creating composite scores

Chronic basal salivary cortisol secretion
Allostatic load is generally scored by adding the number of indicators exceeding cutoffs of clinically relevant levels of physiologic risk. Yet many of the associations may occur across a continuum, particularly in children, who may not meet “clinical thresholds” for physiological variables. Thus, in the current study we examine continuous measures of cortisol.
For both morning and afternoon kindergarten students, saliva for cortisol assays was collected in school two times per day: in the first and last 20 min of class, at the same time on each of 3 consecutive school days. Repeating cortisol collection across several days improves reliability of the measure (Adam & Kumari, Reference Adam and Kumari2009). Children had not ingested solids or liquids in the 30 min prior to saliva collections. Salivary cortisol levels closely correspond to plasma free cortisol and are reliable across sampling days (Kirschbaum & Hellhammer, Reference Kirschbaum and Hellhammer1994). Samples were collected using cotton rolls that children chewed for 20–30 s and then deposited into salivette tubes (Sarstedt, Nümbrecht, Germany), which were frozen at −7°C until shipped to the University of Dresden for assay. After thawing, samples were mixed and centrifuged 10 min at 2000–3000 × g to remove particulate material. Cortisol was assayed using a commercial immunoassay with chemiluminescence detection (Cortisol Luminescence Immunoassay; IBL-Hamburg, Hamburg, Germany). The detection limit of the assay was 0.41 nmol/l. The mean inter- and intraassay variations were 8.5% and 6.1%, respectively. The cortisol values above 55 nmol/l (<1% of samples) were considered unreliable data and were discarded. Ten children in the fall and 7 children in the spring were taking medications, such as human growth hormone and exogenous glucocorticoids, known to alter salivary cortisol levels (Masharani et al., Reference Masharani, Shiboski, Eisner, Katz, Janson and Granger2005). These children were excluded from analyses.
To normalize cortisol distributions, raw values were log10-transformed. The mean cortisol values and collection times were computed across the six collections, and the area under the curve with respect to ground was calculated using the method described by Pruessner Kirschbaum, Meinlschmid, and Hellhammer (Reference Pruessner, Kirschbaum, Meinlschmid and Hellhammer2003). Finally, the area under the curve was adjusted for class time to control for the circadian patterning of cortisol secretion. The resulting variable indexed children's mean basal level of HPA activation during class time, averaged over 3 school days, and provided a measure of chronic daily HPA arousal.
Data preparation and analysis
Percentages of missing data were as follows: child ethnic minority status (4.7%), income (6.5%), education (4.7%), adversity components (11.8%–13.0%), and cortisol values in fall and spring (9.8%; 14.0%). Missing data for child ethnic minority status was not imputed in order to maintain comparability to the prior literature on racial/ethnic disparities in allostatic load that generally includes only subjects of known race/ethnicity (Krieger, Chen, Ware, & Kaddour, Reference Krieger, Chen, Ware and Kaddour2008) and because the missingness was small. Missing data for the two SES components, the six adversity components, and the 3 days of morning and afternoon cortisol values, were handled using the recommended maximum likelihood estimation procedure for missing data, specifically the expectation–maximization algorithm (Schafer & Graham, Reference Schafer and Graham2002). Hierarchical multiple regression analyses were conducted separately for both fall and spring cortisol. To aid interpretation of results, all variables were standardized prior to entry in the models. All analyses were conducted using the SPSS 17.0 program.
Results
Table 1 presents the means, ranges, and standard deviations for the predictors used in analyses.
Bivariate correlations
Child sex was not related to fall (r = .04, ns) or spring cortisol (r = −.04, ns) and was thus omitted from subsequent analyses. Age at kindergarten entry was not related to fall cortisol (r = −.07, ns) but was modestly related to the spring cortisol (r = −.12, p < .05). Because child age did not emerge as a significant predictor in regression models and did not alter direction or strength of associations between other predictors and outcomes, it was also dropped from the remaining analyses.
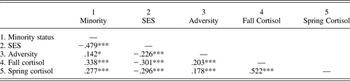
Table 2 presents correlations among variables used in analyses. As anticipated, minority status, SES, and adversity significantly covary in that minority children come from families with lower SES and higher adversity exposure, whereas low SES families on average tend to experience higher levels of adversity. Because cortisol shows significant 6-month longitudinal stability from fall to spring, it is not surprising that associations between minority status, SES, and adversity were consistent for both fall and spring cortisol. Consistent with existing literature, and with moderate effect sizes throughout, ethnic minority status, adversity, and low SES were positively correlated with both fall and spring cortisol.
Correlations among predictors and outcomes

Note: SES, socioeconomic status.
*p < .05. ***p < .001.
Hierarchical linear regression
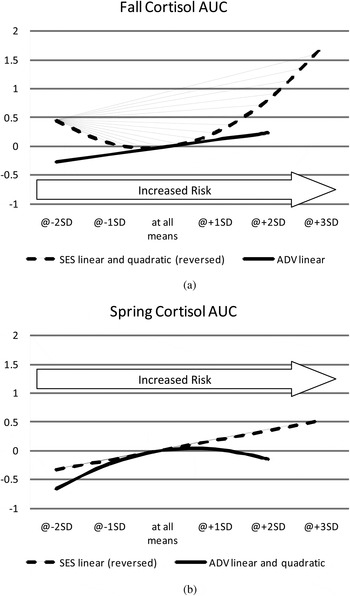
Concurrent and longitudinal relations between environmental sources of disadvantage and activity of HPA axis were examined using linear regression analysis. The nonlinear relations were examined by inclusion of quadratic terms, and for consistency and comparability across models, all quadratic terms were retained in final models, even if they emerged as nonsignificant. The significant linear and curvilinear associations were plotted and to aid comparison between the effects of the two continuous predictors (see Figure 1); SES was reverse coded in these plots so that values of SES and adversity on the right end of the horizontal axis represented higher levels of disadvantage.
Plots of significant linear and curvilinear regression lines for fall and spring cortisol. Regression slopes are plotted for significant beta coefficients in each model, holding all other variables in the model at mean levels, and plotting across the true sample range for each variable. Socioeconomic status (SES) was reversed for this plot in order to aid comparison with the effects of adversity; values at the right of the x axis represent the lowest SES and highest adversity (or greatest risk). AUC, area under the curve.

Fall cortisol
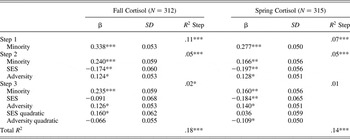
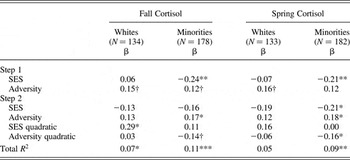
The left side of Table 3 presents the results of the hierarchical regression analyses predicting fall cortisol. Regression analyses indicated that ethnic minority children showed higher levels of cortisol over the kindergarten day, even when adjusted for the effects of SES and adversity. SES was negatively associated with cortisol, such that lower levels of SES predicted higher cortisol levels. However, the relation between SES and fall cortisol appears to be nonlinear as indicated by a significant quadratic term. Higher levels of family adversity linearly predicted higher levels of cortisol. As illustrated in Figure 1a, at both higher and lower levels of SES, children exhibited higher levels of cortisol than did children at or near the mean SES. The nonsignificant quadratic term for adversity suggests that the association between adversity and cortisol is best explained by a linear model. Together, SES and adversity accounted for an additional 5% of the variance in fall cortisol beyond that accounted for by minority status. The full model accounted for 18% of the variance in children's daily cortisol during the fall.
Regression coefficients for prediction of fall and spring cortisol area under the curve

Note: The models use standardized variables. SES, socioeconomic status.
*p < .05. **p < .01. ***p < .001.
Spring cortisol
The right side of Table 3 presents the results of the hierarchical regression analyses predicting spring cortisol. Patterns of association with spring cortisol were largely the same as those found in the fall models. Regression analyses indicated that ethnic minority children showed higher levels of spring cortisol over the kindergarten day, even when SES, adversity, and their quadratic terms were included in the model. SES was negatively associated with cortisol, such that lower levels of SES predicted higher cortisol. In contrast to fall results, the nonsignificant quadratic term for SES suggests that the association between SES and spring cortisol is best explained by a linear function. Although higher levels of family adversity predicted higher spring cortisol, in contrast to fall results, the quadratic term for adversity significantly predicted spring cortisol. As illustrated in Figure 1b, there was a significant curvilinear association between adversity and spring cortisol, such that at both higher and lower levels of adversity, children exhibited lower levels of cortisol than did children at mean levels of adversity. Similar to the fall model, SES and adversity accounted for an additional 5% of the variance in spring cortisol beyond that accounted for by minority status, whereas the full model accounted for 14% of the variance in children's cortisol during the spring.
Regressions examining ethnic/racial differences
Because of the complexity of the models, which included both linear and quadratic terms for two sources of disadvantage, we did not estimate interaction effects between ethnic minority status and SES or adversity. Rather, after examining full sample effects, associations were examined separately for White and ethnic minority children. Because the sample was roughly half White and half minority, this approach allowed straightforward exploration of differences in curvilinear associations by group, with reasonable power to detect effects. Table 4 presents the results of the hierarchical regression analyses split by ethnic minority status.
Regression coefficients for prediction of fall and spring cortisol area under the curve by minority status

Note: The models use standardized variables. SES, socioeconomic status.
†p < .10. *p < .05. **p < .01. ***p < .001.
Fall cortisol
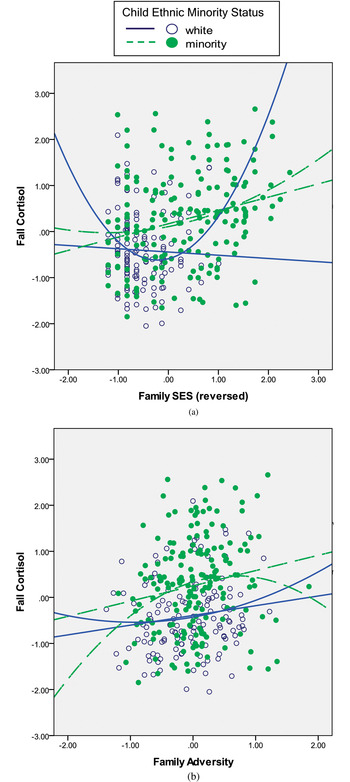
For White children, only the quadratic term for SES significantly predicted fall cortisol. As illustrated in Figure 2, for White children there was a significant curvilinear association between SES and fall cortisol such that at both higher and lower levels of SES, children exhibited higher levels of cortisol than did children at mean levels of SES. The full model accounted for 7% of the variance in fall cortisol for this subgroup. For ethnic minority children, a higher level of SES was associated with lower levels of fall cortisol when only linear effects are examined. With inclusion of quadratic terms, linear effects of SES became marginalized, whereas the linear effect of adversity emerged as significant. In the final model, greater adversity was associated with lower fall cortisol. As illustrated in Figure 2, for ethnic minority children there was a trend toward a significant curvilinear association between adversity and fall cortisol such that at both higher and lower levels of adversity, children exhibited lower levels of cortisol than did children at mean levels of adversity. The full model accounted for 11% of the variance in the model for ethnic minority children.
Bivariate graphs showing linear and curvilinear associations between contextual stressors and fall cortisol by ethnic minority status. See Table 4 for significance levels of plotted linear and curvilinear slopes. Socioeconomic status (SES) was reversed for this plot in order to aid comparison with the effects of adversity; values at the right of the x axis represent the lowest SES and highest adversity (or greatest risk). [A color version of this figure can be viewed online at journals.cambridge.org/dpp]

Spring cortisol
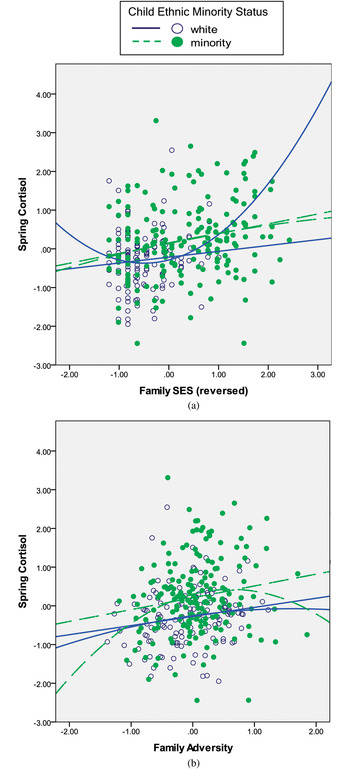
Patterns of association with spring cortisol for ethnic subgroups were similar to those found in the fall models, although levels of significance differed from fall to spring. For White children, no variables emerged as significant predictors of fall cortisol, and consequently, the final model for this subgroup was not significant. For ethnic minority children, higher levels of SES was associated with lower spring cortisol, greater adversity was associated with higher spring cortisol, and the quadratic term for adversity was significant. As illustrated in Figure 3, for ethnic minority children there was a significant curvilinear association between adversity and spring cortisol such that at both higher and lower levels of adversity, children exhibited lower levels of cortisol than did children at mean levels of adversity. The full model accounted for 9% of the variance in this subgroup.
Bivariate graphs showing linear and curvilinear associations between contextual stressors and spring cortisol by ethnic minority status. See Table 4 for significance levels of plotted linear and curvilinear slopes. Socioeconomic status (SES) was reversed for this plot in order to aid comparison with the effects of adversity; values at the right of the x axis represent the lowest SES and highest adversity (or greatest risk). [A color version of this figure can be viewed online at journals.cambridge.org/dpp]

Overall, analyses of the models by ethnic subgroup suggest that contextual factors such as SES and family adversity are stronger predictors of ethnic minority children's cortisol regulation than they are for White children. Further, there is evidence for curvilinear effects of SES on cortisol regulation only for Whites and for curvilinear effects of adversity on cortisol regulation only for ethnic minorities.
Discussion
This study revealed that contextual stressors related to ethnic minority status, SES, and family adversity uniquely predicted kindergarten children's HPA axis regulation across three school days. Half of these associations were curvilinear in conformation. In addition, our results showed that these quadratic, U-shaped influences of family SES and family adversity operated in differing directions and at different points in the school year to predict HPA axis regulation. Results further suggested that these associations diverged for White and ethnic minority children in both magnitude and direction, with SES-related experiences accounting for greater portions of the variance in HPA axis regulation. Taken together, study findings suggest that early childhood experiences of contextual stressors contribute to nonlinear, functional shifts in activity of children's HPA axis, which may constitute an early, emerging signal of allostatic burden.
Consistent with much of the prior research, higher levels of contextual stressors predicted greater HPA axis arousal in the full sample of children. Figure 1, scaled so that higher levels indicate greater risks from both SES and adversity, illustrates linear associations predicting HPA basal activation, with higher adversity and lower SES linked to higher levels of HPA axis arousal. This is the pattern most consistently found in past work, particularly when examining more normative ranges of contextual stress (e.g., Cicchetti & Rogosch, Reference Cicchetti and Rogosch2001; Evans & English, Reference Evans and English2002; Lupien et al., Reference Lupien, King, Meaney and McEwen2000), but is counter to the findings of hypocortisolism in response to stressors found in more extreme samples (Carlson & Earls, Reference Carlson and Earls1997; Dozier et al., Reference Dozier, Manni, Gordon, Peloso, Gunnar and Stovall-McClough2006; Gunnar & Vazquez, Reference Gunnar and Vazquez2001). Differences in the direction of the association found across studies may also depend upon some combination of the severity of the early life stressors, the developmental period assessed, and whether basal or reactive HPA activity is measured.
The study also revealed significant curvilinear associations that warrant consideration alongside linear effects. First, a curvilinear association emerged between SES and fall HPA axis regulation. The higher levels of cortisol found for both low and high SES children may reflect different underlying biological processes. The highest levels of HPA axis arousal in children from the lowest SES families perhaps reflect efforts to cope with the challenges of home life and/or in the setting of school. On the other hand, moderate levels of HPA axis arousal in children from the highest SES families possibly reflect engagement with cognitively challenging, attention demanding tasks, such as those that occur in the school setting. Moderate HPA activation, particularly when facing a controllable challenge, has been found to be adaptive for cognitive performance (Lupien, Maheu, Tu, Fiocco, & Schramek, Reference Lupien, Maheu, Tu, Fiocco and Schramek2007), as well as for classroom self-regulatory and executive functioning (Blair, Granger, & Razza, Reference Blair, Granger and Razza2005; Davis, Bruce, & Gunnar, Reference Davis, Bruce and Gunnar2002).
This J-shaped link between SES and fall cortisol is commensurate with a BSC paradigm, which argues that a curvilinear association between contextual challenge and physiological response may have had fitness value within environments of evolutionary adaptedness (Boyce & Ellis, Reference Boyce and Ellis2005). Within such an interpretation, higher levels of HPA axis arousal would be regarded as adaptive for both low- and high-SES children, albeit for different reasons, such as involving avoidance of or coping with harm in one case or maximizing the advantages of environmental opportunity through increased functioning in the other. As described earlier, we know of only one other study in children that finds evidence for this type of nonlinear effect on HPA axis regulation. Although reactivity to a laboratory stressor was assessed rather than chronic HPA axis arousal, and three groups demonstrating drastically different levels of early life rearing stress were compared rather than a continuous measure of contextual stress in a community sample, Gunnar et al. (Reference Gunnar, Frenn, Wewerka and Van Ryzin2009) found that moderate amounts of early life stress predicted lower cortisol reactivity in children than did low or high levels of early life stress. Additional tests of such curvilinear associations are needed to determine its generalizability and whether a differential susceptibility interpretation of its adaptive potential is merited.
The observed pattern of associations is also consistent with stress inoculation, whereby those who have experienced some, rather than none or a lot of, contextual stress would have the lowest stress responses in challenging situations. Although focused on effects of lifetime adversity on adult health outcomes, rather than physiology, Seery et al. (Reference Seery, Holman and Silver2010) found a similar pattern, reporting that those with a history of some adversity, relative to no or high adversity, demonstrated lower mental health problems. They also found that “moderate adversity” individuals were less negatively affected by recent adverse events than those at the low or high ends of the adversity spectrum. As was true for our data, the curvilinear pattern was not symmetrical, but was J-shaped, such that higher ends of contextual stress predicted the highest level of negative outcomes (HPA arousal in our case, health outcomes in the Seery study). To best determine whether this type of stress inoculation hypothesis fits our data well would require additional measurement of earlier life stress. Taken together, however, findings from the current study and from the stress inoculation literature, as well as the predictions of BSC theory, all point toward the importance of assessing curvilinear associations.
Second, a curvilinear association emerged between adversity and spring HPA axis regulation, which was a shift from the positive linear relation in the fall. In contrast to the U-shaped SES findings, this association is best described by an inverted U-shaped curve, consistent with the findings of several other studies. The lower level of daily spring cortisol for children from families with high levels of adversity could reflect downregulation of the HPA axis. Exposure to an acute stressor may elicit HPA activation resulting in an increase in cortisol output, but if the stressor persists over a longer period of time, the HPA axis' negative-feedback circuit can mount a chronically counterregulatory response, leading to a sustained, lower than normal cortisol output (Gunnar & Quevedo, Reference Gunnar and Quevedo2007). In Engert et al.'s (Reference Engert, Efanov, Dedovic, Duchesne, Dagher and Pruessner2010) study of adults, they also found evidence of an inverted U-shaped association between early life maternal care and HPA axis reactivity, and they propose a similar explanation for the pattern of findings.
Blunted cortisol is thought to reflect physiological toughening or steeling (Dienstbier, Reference Dienstbier1989; Gunnar & Vazquez, Reference Gunnar and Vazquez2001), particularly if an individual cannot remove him or herself from a chronic stressor. Although blunted HPA axis activity has been most consistently documented in high risk samples, such as children in orphanages or foster care (Dozier et al., Reference Dozier, Manni, Gordon, Peloso, Gunnar and Stovall-McClough2006; Gunnar & Vazquez, Reference Gunnar and Vazquez2001), it is possible that downregulation also occurs at lower levels of adversity exposure. This is in contrast to findings with less severe exposures such as cumulative risk, which has been associated with elevated cortisol expression (Evans & English, Reference Evans and English2002; Evans & Kim, Reference Evans and Kim2007; Lupien et al., Reference Lupien, King, Meaney and McEwen2001). In our study, levels of adversity were not so high as those measured in orphanage or foster care studies, yet the repeated measure of HPA activity across the school period may be illustrating circumstances in which blunting can occur in a community sample of children.
Unique effects of minority status, SES, and adversity on children's cortisol levels were found in both fall and spring. These findings highlight the utility of considering both the separate and joint functioning of these variables, rather than assuming that one can be used in place of another. SES is more stable than is family adversity. The former is made up of parental education, which is unlikely to change during a child's development, and household income, which may change (Duncan & Brooks-Gunn, Reference Duncan and Brooks-Gunn2000). In contrast, family adversity as measured in this study is a more concurrent measure, reflecting stressors in the daily lives of children at or close to the time of assessment (Obradović et al., in press). Low-resource environments often expose children to higher levels of stressors (Duncan & Brooks-Gunn, Reference Duncan and Brooks-Gunn1997; Shonkoff & Phillips, Reference Shonkoff and Phillips2000) and are likely to provide less cognitive stimulation than higher SES environments (Duncan & Brooks-Gunn, Reference Duncan and Brooks-Gunn2000). It may be that familial education and income are particularly important in the beginning of the school year, whereas it may take time for family adversity factors to impact daily HPA axis regulation. Such an explanation might apply to the stronger curvilinear effects of SES in the fall and adversity in the spring.
These findings highlight the importance of examining longitudinal associations between contextual stressors and HPA functioning in other ways as well. In the fall, children may find the social context of kindergarten particularly challenging as they forge new peer groups, hierarchies, and connections. By the end of the kindergarten year, those social groups are more stable and predictable, providing fewer social uncertainties. Although this study did not test for associations between HPA activity and children's social functioning, previous research examining these links offers potential explanations for our pattern of findings. Given the literature demonstrating that social threat predicts robust cortisol increases (Dickerson & Kemeny, Reference Dickerson and Kemeny2004) and higher morning and afternoon cortisol (Miller et al., Reference Miller, Chen and Zhou2007), increased levels of cortisol in the fall might be seen as mobilization by the HPA axis to cope with the challenge to social standing at the beginning of the kindergarten year. By the end of school year, however, the activity of the HPA axis may get downregulated as it is no longer needed to manage social uncertainties (Gunnar et al., Reference Gunnar, Tout, de Haan, Pierce and Stansbury1997). Our findings are commensurate with this notion. Although higher SES children in this study showed elevated HPA axis arousal relative to average SES children in the fall, the U-shaped association was no longer present in the spring. Higher SES children actually showed the lowest levels of cortisol relative to average and low SES children in the spring. Our study did not test for change within individual children's cortisol from fall to spring, but findings from a study that measured children's cortisol response during the first weeks of school, and again later in the school year, may provide some explanation for this varied pattern of findings. Gunnar et al. (Reference Gunnar, Tout, de Haan, Pierce and Stansbury1997) found that children who exhibited elevated cortisol expression during the beginning of the school year but normal cortisol levels later in the year were rated as extraverted, socially competent, and outgoing. On the other hand, children who exhibited higher levels of cortisol later in the school year showed more solitary and negative behaviors and were seen as less competent and less outgoing. The associations between SES and social adjustment are well documented (Brooks-Gunn, Duncan, & Britto, Reference Brooks-Gunn, Duncan, Britto, Keating and Hertzman1999; Duncan & Brooks-Gunn, Reference Duncan and Brooks-Gunn1997; McLeod & Shanahan, Reference McLeod and Shanahan1993). Given this, and our finding that higher SES children displayed higher HPA axis arousal in the fall but the lowest levels in the spring, relative to their lower SES peers, it may be that these shifts in longitudinal associations between SES and HPA axis regulation are part of this phenomenon.
The presence of both U-shaped and inverted U-shaped curvilinear associations between contextual stressors and HPA axis regulation in our study presents some interpretative dilemmas. The dearth of previous evidence for either direction of effects, particularly in diverse child samples, precludes the development of strong arguments about this puzzling pattern of findings. However, in an effort to motivate this line of research, we provide some tentative comments about the contrasting curvilinear effects. Given that BSC theory posits that there is an underlying, conditional adaptation-driven association between environmental conditions and activation of stress response systems, it makes sense that the association should manifest itself most clearly in the fall during kindergarten entry and before temperamental, adaptive, and social processes come into play. Thus, in the fall, we would expect to see our predicted U-shaped relation between adversity and HPA activation, such that at both extremes of the contextual stress exposure, children exhibit higher physiological arousal. As the school year proceeds, however, it may be that children's temperaments and social processes play an increasing role in their level of physiological arousal, and the association reverses. Recent data suggests that temperament and peer social experiences predict decreases in cortisol across the preschool year (Tarullo, Mliner, & Gunnar, Reference Tarullo, Mliner and Gunnar2011). That is, highly exuberant children who were high in HPA activation in the fall became low in the spring, whereas highly inhibited children showed increases in cortisol across the school year, and popularity moderated associations such that popular, inhibited children showed the strongest increases in cortisol across the school year. Such findings suggest that unfolding temperamental and social processes during the school year may flip the U-shaped association, resulting in an inverted U pattern in the spring HPA. Again, such an explanation is speculative at this point, and additional research is needed to determine its utility.
Considering the literature demonstrating ethnic group differences in allostatic load, it was expected that some of these associations would differ for Whites compared to ethnic minorities. In the current study minority children appeared to be more strongly affected by SES and adversity than did White children, particularly in the spring of kindergarten. Although this may be due, in part, to higher levels of contextual risk for ethnic minority children, effects of minority status remained robust even when those risks were in the models. Differences may be due to increased stress specifically associated with minority status, such as experiences of differential treatment by others, which may occur through social marginalization in the school setting. As such, this variation in physiological outcomes for minorities, relative to majority population levels, may be a legitimate adaptation to contextual demands, yet it might also reflect unique characteristics that are valuable in their own right for those populations (Garcia-Coll, Akerman, & Cicchetti, Reference Garcia-Coll, Akerman and Cicchetti2000).
The U-shaped association between SES and cortisol was significant for Whites, but not minorities, whereas the inverted U-shaped association between adversity and cortisol was significant for minorities only. One possibility is that these findings represent true differences in associations across these subpopulations, however, it is also possible that ethnic group differences in linear versus curvilinear patterns may be a factor of the somewhat truncated range of SES in our sample of ethnic minorities. If our sample contained more ethnic minority children in upper SES ranges, the curvilinear association between SES and cortisol might have arisen for that subgroup as well. As described earlier, recent studies of nationally representative samples (e.g., the National Health and Nutrition Exam Survey) have found gradients between SES and biological risk profiles to be similar across ethnic subgroups (Seeman et al., Reference Seeman, Merkin, Crimmins, Koretz, Charette and Karlamangla2008), yet other studies have found that ethnic minorities have greater physiologic load (Bird et al., Reference Bird, Seeman, Escarce, Basurto-Davila, Finch and Dubowitz2010; Crimmins et al., Reference Crimmins, Johnston, Hayward and Seeman2003; Geronimus et al., Reference Geronimus, Hicken, Keene and Bound2006). Our study is one of few studies with large enough subsamples of children across the range of SES and adversity to test these associations; thus, further research is needed to determine whether these findings replicate and, if so, to discern the pathway for these potential differences.
Strengths, limitations, and future directions
This study had several unique strengths as well as notable limitations that highlight important directions for future research. The inclusion of a large, ethnically diverse sample of kindergarten children across a range of SES was a strength, allowing for examination of multiple measures of contextual risk across the full sample and within subgroups. Our repeated measure of cortisol in fall and spring of kindergarten allowed for assessment of longitudinal stability of effects and discovery of unique time of year associations. In addition, our 3-day assessment of daily HPA axis regulation provided a more reliable measure of chronic stress arousal than is commonly found in community samples of young children. However, this measure also had some limitations. Although we obtained saliva samples at the beginning and end of the kindergarten day, a stronger measure of daily cortisol would include several time points such as waking, 30–40 min after waking, afternoon, and evening cortisol (Adam & Kumari, Reference Adam and Kumari2009; Kudielka, Broderick, & Kirschbaum, Reference Kudielka, Broderick and Kirschbaum2003; Obradović, in press). Yet, our measures did capture children's HPA axis regulation to the major daily experience of their young lives: the kindergarten class day. In addition, because we adjusted cortisol values for time of day, the findings could not be accounted for by differences in a.m. or p.m. kindergarten or the circadian secretion of cortisol. Another weakness derives from insufficient numbers of children in specific ethnic minority groups. This did not allow us to look at effects that may be limited to some groups but not others. That we found effects despite the somewhat heterogeneous nature of the ethnic minority sample points to the robustness of the associations.
These findings suggest several directions for future research. The models tested here do not allow for determination of whether the levels of cortisol are actually resulting from psychiatric consequences of contextual stress, rather than from the stress itself, such as posttraumatic stress disorder leading to hypocortisolism in adults (Yehuda, Reference Yehuda2000). Next steps include incorporating mental health outcomes in the models to determine the direction of effects and the pathways among stressors, HPA arousal, and symptoms of psychopathology in this developmental period. In addition, because psychological factors such as attention, appraisal, coping, learning, and memory all play crucial roles in physiologic responses to threat, an important endeavor for future research will be to incorporate those factors into models of cortisol during development. Finally, some of our proposed interpretations involve the assumption that each child's HPA axis regulation during the day occurs within comparable kindergarten environments, whereas it is also possible that lower levels of cortisol across the kindergarten day could result from lower levels of stressors in certain classroom environments or lower levels of engagement with the environment for some children. Studies that examine those additional factors will be informative.
Implications and Conclusion
This study presents novel data demonstrating U-shaped curvilinear associations between contextual stressors and endocrine markers of allostatic load in young children, highlighting the potential value of testing for both linear and curvilinear effects in models of contextual stress and biology. Decisions about analyses should depend heavily on theory, some of which suggest possible U-shaped associations. Our results also point toward particular relevance of testing nonlinearity for some subgroups. The findings also support the inclusion of multiple measures of contextual stressors in allostatic load models, and additional research involving a variety of contextual factors is warranted in order to advance understanding of why curvilinear patterns were contrasting for SES and family adversity. Thus, not only is a multiple levels of analysis approach crucial for the determination of developmental processes (Cicchetti & Dawson, Reference Cicchetti and Dawson2002), but even within a broad, social–contextual level, it is important to assess the manner in which a variety of family- and societal-level characteristics of an individual inform models of development.
These results raise questions about the standard practice of averaging physiology scores across a range of systems to create composite measures of allostatic load. Our findings suggest that, at least in childhood, we must first understand the shape of the associations between stressors and responses in each of those systems, or we risk clouding important curvilinear effects by creating linear aggregate scores. Careful consideration of the conceptual and measurement issues in allostatic load may be a precondition for evaluating existing research and for designing methodologically sound future research examining this construct.
The findings provide evidence of changes in HPA axis regulation resulting from contextual stress exposure that begin as early as kindergarten. Childhood (between infancy and adolescence) is thought to be a period of relative hyporesponsivity of the HPA system (Gunnar & Quevedo, Reference Gunnar and Quevedo2007), when children are fairly buffered from stress responses, at least in terms of reactivity to standardized challenges. However, these data suggest that contextual stressors can impact young children's daily HPA axis regulation in meaningful ways, and that these patterns may vary over as short of a period as the school year. This is consistent with other findings in young children linking lower parental SES with muted sympathetic reactivity (Bush et al., Reference Bush, Alkon, Stamperdahl, Obradović and Boyce2011) or inflammatory signaling pathways (Miller & Chen, Reference Miller and Chen2007). Such apparent malleability of biological processes by contextual influences points to the value of integrating biological measures into the design and evaluation of preventative interventions (Cicchetti & Gunnar, Reference Cicchetti and Gunnar2008), with this study suggesting daily cortisol arousal could be useful for detecting effects of interventions. The effects of contextual stressors (or interventions) on development may vary depending on when developmentally, that is, at what age, they are experienced, such as SES during early childhood impacting cognitive development and leading to risky behavior in adolescence (Duncan & Brooks-Gunn, Reference Duncan and Brooks-Gunn2000). Influences of contextual stressors on HPA axis regulation during important developmental periods such as school entry might help explain some of those variations in cognitive, emotional, and behavioral outcomes.