

Introduction
The long-term consequences of prenatal growth on later health outcomes have received much attention during the past few decades.Reference Gluckman, Hanson and Cooper1, Reference Barker, Osmond and Kajantie2 Most studies have focused on the association between birth size and outcomes such as cardiovascular and other chronic diseases in later life, whereas only a few studies have been focusing on psychological and cognitive outcomes in children. Interestingly, intellectual performances and cognitive function have been inversely associated with cardiovascular diseases and all-cause mortality in adults,Reference Batty and Deary3, Reference Kajantie, Räikkönen and Henriksson4 most probably mediated by socio-economic factors.
Studies primarily from developed countries have suggested that a small body size and short gestational age (GA) at birth are associated with lower cognitive function.Reference Shenkin, Starr and Deary5 However, in previous studies, the sample sizes have rather been small or have focused primarily on low birth weight (BW) groups, whereas some larger ones again have included only male children.Reference Broekman, Chan and Chong6–Reference Martorell, Horta and Adair9 On the other hand, the associations found in pre-term and post-term newborns are consistently different from those in term subjects.Reference Shenkin, Starr and Deary5, Reference Bergvall, Iliadou and Johansson8, Reference Martorell, Horta and Adair9 Thus, the effects of body size at birth, for example, low BW and short birth length (BL), could be easily misinterpreted when the whole range of GA is included. Studies conducted on term babies only are needed.
The aim of the present study was to analyse the associations of prenatal growth with cognitive function in Chilean children born at term.
Methods
The Chilean Ministry of Education applies a national assessment called SIMCE (system for measurement of educational quality) to evaluate the level of achievement of students in mathematics, language, social and natural sciences.10 The SIMCE is aligned with the Chilean national curriculum. The overall goal of SIMCE is to obtain information about students’ achievements to improve the quality of education. The present study uses the scores in the language and mathematic tests of all Chilean schoolchildren tested at the fourth grade. The Ministry of Education classifies scores of the SIMCE for language and mathematics in three achievement levels: low, intermediate and advanced, according to specific cut-off points, which are established using a standardized procedure. Those cut-off points for the language SIMCE score were: <241.5 points for low achievement, 241.5–281.5 points for intermediate achievement and ⩾281.5 points for advanced achievement. For the mathematics SIMCE score, the cut-off points were: <233.5 points for low achievement, between 233.5 and 286.5 points for intermediate achievement and ⩾286.5 points for advanced achievement. The test also gathers background information of examinees, including national individual identification number (NIIN), name and gender of the child, location of the school (urban/rural) and type of school management (municipal, private with subsidy and private without subsidy).
This longitudinal cohort study linked results from SIMCE test to a database containing perinatal data on live births obtained from the national registry of births, collected by the National Institute of Statistics and afterwards refined by the Statistics Unit of the Ministry of Health in Chile.11 The matching of the two sources of information for each child was done using the unique NIIN assigned at birth to every Chilean child.
Chile has instituted various policies and practices that almost eliminated non-registration of live births and infant deaths. For example, in the year 2000, 99.8% of all live births had deliveries attended by professionals and 99.0% took place in maternity hospitals.11 All public and private hospitals in Chile are required to file a delivery certificate that is registered with the Civil Registry Service, generally located within maternity hospitals, thus facilitating immediate registration of births. In addition, recording of births is encouraged by the monetary and social incentives of the social security system. Thus, the number of unregistered births is likely to be very small or almost non-existent.
Primary education is mandatory in Chile and the social and economic incentives for enrolment make it compulsory;10 however, there are no specific studies on the proportion of birth cohorts actually attending school. All Chilean children participating in the fourth grade SIMCE in 2006 were included in the study.
The criteria for inclusion in the final study population were chronologically the following: the children took the SIMCE test in 2006 and could be linked using the NIIN at the SIMCE database to the NIIN registered at birth. After that, programmed exclusions were: (a) children having missing information on parity and maternal age or education; (b) pre-term (GA < 37 weeks) and post-term (GA > 41 weeks) deliveries, children aged <8 or >11 years at the time of the SIMCE testing and mothers aged <11 or >50 years when giving birth; (c) BL < 18 cm and/or BW < 500 g; and (d) children who did not have information on language or on mathematics scores.
Selected perinatal variables were BW, BL and GA at birth, which represented foetal development; other variables included in the National Registry at birth were parity, maternal age and maternal education. Perinatal information from the National Registry in Chile is considered highly reliable.11, Reference Mardones, Marshall and Viviani12 Around 250,000 newborns are registered every year. BW and BL are measured at maternity hospitals immediately after delivery, using standard procedures by trained personnel.Reference Mardones, Villarroel and Karzulovic13, Reference Mardones, Urrutia and Villarroel14 Infants are weighed on an electronic self-calibrating scale immediately after delivery generally using either a Tanita 1583 electronic scale (Tanita Corporation, Arlington Heights, IL, USA) accurate to 10 g, or a Seca 345 electronic scale accurate to 20 g (Secacorp, Hamburg, Germany). Crown–heel length is measured on a custom-made neonatometer to the nearest 1 mm. GA is estimated by the date of the last menstrual period and, for uncertain dates, an early ultrasound test allows for correction, generally using either a Voluson 730 PRO (GE Healthcare, Chalfont St. Giles, UK) or an Acuson 120XP (Acuson Inc., Mountain view, CA, USA).Reference Mardones, Villarroel and Karzulovic13
Ultrasound is available for most pregnant women before 20 weeks of gestation in Chile; when the latter is not performed because of a late pregnancy check-up, a postnatal clinical examination of the newborn conducted by the physician-in-charge is used to estimate the GA at birth.
Maternal education, type of school and location of school were used as indicators of socio-economic status (SES); these three variables are known to be associated with SES in Chile.Reference Vegas and Petrow15–Reference Puffer and Serrano17 They were used as potential confounders, given the known strong association of SES with cognitive performance.Reference Räikkönen, Forsén and Henriksson18 In addition, the following biological variables were selected as potential confounders: gender, parity, maternal age at birth and age of children at the time of examination.Reference Thomson and Barron19
Mean values and standard deviation or standard error of the mean (s.d. or s.e.m.) were calculated. Linear regression models permitted to assess the effects of BW, BL and GA, on the language and mathematics scores without adjustments. Residual analysis of the linear models was performed to test homogeneity of the variances and the possible need to incorporate non-linear terms.Reference Hocking20 Analysis of covariance (ANCOVA) was also performed to ascertain effects of BW, BL and GA on both tests with adjustments for gender, maternal education, maternal age at child birth, age of children at the time of examination, GA (37–41 week), type of school (private or public), birth order and location of school. All these variables have been previously considered as confounders potentially influencing school achievements.Reference Broekman, Chan and Chong6 Their differences and the strength of the association were tested using t-values calculated with a t-test provided by ANCOVA (mean/s.e.m.). Statistical differences between dichotomic categories of BW and BL were similarly tested.
The statistical program R 2.12 was used for residual analysis and SAS version 9.1 was used for all other statistical analyses.
Approval by the Ethical Committee of the School of Medicine, Pontificia Universidad Católica de Chile, was obtained, without the need to include informed consent from parents or tutors. The anonymity of the children was observed during the whole study. The NIIN served only for the anonymous linking in the computational database and not for any other purpose.
Results
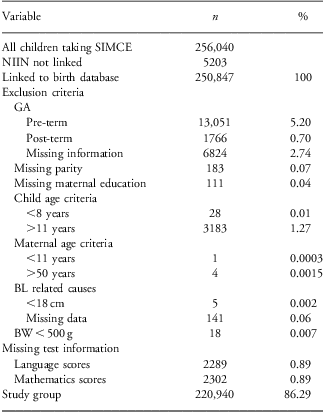
A total of 256,040 children took the SIMCE test in 2006, representing 95% of the total number of children attending fourth grade at school that year.10Table 1 shows the proportions included and excluded as described in the ‘Methods’ section. There were 5203 children who could not be linked using the SIMCE NIIN to the NIIN registered at birth and they were excluded. Mean values of language and mathematics scores in the excluded group were 248.8 ± 55.6 and 241.6 ± 57.9, respectively, being significantly lower than the observed values in the study group (P < 0.0001 for both tests). Another 4591 children who did not have information on language or on mathematics scores were excluded. Mean values of BW, BL and GA in this excluded group were: 3409 ± 448 g, 49.84 ± 1.95 cm and 39.13 ± 1.06 weeks, respectively, and did not differ significantly from the study population of 220,940 children.
Exclusion criteria applied to 256,040 Chilean children attending fourth grade and taking SIMCE in 2006 (equivalent to 95% out of a total estimated of 269,500)
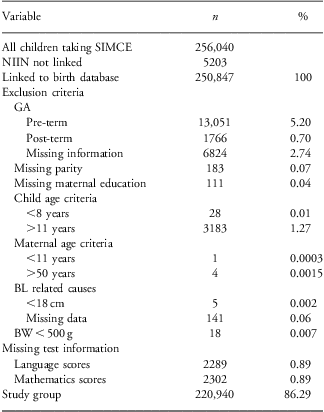
SIMCE, system for measurement of educational quality; NIIN, national individual identification number; GA, gestational age; BL, birth length; BW, birth weight.
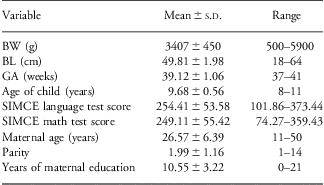
Table 2 presents mean values of some study characteristics. The distribution of a group of selected variables is presented here: 50.6% of the study population were male; 16.4% had a BW < 3000 g, whereas 41.8% had a BL < 50 cm; the majority of children had mothers with 9–12 years of education (52.9%); 28.0% of the mothers had shorter than 9 years of education, whereas 19.1% had mothers with education lasting >12 years; the vast majority of children were first or second born (73.7%); most of their mothers were 20–34 years old at childbirth (72.3%); and 15% of them were <20 years, whereas 12.7% were over 35 years old. Only 6.5% of children attended private schools; most schools were located in urban areas (87.9%).
Characteristics of 220,940 Chilean children born at term participating in the study
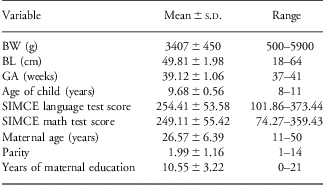
BW, birth weight; BL, birth length; GA, gestational age; SIMCE, system for measurement of educational quality.
Values are mean ± s.d. of study variables.
The association between language and mathematics scores reached an r 2 value of 0.578, suggesting that they share about 60% of the common variance.
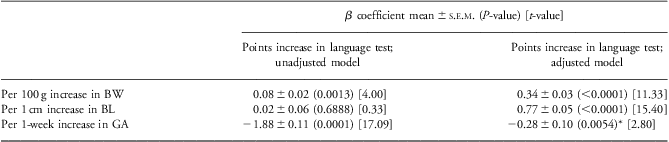
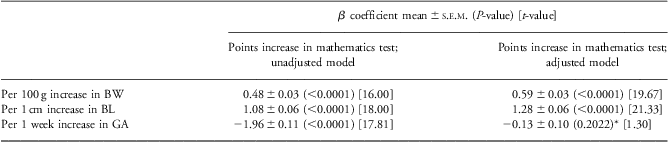
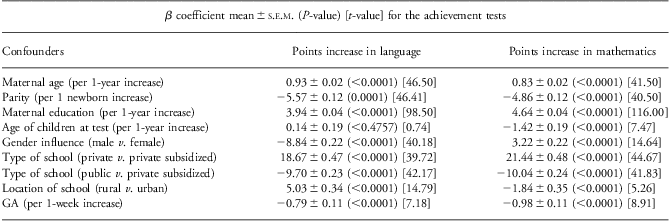
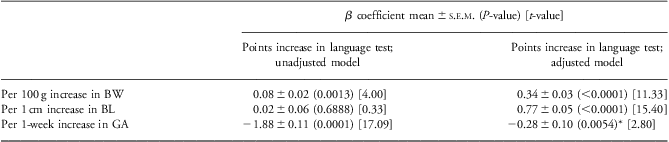
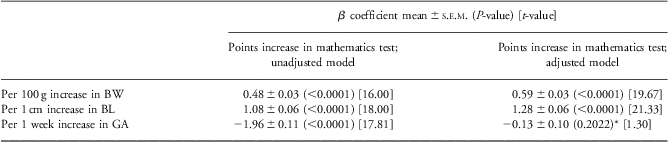
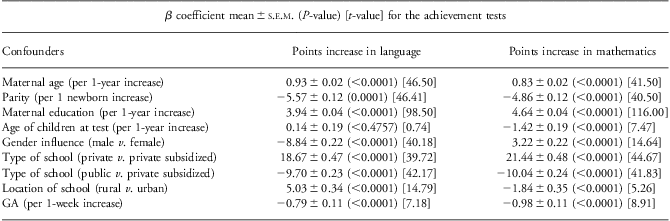
Tables 3 and 4 present results from the adjusted and unadjusted multivariate analyses, showing that BW and BL were both positively associated with the test scores. Adjusted β coefficients for BL were 1.28 and 0.77 for mathematics and language, respectively; for BW, they were 0.59 and 0.34, respectively. GA showed a negative association in the unadjusted models; however, in the adjusted models, the GA became small for language and not significant for mathematics. Table 5 shows adjusted β coefficients for the confounders in the case of the BL model for language and mathematics. These were generally much higher than those for the perinatal factors presented in Tables 3 and 4; values of confounders in the BW model for language and mathematics were similar and are not presented.
Linear regression models showing relationship of BW, BL and GA with achievement in language test: unadjusted and adjusted for gender, maternal education, maternal age at childbirth, age of children at the time of examination, GA (37–41 weeks), type of school (private, private subsidized or public), birth order and location of school
BW, birth weight; BL, birth length; GA, gestational age.
Data from 220,940 Chilean children born at term.
*Not adjusted for GA.
Linear regression models showing relationship of BW, BL and GA with achievement in mathematics test: unadjusted and adjusted for gender, maternal education, maternal age at childbirth, age of children at the time of examination, GA (37–41 weeks), type of school (private, private subsidized or public), birth order and location of school
BW, birth weight; BL, birth length; GA, gestational age.
Data from 220,940 Chilean children born at term.
*Not adjusted for GA.
Multiple linear regression model of BL for language and mathematics scores: values of all confoundersFootnote *
BL, birth length; GA, gestational age.
Data from 220,940 Chilean children born at term.
* All β coefficients were adjusted for: gender, maternal education, maternal age at childbirth, age of children at the time of examination, GA (37–41 weeks), type of school (private or public), birth order and location of school.
The strength of the association, as estimated throughout the t-values, in the case of BW and BL was greater in the adjusted v. the unadjusted models, and in the case of GA it was greater in the unadjusted models (Tables 3 and 4). The strength of the association in the case of the confounders, similarly estimated and presented in Table 5, had generally greater values than for BW and BL in Tables 3 and 4; GA also showed here a negative influence on the scores.
The findings were also tested for non-linearity, but there was no sign of this.
Table 6 presents comparisons of adjusted mean values for the language and mathematics tests when the total population is dichotomized in two sub-samples using different BW and BL cut-off points. All comparisons showed highly significant adjusted differences in the mean scores.
Comparison of adjusted mean differences for language and mathematics tests in dichotomic groups of children with different BW and BL valuesFootnote *

BW, birth weight; BL, birth length; GA, gestational age.
Data from 220,940 Chilean children born at term, 2006.
* All mean differences were adjusted for: gender, maternal education, maternal age at childbirth, age of children at the time of examination, GA (37–41 weeks), type of school (private or public), birth order and location of school.
Discussion
This is one of the largest available studies of contemporary children, focusing upon prenatal growth and cognitive function. Positive associations between both BW and BL and school achievement were observed. As discussed below, despite the fact that the overall effects were at the most modest, these associations were stronger than in many similar studies conducted in developed countries.Reference Shenkin, Starr and Deary5–Reference Bergvall, Iliadou and Johansson8 Lower maternal education, public schools and rurality had a negative influence in the SIMCE scores, the latter just for mathematics scores. These three variables are known to be associated with lower SES in Chile, leading to lower health and cognition indexes.Reference Mardones, Velasco and Rozwski16, Reference Puffer and Serrano17 The previously mentioned variables were rigorously measured, in a standardized fashion by health or education trained personnel. More subjective answers, more dependent on the interest to answer a specific questionnaire and also subject to memory bias, such as family income, were not considered in this study. Though a specific SES assessment score was not used in this study, the above-mentioned confounders are known to negatively influence both prenatal growth and cognitive function.Reference Martorell, Horta and Adair9, Reference Vegas and Petrow15, Reference Räikkönen, Forsén and Henriksson18
The type of school that the child attends did estimate SES (Table 5). Only 7% of Chilean children attend private schools and they belong to high socio-economic families who can afford paying its high cost; children attending private subsidized schools pay a much lower amount, whereas those attending public schools do not pay.Reference Paredes and Pinto21
This study did find better language scores for children attending rural schools, a fact that has been also recently observed regarding some health estimates in rural population from Chile.22 However, language scores were slightly worse in children attending rural schools.
Regarding ethnicity, Chile is a quite homogenous population: the national survey of social factors that is conducted every 3 years found that 6.9% of Chilean population self-reported as belonging to the national aborigine population, mainly from the Mapuche ethnic group.23 Of the 12% of the population, 6.9% are bilingual, speaking in Spanish and the aboriginal language. The coverage of primary school education for aborigine population is 94.2% and Spanish is the primary language used in Chilean schools. In summary, Spanish is the first language for the vast majority of the examinees.
The most important negative effects of the biological confounders on the test scores that may also have a social effect were: parity and gender, the latter only for language scores. Maternal age was the only biological confounder with a positive effect on test scores.
One strength of the present study was that it included both male and female children, whereas two previous studies included only male children.Reference Eide, Oyen and Skjaerven7, Reference Bergvall, Iliadou and Johansson8 Other major strengths of the study include its population-based design and the low proportion of excluded cases. The number of children excluded for not matching NIIN and for not presenting SIMCE scores was rather small. NIIN registration most probably failed during the SIMCE test owing to wrong information provided by the socio-economically disadvantaged parents. Even though those non-linked children were socio-economically different representing a biased group, its sample size was so small that it probably had a very marginal effect on the results. Children who did not have language or mathematics scores most probably lacked part of the information because they decided or needed to stay out of school during the specific test. Although the latter entire group apparently is not different on the perinatal variables, this may be another reason for bias. However, this sample size was also small and should not have any effect on the results.
The final study group of 220,940 children showed similar mean values and frequency distributions in their biological and social variables as previously reported at the national level.Reference Mardones, Marshall and Viviani12, Reference Mardones, Villarroel and Karzulovic13, Reference González, Gómez and Castro24 Exclusion of pre-term and post-term deliveries permitted a better assessment of BW and BL associations. In addition to the well-known fact that those cases could present pathologies that may confuse the association between growth and school achievements,Reference Eide, Oyen and Skjaerven7, Reference Bergvall, Iliadou and Johansson8, Reference Mardones, Villarroel and Karzulovic13 those groups of newborns have in previous studies shown different associations between cognitive scores and BW/BL, impeding the assessment of linear growth effects.Reference Shenkin, Starr and Deary5, Reference Eide, Oyen and Skjaerven7, Reference Bergvall, Iliadou and Johansson8 Regarding the SIMCE scores used in this study, a recent publication from the World Bank has pointed out that testing methodologies, despite their limitations, are the best available indicators of performance, and has also documented that the SIMCE test is among the best measurements of student learning available in the Latin American Region.Reference Vegas and Petrow15
GA had a weak and inverse influence on the test scores (Tables 3–5), suggesting that a longer gestation may negatively affect foetal growth. This has been reported in short women who present a maternal constraint to their offspring.Reference Overpeck, Hediger and Zhang25 Short stature is a feature of Chilean women with a mean height of 158 cm.26 Lower BW and BL in short women would induce a negative association of GA with the scores. Unfortunately, we do not have data on maternal height.
The associations observed in the test scores lead us to conclude that there is a relationship between school performance and both BW and BL in subjects born after a normal duration of gestation, unadjusted and adjusted for various factors, including GA in the 37–41 week span. Optimizing prenatal growth could have a beneficial effect on school achievement at a population level. Nevertheless, the beneficial effects seem to be rather small in comparison with effects of the confounders presented in Table 5, given that BW and BL effects were in the order of 2% of the mean and 5% of s.d. on the school performance tests.Reference Kramer27 This observation was supported by the fact that the strength of the association, as estimated by the t-values, in the case of the confounders, had generally greater values than those for BW and BL. However, those confounders most strongly associated with the outcomes were typically the ones known to also influence birth size.Reference Torche and Echevarría28 Although it seems difficult to disentangle the relative importance of prenatal growth and SES, a recent study on Chilean twins and SIMCE test scores concluded that intrauterine growth restriction has a detrimental effect on cognitive development in childhood, which interacts with family SES, so that low-SES families reinforce the effect of low BW and high-SES families fully compensate for it.Reference Christensen, Petersen and Skytthe29 Similarly, a study conducted in Denmark showed a much smaller association between perinatal variables and cognitive test scores, most probably because of the high educational attainment in that country, which may permit to compensate perinatal effects;Reference Christensen, Petersen and Skytthe29 a similar explanation may apply to the results of another study conducted in the United Kingdom.Reference Pearce, Deary and Young30
Mathematics scores seemed to be more sensitive than the language scores to perinatal influences. In most studies, both scores have been shown to be highly correlated,Reference Horwood and Fergusson31, Reference Yeh32 close to 60%, and could be predicted by the other in the present study. Although each test has independently calculated scores, and direct comparison between language and mathematics scores cannot be done,10 this unexpected association seems to be valuable to interpret the higher results in mathematics.
The proportions of children in the total study population falling below the selected cut-offs in Table 6 showed that those indicators of non-optimal foetal growth have a relatively high prevalence in Chile.
Recent long-term follow-up studies – including birth cohorts and intervention trials – provide convincing evidence that maternal and foetal undernutrition, resulting in smaller infants, have long-term implications on health and human capital by affecting cognitive development.Reference Victora33, Reference Uauy, Kain and Mericq34 Further research into the link between maternal nutrition and long-term health outcomes is a high priority area.Reference Fall and Sachdev35
Acknowledgements
None.
Financial Support
This research received no specific grant from any funding agency, commercial or not-for-profit.
Conflicts of Interest
This research received no specific grant from any funding agency, commercial or not-for-profit sectors.
Ethical Standards
The authors assert that all procedures contributing to this work comply with the ethical standards of the relevant national guidelines on human experimentation, as stated by the Ethical Committee of the School of Medicine, Pontificia Universidad Católica de Chile and with the Helsinki Declaration of 1975, as revised in 2008, and have been approved by the Ethical Committee of the School of Medicine, Pontificia Universidad Católica de Chile, without the need to include informed consent from parents or tutors. The anonymity of the children was observed during the whole study. The NINN served only for the anonymous linking in the computational database and not for any other purpose.