People frequently need to know how they should act in social settings. Most people take into consideration how they think others see the situation and what they perceive others might expect them to do. However, people differ in the degree to which they control their own behavior and adapt to those perceived expectations in social contexts. Self-Monitoring (SM) is a concept that refers to individual differences in the degree to which people observe, regulate, and control their image and their expressive behavior (Snyder, Reference Snyder1974; Reference Snyder1987). People who are high in SM are oriented toward social approval and inclusion, while those who are relatively low in SM are more motivated to be consistent with their internal beliefs and values regardless of the situation.
The degree to which people monitor social environments and adjust their behavior to the context is at the core of the SM concept (Snyder, Reference Snyder1979). That is, low in SM want to be coherent with their internal states and thus they tend to show more attitude-behavior correspondence than people relatively high in SM, whose behavior is guided by situational cues (Ajzen, Timko, & White, Reference Ajzen, Timko and White1982). Given the potential of this construct to make predictions about the correspondence of internal states and observable behavior, SM has become a personality variable widely used to understand some psychological constructs in the social cognition domain, such as attitudes and persuasion, social influence, and all kinds of variations of priming (DeMarree, Wheeler, & Petty, 2005; Petty & Wegener, Reference Petty and Wegener1998; see, Briñol & Petty, Reference Briñol, Petty, Albarracín, Johnson and Zanna2005, for a review on individual differences in attitude change).
Although this motivation to control social behavior may vary depending on a large number of situational factors, the present paper is focused on SM as an individual difference that remains relatively stable over time. In fact, SM is one of the most widely used personality measures (Briggs & Cheek, Reference Briggs and Cheek1988). For example, only in the last five years, a quick search on PsycINFO run on February the 12th 2015 reveals that the construct of self-monitoring appears in the title of 1,360 published articles.
Due to the importance of this psychological construct for understanding social behavior in many different domains, there are various instruments designed to measure individual differences in SM (e.g., Lennox & Wolfe, Reference Lennox and Wolfe1984; Snyder, Reference Snyder1974). The present research focuses on the adaptation of the Revised Self-Monitoring Scale (Snyder & Gangestad, Reference Snyder and Gangestad1986) to the Spanish language. This scale is widely used in individual differences literature and has been the center of a large series of scientific publications (e.g., Chen, Shechter, & Chaiken, Reference Chen, Shechter and Chaiken1996; DeBono & Krim, Reference DeBono and Krim1997). Therefore, the primary goal of the present research is to provide a short, reliable and valid instrument to assess individual differences in SM in Spanish.
The Self-Monitoring Scale
Snyder (Reference Snyder1979) developed the Self-Monitoring Scale to evaluate individual differences in this psychological construct. The original scale presented adequate psychometric properties in terms of validity and reliability. Despite the wide use of this measure, some questions have emerged over this version of the scale, mostly with respect to its factor structure. That is, although Snyder (Reference Snyder1979) argues that the original scale is unidimensional, others have argued that it has a two-factor structure (e.g., Briggs & Cheek, Reference Briggs and Cheek1988; Lennox & Wolfe, Reference Lennox and Wolfe1984). From this latter point of view, the first factor (i.e. Public Performing) is concerned with the propensity to perform in social situations, and the second one (i.e. Other-Directedness) refers to displaying what others expect one to do in social situations (see Nowack & Kammer, Reference Nowack and Kammer1987; Penner & Wymer, Reference Penner and Wymer1983; for further details). In an attempt to reconcile what it might seem as a discrepancy with regard to the scale structure, Snyder and Gangestad presented the 18-item revised Self-Monitoring Scale (Snyder & Gangestad, Reference Snyder and Gangestad1986). This instrument is similar but psychometrically superior to the original 25-item measure (see also Briggs & Cheek, Reference Briggs and Cheek1988). More recently, Gangestad and Snyder (Reference Gangestad and Snyder2000), compared the revised scale with the original one and found that the new scale has both a high internal consistency (α = .70) and a purer factor structure.
In sum, the revised version of the Self-Monitoring Scale allows for a two-factor explanation but the construct may also be interpreted as unidimensional, identifying people simply as high or low in SM. The main goal of the present research is to adapt the revised Self-Monitoring scale to Spanish, since it is a measurement instrument with a good conceptual and methodological refinement.
Furthermore, despite the numerous publications on SM, to our knowledge there is not previous evidence in which the factorial validity has been studied using Confirmatory Factor Analysis. Thus, as a second goal, adapting the scale would allow us to provide with a further examination of the underlying factor structure.
In accordance with the recommendations of several authors (e.g. Cicchetti, Reference Cicchetti1994), a third goal is to reduce the length of the scale without affecting its psychometric properties in order to facilitate its use, especially in applied contexts. A final goal of the present research is to examine the extent to which the Spanish version of the SM scale is different from other constructs and capable of predicting the extent to which attitudes can predict behavioral intentions.
STUDY 1: Factorial Validity
Participants and Procedure
For this study, 383 participants (75% female), ranging from 18 to 65 years of age (M = 28 years; SD = 13) volunteered to complete the SM scale. Participants were recruited through an invitation to participate in a personality study for undergraduates and their relatives in Universidad Autónoma de Madrid. The study was presented as research on personality variables, and participants were informed that all collected data would be treated anonymously and confidentially. Participants completed the 18-item Self-Monitoring questionnaire translated into Spanish, indicating whether each item was True or False.
The current study was carried out following established recommendations for successfully adapting measures from one culture to another (Muñiz & Hambleton, Reference Muñiz and Hambleton2000) and the revised model of the European Federation of Psychologists’ Associations (EFPA) for the evaluation of the quality of tests (Evers et al., Reference Evers, Muñiz, Hagemeister, Hstmaelingen, Lindley, Sjoberg and Bartram2013). Specifically, a bilingual translator (Spanish-English) translated all items from the original 18-item Self-Monitoring scale to Spanish (Snyder & Gangestad, Reference Snyder and Gangestad1986). The translator was a person with knowledge of the SM literature and some experience related to the construction of personality questionnaires. Next, another bilingual translator translated the Spanish version back to English. Finally, two expert researchers compared this final translation with the original scale, reaching to a final Spanish version by consensus with the translators.
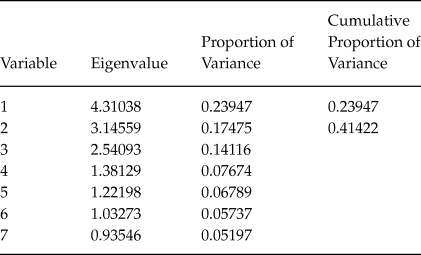
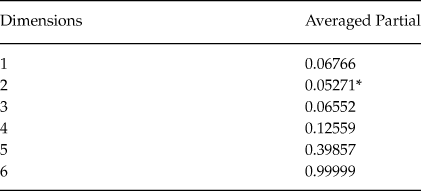
We conducted a pilot study with the purpose of reducing the scale in order to ease its use in applied research contexts. In this study, 154 participants completed the Spanish version of the 18-item scale. An Exploratory Factor Analysis was run, using the tetrachoric correlation matrix, Unweighted Least Squares as the estimation method, and Direct Oblimin as the rotation method (Ferguson & Cox, Reference Ferguson and Cox1993). Based on the scree plot and MAP (O´Connor, Reference O’connor2000) results , two factors were extracted, explaining more than 40 percent of the total variance (see Table 1 and Table 2). Both statistical and theoretical criteria (Sireci & Faulkner-Bond, Reference Sireci and Faulkner-Bond2014) were used for the scale reduction. Selected items were thought to best theoretically represent each dimension, in addition to having > .40 factor loadings and a > .30 item-test correlation. Nine items remained in the scale after the selection process. The correlation with the 18-item version was .91.
Eigenvalues and proportion of explained variance

Minimum Average Partial test results

Note: *Advised number of dimensions: 2
Results
Reliability
The nine-item version test demonstrated acceptable internal reliability (α = .71). All items presented a corrected item-test correlation higher than .30, with the exception of two items (.29).
Factorial Validity
In order to analyze the factorial structure of the scale, a confirmatory factor analysis was run using LISREL 8.80. Robust Diagonally Weighted Least Squares (DWLS) estimator was used for the item-level CFAs. DWLS is appropriate for categorical-dichotomous data and small-to-moderate sample sizes (Flora & Curran, Reference Flora and Curran2004; Wirth & Edwards, Reference Wirth and Edwards2007). Three theoretical models were proposed and tested for this scale. The first one (G-Factor Only Model) consisted of one latent factor labeled “Self-Monitoring”, the second one (Correlated-Factors Model) consisted of two correlated factors labeled “Public Performance” and “Other-Directedness”, and the third one (BiFactor Model), specified that each item loads onto a g-factor as well as another specific s-factor (i.e., Either “Public Performance” or “Other-Directedness”). The former two models have been the most used when it comes to explaining the instrument’s latent structure (Gangestad & Snyder, Reference Gangestad and Snyder2000). On the other hand, the bifactor model may be used as evidence to support either one of the first two models (Cheng, West, & Sousa, Reference Cheng, West and Sousa2006). As Table 3 shows, all models yield good absolute and relative fit indexes. Specifically, we used the following fit indexes: Chi-square, Goodness of Fit Index (GFI), Non-Normed Fit Index (NNFI or TLI), Comparative Fit Index (CFI), the Consistent Akaike Information Criteria (CAIC) and Root Mean Square Error of Approximation (RMSEA).
Confirmatory Factor Analysis of the items from the translated and shortened self-monitoring scale. Study 1 (Estimation method: Diagonally weighted least squares)

Note: All χ2: P < .01.
Confirmatory Factor Analysis of the items from the translated and shortened self-monitoring scale. Study 2 (Estimation method: Diagonally weighted least squares)

Note: All χ2: P < .001.
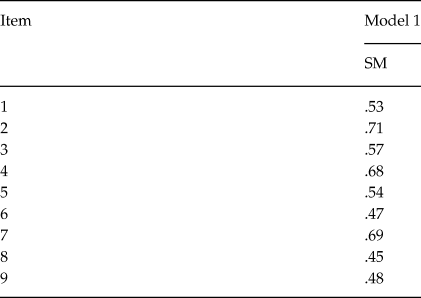
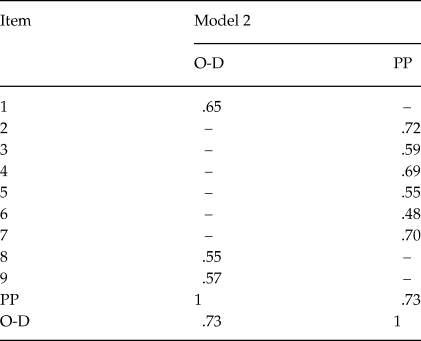
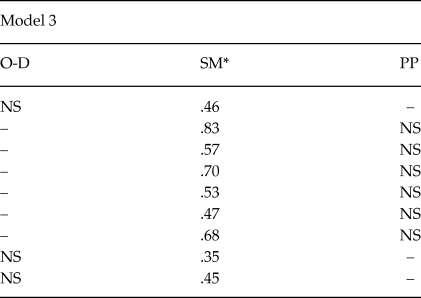
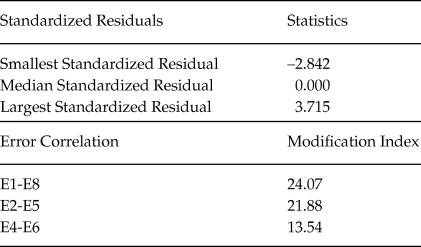
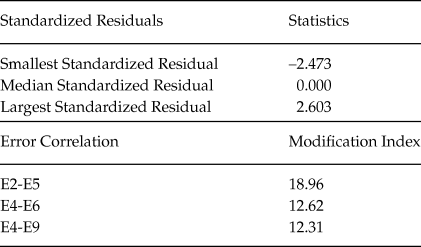
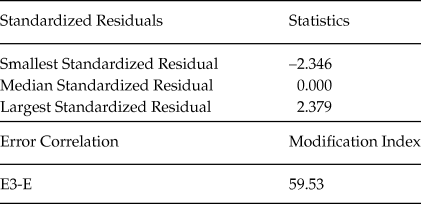
The lower the values of chi-square, CAIC and RMSEA, and the higher the values of GFI, CFI and TLI, the better the model fits the data. Precisely, as a general rule, it can be pointed out that GFI ≥ 0.95, TLI ≥ 0.90, CFI ≥ 0.90 and RMSEA ≤ 0.08 indicate an adequate fit to the data (Hu & Bentler, Reference Hu and Bentler1999). On the other hand, CAIC is a comparative index that penalizes model complexity (Bozdogan, Reference Bozdogan1987). Tables 5 to 7 show the standardized solution for the three models. All weights in the three models were significant (p > .05), although weights in model 2 are generally higher. Tables 8 to 10 show areas of low fit in the models. These results suggest that all models offer an overall equally robust factorial structure Footnote 1 , but regression weights of model 3 suggest that most of the variance could be due to a general factor. For this reason, a unidimensional approach of the scale provides the most adequate fit to the data. Thus, in the present research, we have not used the two specific factors.
Standardized solution in model 1

Standardized solutions and correlations between factors in model 2

Standardized solutions and correlations between factors in model 3

Note: NS = Not Significant.
* General Factor of Self-Monitoring. All weights for this factor are significant (p < .01)
Summary Statistics for Standardized Residuals and Largest Modification Indexes for Model 1 in Study 1

Summary Statistics for Standardized Residuals and Largest Modification Indexes for Model 2 in Study 1

Summary Statistics for Standardized Residuals and Largest Modification Indexes for Model 3 in Study 1

Discussion
Confirmatory Factor Analysis showed that a one latent factor model provided the best fit to the data. As Gangestad and Snyder (Reference Gangestad and Snyder2000) suggest, however, both the unidimensional and bidimensional structures of the SM construct are conceptually plausible. As we noted, these two possibilities are consistent with most of the existing literature (Briggs & Cheek, Reference Briggs and Cheek1988; Lennox & Wolfe, Reference Lennox and Wolfe1984). Since both models yield similar fit indices but the third model tends to favor the unidimensional interpretation, we consider the general factor interpretation of the scale to be the most plausible interpretation of the current findings. After analyzing the properties of the scale, we moved to examine the extent to which the scale was related to other individual differences constructs.
STUDY 2: Discriminant Validity
In Study 2, the main goal was to analyze the relationship between the new shortened translated version of the SM scale and some other constructs that have been historically related to it (Lennox & Wolfe, Reference Lennox and Wolfe1984; Snyder & Gangestad, Reference Snyder and Gangestad1986). Therefore, in this study, we compared scores on SM with scores in Social Desirability, Extroversion, and Need for Cognition.
Participants and Procedure
Participants were 139 undergraduate students (75% female) with ages ranging from 18 to 44 (M = 20; SD = 3.5), recruited via an invitation to participate in the study sent to college students in the Psychology building in the Universidad Autónoma de Madrid. The procedure was similar to the one followed in Study 1. The study was presented as research regarding individual differences, and participants were informed that all data collected for this study would be treated confidentially and anonymously. Participants completed a questionnaire that included the shortened version of the SM scale in Spanish, the Social Desirability Scale (Crowne & Marlowe, Reference Crowne and Marlowe1960), the Extroversion subscale from the Big Five (Costa & McRae, Reference Costa and McRae1992) and the Need for Cognition Scale (Cacioppo & Petty, Reference Cacioppo and Petty1982).
Instruments
Social Desirability
This construct refers to the tendency of people to answer questions in a manner that will be viewed favorably by others (Crowne & Marlowe, Reference Crowne and Marlowe1960). Among other reasons, the relationship between the Spanish version of Social Desirability (Ferrando & Chico, Reference Ferrando and Chico2000) and SM was analyzed because both constructs pertain to the importance of social presence as a source of change in one’s behavior. One could argue, in fact, that SM is just a different expression of Social Desirability. Despite their theoretical similarities, correlations between their respective scales have been in the –.2 range (Fuglestad & Snyder, Reference Fuglestad, Snyder, Leary and Hoyle2009). Actually, there are some differential predictions of criterion behaviors that help to distinguish the concern for social appropriateness (Self-Monitoring) from the defensive posturing to avoid disapproval (Social Desirability; Snyder, Reference Snyder1974). Based on this evidence, it was predicted that there would be no relation between these two measures.
Extraversion
In the Big Five theory of personality (Costa & McRae, Reference Costa and McRae1992), Extraversion is one of the five core traits believed to make up human personality. Extraversion is characterized by sociability, talkativeness, assertiveness and excitability. We used the Spanish version of the scale developed by Benet-Martínez and John (Reference Benet-Martínez and John1998). Although previous versions of the scale included an “Extraversion” factor, the unidimensional nature of this version lead to the prediction that SM, measured with this scale, would correlate positively, yet moderately, with Extraversion because of similar conceptual elements.
Need for Cognition
The Spanish version of Need for Cognition (Falces, Briñol, Sierra, Becerra & Alier, Reference Falces, Briñol, Sierra, Becerra and Alier2001) was also included for discriminant validity purposes. Need for Cognition (NC) refers to a person’s preference for the activity of thinking (see Petty, Briñol, Loersch, & McCaslin, Reference Petty, Briñol, Loersch, McCaslin, Leary and Hoyle2009, for a recent review). It was predicted that these two constructs would not correlate significantly with each other since adapting one’s behavior to the situation (high SM) does not necessarily require more liking for the activity of thinking (high NC), an activity that can actually be done automatically (Chartrand & Bargh, Reference Chartrand and Bargh1999).
Results and Discussion
As expected, the correlation between Social Desirability and Self-Monitoring was nonsignificant (r = 0.06, p > .45) as well as the relationship between Self-Monitoring and Need for Cognition (r = 0.12, p = .14), while the correlation between Self-Monitoring and Extraversion (r = 0.28 p ≤ .001) was significant but low, suggesting that although related, these are two unique constructs. Finally, the Cronbach’s alpha of participants’ scores on the Self-Monitoring scale was .73. A Confirmatory Factor Analysis was run, testing the same models that were tested in Study 1 using the sample of Study 2. The results obtained support the conclusions drawn from Study 1 (see Table 4).
The present findings replicate previous ones (e.g. Leary & Hoyle, Reference Leary and Hoyle2009), suggesting that our shortened translated instrument resembles not only the structure, but also the relation between Self-Monitoring and other similar constructs. Future work should also examine the relationship between this version of the SM scale and other recently validated instruments relevant to the domains of social cognition, such as the Spanish version of the Need for Closure Scale (Horcajo, Díaz, Gandarillas, & Briñol, Reference Horcajo, Díaz, Gandarillas and Briñol2011), and the Spanish version of the Need to Evaluate Scale (Horcajo, Díaz, Briñol, & Gandarillas, Reference Horcajo, Díaz, Briñol and Gandarillas2008). The next step in analyzing the properties of the new instrument consisted of examining its long-term consistency.
STUDY 3: Test-Retest Reliability
The goal for this study was to analyze the test-retest reliability for the shortened Spanish Self-Monitoring scale. In previous studies, the range of test-retest reliability for the different versions of the SM scale varies between .55 in a two-year period (Anderson, Reference Anderson1991) to a .83 in an one-month interval (Snyder, Reference Snyder1974). In the present study, our aim was to test the temporal stability of the proposed version of the scale.
Method
Participants and Procedure
One hundred and sixty-four participants Footnote 2 (76% female) ranging from 21 to 68 years of age (M = 39.2; SD = 10.38) volunteered for an online study. Participants were contacted and filled out the questionnaire through Qualtrics software. Just as in Study 1, participants were recruited through an invitation to participate in an online personality study for undergraduates and their relatives. The study was presented as a research on personality variables, and participants were informed that all collected data would be treated anonymously and confidentially. Participants completed a questionnaire with the 9-item Spanish SM questionnaire. After 48 days, participants were contacted again to complete the same questionnaire.
Results
Test-Retest Correlation
Participants’ scores showed a good temporal reliability, with a test-retest correlation of r = 0.71, p < .0001. Also, participants’ scores reliability was α = .72 Footnote 3 . These results suggest that the scale’s temporal stability is similar to the original English revised version (Snyder, Reference Snyder1974).
Discussion
The results of Study 3 indicate that the proposed version of the scale has a good temporal stability, just as the original English revised version. Despite the high variance in the sample, the results are stable enough to claim that the measure is as stable in time as the original English version. After showing that our shortened translated instrument has a good, reliable structure, we finally moved to the examination of its ability to predict relevant outcomes.
STUDY 4: Predictive Validity
The goal for this study was to analyze the validity of the shortened version of the SM scale by measuring attitudes and behavioral intentions and by examining the extent to which our shortened translated instrument could moderate the relationship between those two constructs. In line with previous research (Azjen et al., 1982), it was predicted that the consistency between attitudes and behavioral intentions would be moderated by the scores on the SM scale. People low in SM are interested in acting according to their internal states, and thus they are likely to show more attitude-behavior correspondence than those who score high in SM (more likely to act in accord with external rather than internal demands; Snyder & Swann, Reference Snyder and Swann1976; Zanna, Olson, & Fazio, Reference Zanna, Olson and Fazio1980).
Method
Participants and Procedure
One hundred and thirty-nine undergraduates (75% women) ranging from 18 to 44 years of age (M = 20.82; SD = 3.518) at the Universidad Autónoma de Madrid participated in partial fulfillment of a course requirement. Participants completed a questionnaire with all necesary instructions. Specifically, they began by reading a cover story that led them to believe they were taking part in a research regarding students’ opinions about eating vegetables. Next, they were asked to indicate their attitudes and their behavioral intentions towards vegetables. A measure of Self-Monitoring was taken using the current Spanish scale. Finally, participants were debriefed, thanked and dismissed.
Independent/predictor Variables
Attitudes
Participants were asked to answer to a series of questions related to their opinion towards vegetables. Specifically, attitudes toward vegetables were measured by using three 9-point (1–9) semantic differential scales (i.e., valuable, fundamental, and recommendable). Scores on the three total items were averaged to form a composite measure of attitudes (α = .70). Similar measures have been used in previous studies to evaluate attitudes toward vegetables (e.g. Briñol, Horcajo, Becerra, Valle, & Gallardo, Reference Briñol, Horcajo, Becerra, Valle and Gallardo2004; Briñol, Petty, & Tormala, Reference Briñol, Horcajo, Becerra, Valle and Gallardo2004)
Self-Monitoring
After reporting their attitudes, participants completed the 9-item version of the SM scale in Spanish. (α = .72). Footnote 4
Dependent Measures
Behavioral Intentions
Participants’ behavioral intentions towards vegetables were measured by using three 9-point (1–9) semantic differential scale asking the occurrence likelihood of future events (i.e., “I will recommend other people to eat vegetables”, “I will pay close attention to a conversation about vegetables”, “I will read a blog on vegetables”). Scores on the two total items were averaged to form a composite (α = .66).
Results
Behavioral Intentions
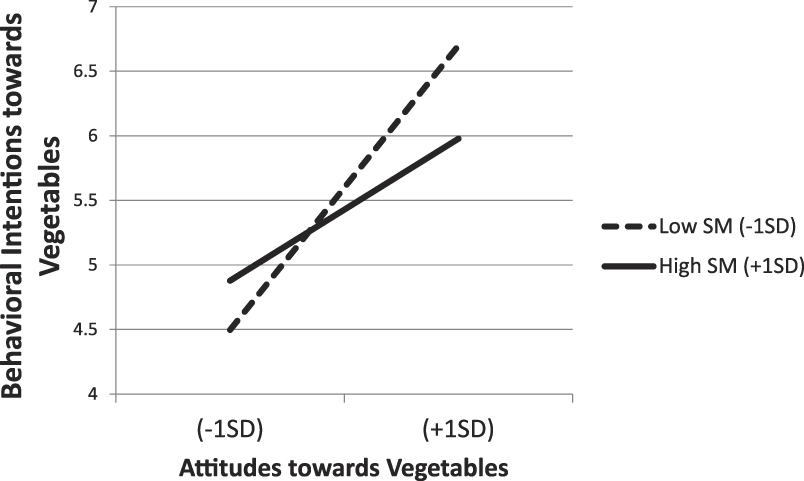
It was predicted that attitudes would be a significantly better predictor of behavioral intentions for participants who scored lower in the SM scale than for those who scored higher. Regressing the behavioral intentions index onto the relevant variables (SM and Attitudes), a significant interaction emerged between the attitude index and the SM scale B = –0.819, t(138) = –2.121, p = .035. As expected, this interaction revealed that participants’ attitudes exerted a stronger effect on behavioral intentions when scores in the SM scale were lower, B = 0.8138, t(138) = 5.890, p < .001, than when they were higher, B = 0.406, t(138) = 3.195, p = .001.
Two-way interaction between Self-Monitoring and Attitudes towards Vegetables on Behavioral Intentions towards Vegetables.

General Discussion
The current research introduces a new instrument in Spanish, capable of measuring SM through the adaptation and shortening of the 18-item Self-Monitoring Scale (Gangestad & Snyder, Reference Gangestad and Snyder1985; Snyder & Gangestad, Reference Snyder and Gangestad1986).With regard to reliability measures, the four samples in the Self-Monitoring Scale offered good reliability scores. All items showed a correlation higher than .29 with the rest of the scale in all the studies. Moreover, the factorial validity of the scale was tested using Exploratory Factor Analysis and Confirmatory Factor Analysis (CFA). As noted, to the best of our knowledge, this is the first time that this scale has been analyzed with this latter approach. Previous research has only used Exploratory Factor Analysis (EFA), a technique lacking of the precision and flexibility that CFA offers (see Floyd & Widaman, Reference Floyd and Widaman1995). The results of our analysis (e.g., Model 3) revealed that a greater amount of variance may be explained by the g-factor (versus the two specific factors), indicating that the unidimensional approach was the most adecuate. Both the unidimensional and bidimensional models offer a good fit to the data.
In the second study, correlations between the Self-Monitoring Scale and other constructs were either low or non-significant, showing good discriminant validity. The third study showed that the temporal stability is equally good to that of the original measure (Snyder, Reference Snyder1974). Finally, in the fourth study low self-monitors relied more on internal cues to guide their intentions and behavior than high self-monitors did.
Why Do We Need a Self-Monitoring Scale in Spanish?
Individual differences in SM have been shown to have ample implications over diverse psychological phenomena. Researchers examining human behavior in social context can benefit from examining individual differences in SM. For instance, it has been shown that high self-monitors tend to attribute their own behavior to situational influences and to define their identities in terms of situational features (Snyder, Reference Snyder1979) while someone lower in SM would be more likely to explain his/her behavior on the basis of his/her own internal principles. Similarly, Fuglestad and Snyder (Reference Fuglestad, Snyder, Leary and Hoyle2009) argue that high and low self-monitors ask themselves different questions when facing social situations. High self-monitors ask, “Who does this situation want me to be and how can I be that person?” whereas low self-monitors ask “Who am I and how can I be me in this situation?”.
These different self-conceptions extend to a wide variety of social situations, including work-related and inter-personal behaviors and decisions. For instance, high self-monitors usually report greater job involvement, greater role ambiguity, and less commitment to the job than low self-monitors (Day, Schleicher, Unckless, & Hiller, Reference Day, Schleicher, Unckless and Hiller2002). Concerning romantic relationships, low self-monitors look for the growth of trust, commitment, and satisfaction and are more prone to steady, long-term relationships compared to high self monitors (e.g., Snyder & Simpson, Reference Snyder and Simpson1984). With regard to friendship, high self-monitors prefer to perform an activity (such as playing tennis) with friends who are highly skilled in the activity, whereas low self-monitors choose to perform the activity with friends they like best (Snyder, Gangestad, & Simpson, Reference Snyder, Gangestad and Simpson1983).
SM also influences the way people perceive status implications in their social interactions. That is, high self-monitors are more likely to offer their help to others and ask for others’ help than low self-monitors, while they give the impression of a generous exchange partner (Flynn, Reagans, Amanatullah, & Ames, Reference Flynn, Reagans, Amanatullah and Ames2006). This ability to understand group dynamics and adapt to the demands of the environment is a potential explanation of why high self-monitors tend to acquire elevated social status among their peers.
Not only researchers interested in social interactions could find this instrument highly useful, but also other researchers conducting more basic research in the lab. Consider the topic of prime-to-behavior. Primed social constructs can influence a wide variety of outcomes, ranging from person perception to performance and motor behavior (Dijksterhuis & Bargh, Reference Dijksterhuis and Bargh2001; Horcajo, Briñol, & Becerra, Reference Horcajo, Briñol and Becerra2009). Recent research has shown priming people with stereotypes can affect self-perceptions. For example, in one study, participants who were primed with the African American stereotype demonstrated increased feelings of aggressiveness compared to control participants (Briñol, DeMarree, & Petty, in press; see also, DeMarree, Wheeler, & Petty, Reference DeMarree, Wheeler and Petty2005). According to the Active-Self Model (Wheeler, DeMarree, & Petty, Reference Wheeler, DeMarree and Petty2007), changes in self-perceptions and behavior are particularly likely to occur when people view the accessible mental contents as self-diagnostic. Importantly, individual differences in SM can determine whether accessible mental contents are seen as self-diagnostic, and thus are influential on one’s own self-views and behavior. As noted, research finds that low self-monitors, who are likely to modify self-perceptions in response to information that seems to be self-informative, show changes in self-perceptions and behavior following out-group primes (DeMarree et al., Reference DeMarree, Wheeler and Petty2005; Wheeler et al., 2008). As this example illustrates, having a valid measure of SM in Spanish can help researchers to find differences in subtle phenomenon such as priming.
In conclusion, previous research shows that SM is a very relevant construct in order to understand and predict numerous psychosocial processes. All this evidence suggests that having a valid and reliable instrument in Spanish that allows evaluating SM in a simple way may prove very useful for many Spanish-speaking researchers interested in these psychological phenomena. Having this simple, valid, precise, and reliable instrument available in Spanish will allow researchers to analyze moderation processes over a great amount of social phenomena.
Appendix I. Items of the Scale